GROWING UP IN SCOTLAND:
Parental service use and informal
networks in the early years
Parental service use and informal
networks in the early years
© Crown copyright 2011
You may re-use this information (excluding logos and images) free of charge in any format or medium, under the terms of the Open Government Licence. To view this licence, visit http://www.nationalarchives.gov.uk/doc/open-government-licence/ or e-mail: [email protected].
Where we have identified any third party copyright information you will need to obtain permission from the copyright holders concerned.
This document is available from our website at www.scotland.gov.uk.
ISBN: 978-1-78045-199-2 (web only)
The Scottish Government St Andrew’s House Edinburgh
EH1 3DG
Produced for the Scottish Government by APS Group Scotland DPPAS11600 (06/11)
Parental service use and informal
networks in the early years
Judith Mabelis and Louise Marryat
Prepared for the Scottish Government: Children and Families Directorate by the Scottish Centre for Social Research
Suggested citation: Mabelis, J. and Marryat, L. (2011) Growing Up in Scotland:
ACKNOWLEDGEMENTS
First and foremost, the authors of the report would like to thank all the families who have given up their time to take part in the study and have supported it continuously sweep by sweep.
The Growing Up in Scotland study is very much a collaborative venture. We owe a huge debt of gratitude to our colleagues in NatCen’s operations and computing departments and to our team of interviewers and supervisors for conducting the interviews with such dedication and professionalism.
We would also like to thank everyone involved in the preparation of this report –
particularly Wendy van Rijswijk and colleagues at the Scottish Government who provided feedback on early drafts.
Responsibility for the opinions expressed in this report, and for all interpretation of the data, lies solely with the authors.
GROWING UP IN SCOTLAND:
EXECUTIVE SUMMARY v
1 INTRODUCTION 1
1.1 Background to the research 2
1.2 Research questions 4
1.3 The Growing Up in Scotland study 5
1.4 Technical appendix 5
2 WHAT SERVICES DO PARENTS USE IN THE EARLY YEARS AND
WHO USES THEM? 6
2.1 Introduction 7
2.2 Key findings 7
2.3 What is service use? 8
2.4 Use of services during pregnancy and the first year 8
2.4.1 Volume of service use at 10 months 9
2.5 Service use during the fifth year 10
2.5.1 Volume of service use scale at year 5 11
2.6 Who are the low service users? 12
2.6.1 Who are the low service users at year 1? 12
2.6.2 Who are the low service users at year 5? 14
2.7 Changes in service use between year 1 and year 5 15
2.8 Repeated low service use 16
3 WHY ARE SOME MOTHERS DISENGAGED WITH FORMAL SERVICES? 18
3.1 Introduction 19
3.2 Key findings 19
3.3 Reasons for non-attendance at ante-natal classes and baby/toddler groups 20
3.3.1 Ante-natal classes 20
3.3.2 Mother and baby groups 20
3.3.3 Toddler groups 21
GROWING UP IN SCOTLAND:
Parental service use and informal networks in the early years
iv
4 ATTITUDES TOWARDS ENGAGING WITH FORMAL SUPPORT 25
4.1 Introduction 26
4.2 Key findings 26
4.3 Attitudes towards formal support at 10 months 27
4.4 Attitudes towards formal support at age 4 29
4.5 Changing attitudes towards formal support 32
5 WHAT IS THE ROLE OF INFORMAL SOCIAL SUPPORT AND
HOW DOES IT RELATE TO PATTERNS OF SERVICE USE? 36
5.1 Introduction 37
5.2 Key findings 37
5.3 Informal support during the first five years 38
5.4 The relationship between formal and informal support 39
5.5 Low overall support 40
6 CONCLUSIONS 42
6.1 Summary of main findings 43
6.2 Implications for policy and practice 45
REFERENCES 47
APPENDIX 1 – FURTHER DETAIL ON EXPLANATORY AND OUTCOME
VARIABLES 50
Social background variables 51
Introduction
In recent years, children’s early years have been stressed as being fundamentally important to their future development and consequently to society as a whole. As such, a wealth of policy initiatives – including the Early Years Framework, Getting it right for every child, and Equally Well – have been introduced aimed at improving the experiences children have in the early years through supporting families and increasing parenting capacity. Currently in Scotland, a range of approaches are in place to support families, from universal ante-natal classes and initiatives such as Triple P, to more targeted interventions like the ‘Family Nurse Partnership’ and ‘You First’, both currently piloting in the Lothian area. However, the success of the majority of parenting support policies and interventions relies on the voluntary participation of parents. Existing GUS research shows that some parents are reluctant to ask for help or are unclear who to go to for help. In addition, it is acknowledged that for some families informal supports are of great importance – this should not go unrecognised. This report uses data from the first five years of the GUS birth cohort to explore the relative roles of formal and informal support in the lives of families with young children in Scotland, and attempts to untangle the reasons and attitudes behind why some families may not be getting the support they need.
Characteristics of service use and service users
• Data on use of services was used to classify respondents according to their volume of service use1; 41% were deemed ‘low service users’ when their child was aged
10 months, and 43% were defined as being ‘low service users’ when the child was aged 4 (58 months).
• Respondents with lower maternal educational qualifications and those with lower household income were more likely to be low service users. At age 4, low service usage was further associated with lower socio-economic classification. Mothers who had other children before the cohort child were more likely to be lower service users (at least in relation to this child), though this may reflect the services looked at, e.g. attendance at ante-natal classes is lower amongst mothers who already have children.
• Low service use when the child was aged 10 months did not appear to be a strong predictor of later low service use, suggesting respondents were not stable in their levels of usage.
• The group of repeatedly low service users is likely to be of most concern to policymakers and service providers. Representing 18% of respondents, this group had particular characteristics: they were more likely to have lower educational qualifications and were more likely to be of lower socio-economic status.
• Unexpectedly, parents of children with a long-term illness or disability were more likely to be in the low service group use groups at age 4 and in terms of repeated use. This may be due to the social patterning of such illness and/or because the services included were not all related to child health.
Why some parents don’t use services
Mothers who did not attend ante-natal classes and mother and toddler groups were asked the reason(s) why they did not attend:
• For ante-natal classes, being a first-time mother or not was important; the majority of women with other children suggested that they did not attend because they had done so for a previous pregnancy or because they knew it all already. First-time mothers’ reasons for non-attendance included not liking the group format, not knowing where classes were held and simply for ‘no reason’. Logistical reasons such as time, cost and travel were barriers for very few women.
• Reasons for not going to mother and toddler groups followed similar patterns, with more common reasons amongst respondents being that they didn’t like groups or were shy/awkward about attending, or because there were no groups available or accessible. For a large proportion though, lack of time was also a key factor, particularly for mothers who had returned to work at this stage.
• Reasons for using and not using childcare were also explored. Almost three-quarters of parents who used childcare when their child was 10 months did so to allow them to work, although other common reasons included giving the main carer a break, so that the carer could go shopping or attend an appointment, and because the child liked spending time at the provider.
• On the other hand, the primary reasons for not using childcare at both 10 months and 4 years were that the respondent would rather look after the cohort child themselves or because the respondent rarely needed to be away from the child. Cost was an issue for a small proportion of families at both stages, as was a lack of availability or choice at 10 months. Not surprisingly, cost was more of an issue for lower income households.
GROWING UP IN SCOTLAND:
Parental service use and informal networks in the early years
Attitudes towards formal support
• Using a scale constructed from responses to a series of attitudinal statements, just over a quarter of respondents were found to be ‘reluctant’ service users.
• Reluctant service users at 10 months were found to have lower household incomes, were less likely to be in employment and more likely to have lower educational qualifications. They were also likely to have less confidence in themselves as a parent and to have low actual service use, though the direction of causality is difficult to establish here.
• Analysis at age 4 found similar associations; reluctant service users were more likely have a lower household income, to have lower educational qualifications, to have less confidence in their abilities as a parent and to have low service use. In addition, living in a more urbanised area was related to reluctance to engage with formal services.
The relationship between formal and informal support
• At 10 months, respondents who had lower levels of service use also had lower levels of informal support2, though differences in use of informal support between those with
different levels of service use were small. On a positive note, these findings indicate that almost two thirds of respondents who had lower formal service use did have medium or high informal support. Patterns at age 4 were found to be almost identical.
• Of particular interest to policymakers and service providers are those families who are unsupported, both formally and informally. Just 14% of respondents fell into this group at 10 months. The figure was similar at age 4 at 13%.
• Unsupported respondents were more likely to have lower educational qualifications, to live in a household with no-one in employment and to live in urban areas, all known risk factors in terms of isolation.
GROWING UP IN SCOTLAND:
Parental service use and informal networks in the early years
viii
Conclusion
It is apparent that the parents who service providers and policymakers often most want to reach, i.e. those living in the most difficult circumstances, are those most reluctant to engage. What is more, it is clear that policymakers and service providers cannot rely on parents who do not engage with formal services having high levels of informal support to replace this because, particularly when their children are very young, this is not always the case.
The findings suggest that provision of parenting education, including ante-natally, should be provided in a more targeted way in order to access more families who are resistant to the traditional format. Although services such as ante-natal classes, parenting classes and mother and toddler groups, accompanied by routine check-ups by health
chapter
INTRODUCTION
1.1 Background to the research
The Early Years Framework (Scottish Government, 2008) acknowledges the central importance of parenting and family capacity in delivering improved outcomes for children and families by making this one of the four core strands. In so doing, the Framework highlights the importance of providing parents with appropriate and integrated support which will, amongst other things, allow them “to develop the skills needed to provide a nurturing and stimulating home environment free from conflict” and “meet a range of needs they [parents] may have” (Scottish Government, 2008: 11). The Scottish Government sees the Getting it right for every child approach as the key delivery mechanism for improving children’s services.
Acknowledging the important role of parents in children’s lives and a commitment to supporting this role is not new to Scottish social policy. Over the last decade, the Scottish Government and local authorities have supported the introduction of a range of legislation, policies and interventions focused on improving parenting capacity through the delivery of parenting support and education (Hutton et al, 2008). Such policies range from broad-reaching institution-based ‘universal’ parenting education classes, such as the Triple P programme currently being delivered to parents of Primary 1 children in Glasgow, to more targeted in-home support for key at-risk groups such as young, first-time mothers supported through the intensive services of the ‘Family Nurse Partnership’ and ‘You First’ in the Lothian area.
However, the success of the majority of parenting support policies and interventions relies on the voluntary participation of parents in the programmes, classes, groups and services designed to improve parenting knowledge and skills and ultimately benefit their children. Indeed, recent research with Scottish practitioners delivering services for parents highlights their support for voluntary engagement and co-operation rather than compulsion to attend (Hutton et al, 2008). Yet, existing evidence from the Growing Up in Scotland Study (GUS) has shown that some parents are reluctant to ask for help and/or are unclear who to go to for support (Anderson et al, 2007; Bradshaw et al, 2008a). Furthermore, a history of parenting services being equated with parental failure rather than as a positive support service, has led to the stigmatisation of parenting support when offered by prominent formal agencies. GUS data has illustrated a wariness of such support amongst some parents, particularly those in more disadvantaged circumstances (Bradshaw et al, 2008a). In addition, research using GUS has also demonstrated the significant role played by informal social networks in providing support for families with young children (Bradshaw et al 2008a; Bradshaw and Jamieson, 2009).
GROWING UP IN SCOTLAND:
Parental service use and informal networks in the early years
Introduction
Understanding patterns of contact and engagement with more ‘formal’ parenting services is useful for practitioners in planning and delivering such services and key to ensuring the success of this strand of the Early Years Framework. However, a recent literature review found little available evidence on the characteristics of those who do not engage with services nor on the barriers to and attitudes towards participation
(MacQueen et al, 2008). Indeed, there appears to have been little progress in this area since the Black Report in 1980, which identified women of multiple disadvantage as being less likely to attend ante-natal classes. The issue around this, and other service use, relates back to Hart’s Inverse Care Law, which suggests that the people most in need of support and help were found to be those least likely to access it (Black et al, 1980). The more recent research that exists on the characteristics of those who do not engage has found that characteristics are multiple and can change over time. Hutton et al (2008) found that factors impacting on engagment included low self-esteem and confidence in parents, social isolation and deprivation as well as poor service provision.
As the inverse care law suggests, many of the factors that contribute to poor outcomes, are also thought to be related to accessing services. However this may not always be the case. A recent publication by Hoffait et al (2011) explored whether characteristics
previously linked in research to poorer child outcomes were also related to engagement of younger mothers in the West Lothian Sure Start Young Mums to Be program. The research found that factors such as experiencing domestic abuse, having family problems or mental health issues (among others) were not linked to engagement or disengagement of this vunerable group.
In researching this area, it is also important to acknowledge the significant role informal social support networks play in building a complete picture of parental support in the early years. Informal support for families with multiple disadvantages, but particularly with low incomes, has been recognised as being important in many studies (Bradshaw et al, 2008a; Bradshaw and Jamieson, 2009, McKendrick et al, 2003, O’Connor and Lewis, 1999, among others). However, the role of informal support is often explored separately to the receipt of formal support.
GROWING UP IN SCOTLAND:
Parental service use and informal networks in the early years
4
1.2 Research questions
This report will seek to answer a number of distinct research questions:
1. What services do parents draw on in the early years and how do patterns of service use vary between parents and over time?
2. What might explain differences in service use?
3. What is the role of informal social support and how, if at all, does it relate to patterns of service use?
For the purposes of this project, ‘service use’ is defined as any contact the cohort child’s parent has with a wide range of statutory or voluntary agencies in order to seek advice, information or support in relation to the cohort child3. Services that GUS has asked
parents about include: sources used for advice on pregnancy, child health, behaviour, pre-school and primary school; contact with health and social work professionals; attendance at ante-natal classes; use of childcare, including breakfast clubs and
after-school clubs; and contact with the child’s pre-school or primary school. Some data is also available on attendance at parenting classes and groups. This report will focus on services considered important to parenting and important to parents.
Initial analysis explores the prevalence of each contact and how contact changes over time as the child gets older. Differences in patterns of contact and services used across the various broad service ‘types’ will be explored by key family socio-economic and demographic characteristics including maternal age, household income, number of children in household and birth order, maternal mental health and family type (lone parent versus couple family) in order to examine which factors more strongly influence service use.
In an attempt to understand why patterns of service use vary, the next stage of the analysis will use an additional set of data from GUS which details attitudes towards help-seeking behaviour and formal services. Previous analysis has already shown how these attitudes vary across parents with different characteristics and the relationship between attitudes to help-seeking and use of informal support. GUS also collects a range of data on why parents have not used particular services such as ante-natal classes, childcare, child immunisations, and parent and toddler groups. These data will be explored descriptively to identify any common barriers either for parents as a whole, or for particular sub-groups and whether barriers or reasons change for families over time.
Introduction
The final stage of the analysis will examine specifically the relationship between patterns of informal support and service use. This analysis will explore whether lower use of, and contact with, services is associated with a greater reliance on informal sources of advice and support or whether there is a group of ‘unsupported parents’ which the policymakers and service providers should be particularly concerned about engaging with.
1.3 The Growing Up in Scotland study
The analysis in this report uses information from families in the birth cohort that took part in all of the first five years (sweeps) of GUS (n = 3621).4 Some families who initially
took part in GUS did not do so for all of the subsequent sweeps. There are a number of reasons why respondents drop out from longitudinal surveys and such attrition is not random. All of the statistics have been weighted by a specially constructed longitudinal weight to adjust for non-response and sample selection. Both weighted and unweighted sample sizes are given in each table. Standard errors have been adjusted to take
account of the cluster sampling5.
Interviews took place around six weeks before the child’s birthday, therefore at year 1 of the study, children were 10 months old, at year 2 they were 22 months old, at year 3 they were 34 months, at year 4 they were 46 months and at year 5 they were 58 months. For the purposes of this report, beyond the first interview, the child’s age will be referred to in years. It is worth bearing in mind however that a 1-year-old child at year 2 for example, is actually 22 months old or just under 2.
1.4 Technical appendix
Readers interested in the details of the analyses should consult the Technical Appendix published alongside this report.
4 Further information on the design, development and future of the project is available from the study website: www.growingupinscotland.org.uk
chapter
WHAT SERVICES DO PARENTS USE IN
2.1 Introduction
This chapter looks at the type and number of formal services that parents have accessed in relation to the study child. The analysis starts by identifying the formal services used at age 10 months (year 1) and age 4 (58 months, year 5) and explores the volume of service use at each of these years separately. A scale of service use is developed and using this scale, respondents are classed as either ‘low service users’ or ‘average/high service users’. The analysis then examines the typical characteristics of parents in the low service group at both years 1 and 5 and of repeated low service users – those who are low service users at both years 1 and 5.
2.2 Key findings
• On average, parents had accessed between 4 and 5 services in the year prior to when the child was aged around 10 months old. This figure ranged from a minimum of 0 to a maximum of 11 services across all parents. At age 4, whilst the range in services used was bigger (stretching from 0 to 14), the average number of services used in the previous year had dropped slightly to between 3 and 4.
• At year 1, 41% of parents were classified as ‘low service users’. That is, their service use was lower than average. The corresponding figure at year 5 was similar at 43%.
• Mothers with lower educational qualifications and those with lower incomes were significantly more likely than those with higher qualifications or incomes to be low service users at year 1.
• At year 5, lack of educational qualifications was also associated with low service use, as was having a lower socio-economic classification, being unemployed or employed part-time, and already having children when the cohort child was born.
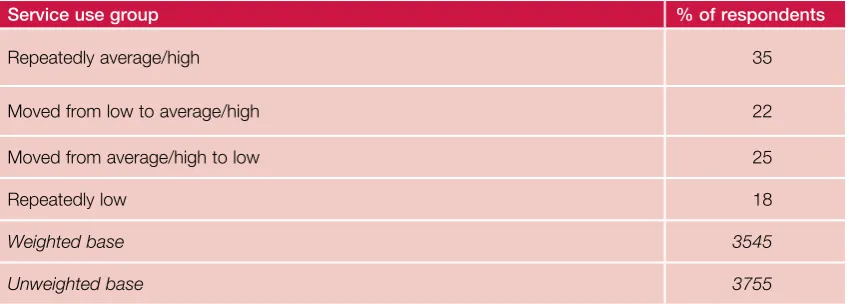
• 35% of parents were classified as average or high service users at both years and a further 22% moved from being low to high service users. However, 25% moved from average/high to low service use and 18% of parents reported low service use at both years. The repeated low use group are of particular interest and concern.
• Repeated low service users were significantly more likely to come from more disadvantaged circumstances. Lower socio-economic classification and lower educational qualifications and having other children prior to the cohort child were all associated with repeat low service use.
GROWING UP IN SCOTLAND:
Parental service use and informal networks in the early years
8
2.3 What is service use?
For the purpose of this research project, ‘service use’ is defined as contact, in-person, that the child’s parent has with a wide range of statutory or voluntary agencies in order to seek advice, information, support or treatment in relation to the study child. This ‘personal contact’ with service providers has been specifically chosen as it represents a willingness to engage formally with the service provider and, it may also be argued, that once in contact with a service professional, the recipient may be referred on to other formal services if needed.
Since it is not possible to know the content and quality of service/advice provided by the wide range of books, magazines and internet sources available to parents, or even if these are in the form of formal or informal advice and support, these have been excluded from the definition of service use, although the authors recognise that these sources of information may well be of use to parents. In addition, it should also be noted that information is not available on the content of the formal services included nor the quality of the service offered. However, for the purpose of this report, formal service contact is considered to be of benefit to the recipient.
It is also recognised that families may be in contact with other services that are not covered in the GUS data such as contact with social workers, or informal contact with professionals (i.e. friends or family members that may be professionals).
2.4 Use of services during pregnancy and the first year
At age 10 months, most of the of the available data on service use relates to the use of health services and in particular those used during the ante-natal and post-natal periods. Given this emphasis on ante-natal and post-natal care, the results below only relate to interviews conducted with the child’s natural mother. Furthermore, the data relates to those services only used in relation to the study child and not for any other children that may be in the household.
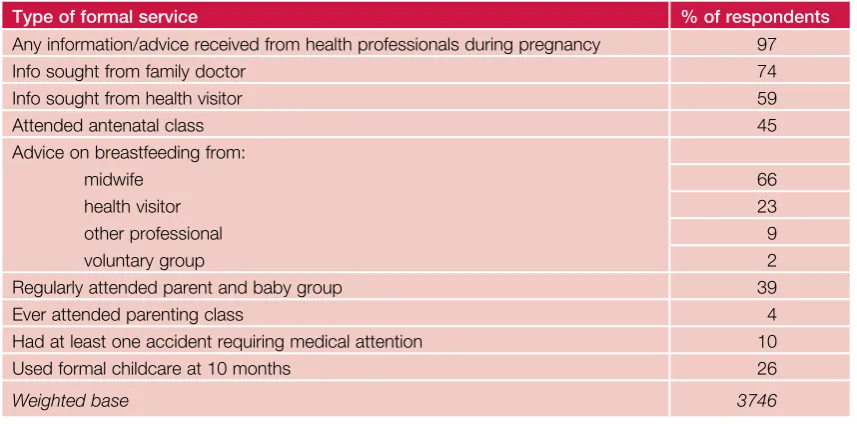
Table 2.1 outlines the frequency and type of formal service use at 10 months. As the table shows, less than half of all mothers (45%) had attended ante-natal classes. Given that these classes are a cornerstone of current service provision for expectant mothers, this variation in uptake is notable. There is however, clear variation in the proportions of first-time mothers and other mothers who attend ante-natal classes: 57% of first-time mothers attended compared with 14% of mothers who already had other children. The reasons for non-attendance at these classes are discussed in section 3.2.
What services do parents use in the early years and who uses them?
numbers received advice from other sources such as other professionals (9%) and voluntary groups (2%).
At this stage, 60% of parents report using childcare, including both informal and formal6
[image:20.595.99.528.311.523.2]provision. Around one-quarter (26%) of families were using formal childcare, such as a private nursery or childminder, when the child was aged 10 months old.
Table 2.1 Use of formal services up to 10 months
Type of formal service % of respondents
Any information/advice received from health professionals during pregnancy 97
Info sought from family doctor 74
Info sought from health visitor 59
Attended antenatal class 45
Advice on breastfeeding from:
midwife 66
health visitor 23
other professional 9
voluntary group 2
Regularly attended parent and baby group 39
Ever attended parenting class 4
Had at least one accident requiring medical attention 10
Used formal childcare at 10 months 26
Weighted base 3746
Note: Birth cohort respondents who completed an interview at 58 months n = 3755 (unweighted).
2.4.1 Volume of service use at 10 months
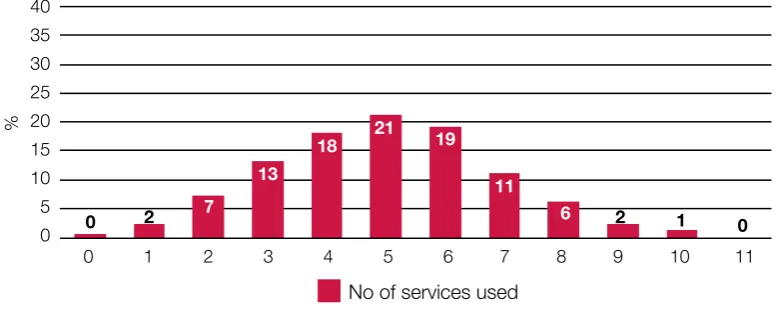
To obtain a picture of the variation in the volume of services being accessed by parents when their child was aged 10 months, a count was taken of each of the individual services in Table 2.1 being used by each mother. The resultant differences in volume of formal service use are shown in Figure 2-A. On average, parents accessed between 4 and 5 services although this figure ranged from 0 to 11 across all parents.
GROWING UP IN SCOTLAND:
Parental service use and informal networks in the early years
[image:21.595.78.469.213.368.2]10
Figure 2-A Number of services used when child aged 10 months
No of services used 40 35 30 25 20 15 10 5 0 %
0 1 2 3 4 5 6 7 8 9 10 11
0 2 7
13 18
21 19
11
6 2 1
0
2.5 Service use during the fifth year
At year 5, when the cohort child was aged 4 (nearly 5), respondents were asked again about their service use during the previous year.
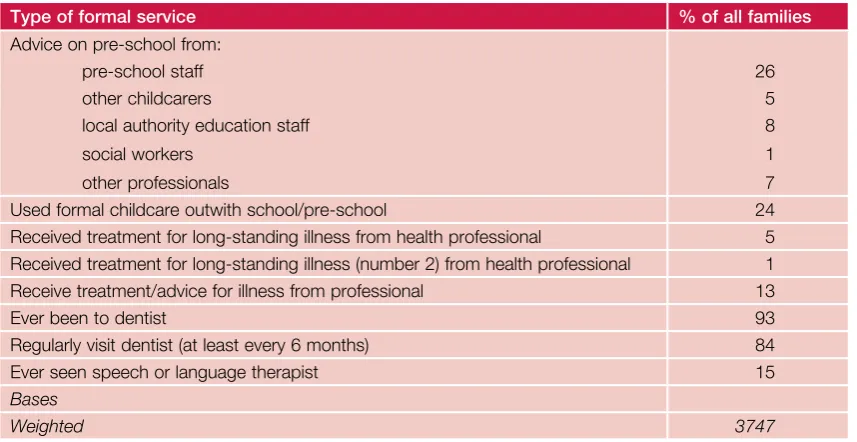
Table 2.2 presents the types of services asked about and the proportion of parents who reported using each service. At this stage, respondents were asked about the child’s attendance at pre-school7, advice sought on selection of pre-school, their use of formal
childcare, treatment received from health professionals for long-standing illnesses, attendance at the dentist and whether they had ever seen a speech and language therapist.
Virtually all children (98%) attended pre-school education. Whilst use of this service is expectedly high, seeking advice on the selection of pre-school was not similarly high. The most popular source of formal advice on pre-school was pre-school staff who had been contacted by 26% of respondents.
Looking at other formal services accessed at year 5 of the study, 24% of parents used formal childcare, outwith school or pre-school. This figure is similar to that seen when the child was 10 months old (though it should be noted that by year 5, almost all children were in some kind of formal school or pre-school education as well as the additional childcare included in this figure). The vast majority of children (93%) had seen a dentist at some point in their life with 84% doing so regularly, at least every 6 months.
What services do parents use in the early years and who uses them?
Table 2.2 Frequency and type of services used at year 5
Type of formal service % of all families
Advice on pre-school from:
pre-school staff 26
other childcarers 5
local authority education staff 8
social workers 1
other professionals 7
Used formal childcare outwith school/pre-school 24 Received treatment for long-standing illness from health professional 5 Received treatment for long-standing illness (number 2) from health professional 1
Receive treatment/advice for illness from professional 13
Ever been to dentist 93
Regularly visit dentist (at least every 6 months) 84
Ever seen speech or language therapist 15
Bases
Weighted 3747
2.5.1 Volume of service use scale at year 5
A count of formal services used at year 5 of the study was also undertaken. The results are illustrated in Figure 2-B. As the Figure shows, the number of services used ranged from 0 to 14. On average, parents had accessed between 3 and 4 services in the year prior to the interview.
Figure 2-B Volume of service use at year 5
No of services used
0 1 2 3 4 5 6 7 8 9 10 11 12 13 14
0 3 6
34 31
16
7 2
50
45
40
35
30
25
20
15
10
5
0
%
[image:22.595.113.495.579.748.2]GROWING UP IN SCOTLAND:
Parental service use and informal networks in the early years
12
2.6 Who are the low service users?
The next stage of the analysis focused on those who were less engaged with formal services. It is in the interest of policymakers and service providers to understand more about the type and characteristics of people who do not use formal services. In doing so, consideration may be given to how those services can be made more accessible to these users and, further, to explore whether this group of parents are, instead, making greater use of informal sources of support and advice.
To explore the characteristics of low service users, the service use scales outlined in Figure 2-A and Figure 2-B were used to classify respondents into two main groups: ‘low service users’ and ‘average/high users’. This classification was achieved by first looking at the mean scores of service use at each age point. All those who had lower than average service use – that is a score on the scale below the mean score – were
classified as ‘low service users’ with those scoring at or above the mean being classified as ‘average/high service users’.
At year 1, the mean service use score was 4.95, thus all those who used 4 or fewer services were termed ‘low service users’. At year 5, the mean service use score was 3.85 meaning that all those who used 3 or fewer services were termed as ‘low service users’. This resulted in 41% of parents at year 1 and 43% of parents at year 5 being classified as ‘low service users’.
2.6.1 Who are the low service users at year 1?
Multivariate analysis was carried out to examine the key demographic and socio-economic characteristics associated with low service use at year 18. A number of
different maternal characteristics were considered: whether or not the child was the mother’s first born, age at the cohort child’s birth, socio-economic classification9,
employment status, household income, education level, family type (lone parent or couple family), area urban-rural classsification and area deprivation level. In addition, whether or not the interview child had a health problem or disability that was expected to last for more than a year was also controlled for (at year 1, this affected 13% of
respondents). This factor was included on the basis that such a longstanding illness may generate a higher level of (particularly health) service use amongst those mothers. Further details on all of these measures are included in Appendix 1.
8 A description of the analysis is included in section 2 of the technical appendix.
What services do parents use in the early years and who uses them?
The analysis indicated that respondents most likely to fall into the low service use group were:
• mothers with lower educational qualifications
• mothers with lower household incomes10.
This suggests that it is mothers in more disadvantaged circumstances, who formal services traditionally find more difficult to reach, who are generally less involved with a full range of services when their child is 10 months old.
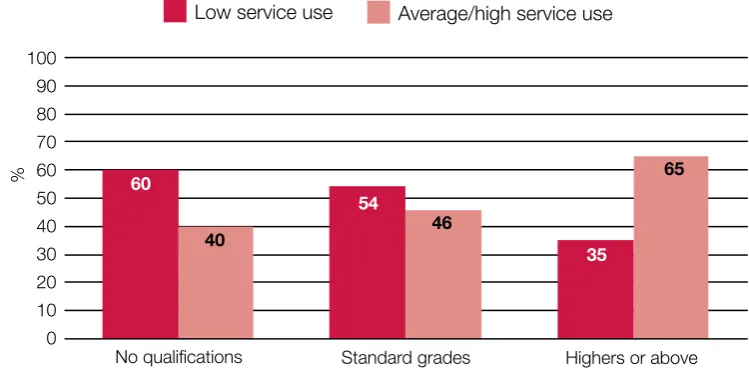
[image:24.595.112.487.448.644.2]Looking in more detail, Figure 2-C illustrates the differences in levels of service use between mothers with different educational qualifications. As the graph shows, 60% of mothers with no qualifications were in the low service use group compared with 35% of mothers who held Higher Grades or above.
Figure 2-C Year 1 service use by highest educational qualification of the child’s mother
Low service use
No qualifications Standard grades Highers or above 100
90
80
70
60
50
40
30
20
10
0
% 60
54
35
Average/high service use
40
46
65
Patterns by level of income were similar, though differences were smaller. Almost half (49%) of mothers in households with the lowest incomes reported lower use of formal services compared with 31% in the highest income households.
Child health problems or disability did not have a statistically significant impact on service use at this stage.
GROWING UP IN SCOTLAND:
Parental service use and informal networks in the early years
14
2.6.2 Who are the low service users at year 5?
Further multivariate analysis was undertaken to establish the key characteristics associated with low service use at year 5. The characteristics considered in relation to year 1 (see section 2.6.1) were also considered for year 5. Again, child long-standing illness or disability was controlled for (at year 5, 18% of respondents reported the child having a long-standing illness or disability). A wider range of variables was significant in this analysis than that related to earlier service use. Respondents who were most likely to fall into low service groups at year 5 were:
• mothers who were in the semi-routine and occupations or who had never worked
• mothers with lower educational qualifications
• mothers for whom the interview child was not the first born in the family
• mothers who worked either part-time or were not working11.
Unexpectedly, those respondents who reported that their child had a long-standing illness or disability were more likely to be low service users than those respondents who reported no long-standing illness/disability. This may be due to the social patterning of such illness – being more prevalent amongst more disadvantaged groups who are less likely to use services – and/or because the service use scale incorporates information on use of a range of services unconnected to child health.
In similarity to the pattern seen in results of the year 1 analysis, as maternal level of education decreases, the likelihood of being a low service user increases. In contrast to the year 1 results however, lower household income was not significantly associated with low service use.
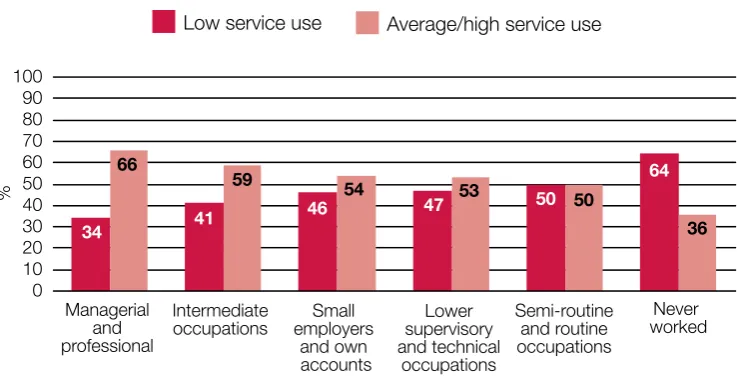
Socio-economic classification was the strongest predictor of low service use at year 5. As Figure 2-D demonstrates, 64% of mothers who had never worked and 50% of those in semi-routine and routine occupations were in the low service use group, compared with 34% of mothers in managerial and professional occupations.
What services do parents use in the early years and who uses them?
Figure 2-D Year 5 service use by mother’s NS-SEC
Low service use
Managerial and professional Intermediate occupations Small employers and own accounts Lower supervisory and technical occupations Semi-routine and routine occupations Never worked 100 90 80 70 60 50 40 30 20 10 0 % 34 41
46 47 50
64
Average/high service use
66
59
54 53
50
36
2.7 Changes in service use between year 1 and year 5
The next stage of the analysis looked at changes in service use between ages 10 months and 4 years. Respondents were categorised into four groups according to their service use category at each time point. These groups captured the extent to which there was any change, or not, between levels of service use over time. The groups were defined as:
• Repeatedly average/high service user
• Moved from low to average/high service use
• Moved from average/high service use to low service use
• Repeatedly low service user
GROWING UP IN SCOTLAND:
Parental service use and informal networks in the early years
[image:27.595.73.498.208.360.2]16
Table 2.3 Changes in service use between years 1 and 5
Service use group % of respondents
Repeatedly average/high 35
Moved from low to average/high 22
Moved from average/high to low 25
Repeatedly low 18
Weighted base 3545
Unweighted base 3755
2.8 Repeated low service use
The next stage of analysis focused attention on the repeated low service users. A further multivariate model was fitted including the characteristics considered in relation to low service use at years 1 and 5 (see section 2.5.1) but this time in order to define those characteristics most associated with repeated low service use. Long-term illness and disability as reported at year 5 was also controlled for.
The analysis showed that respondents who were most likely to be repeated low service users were:
• mothers who were in the semi-routine and routine occupations or who had never worked,
• mothers with lower educational qualifications,
• mothers for whom the interview child was not the first born in the family.
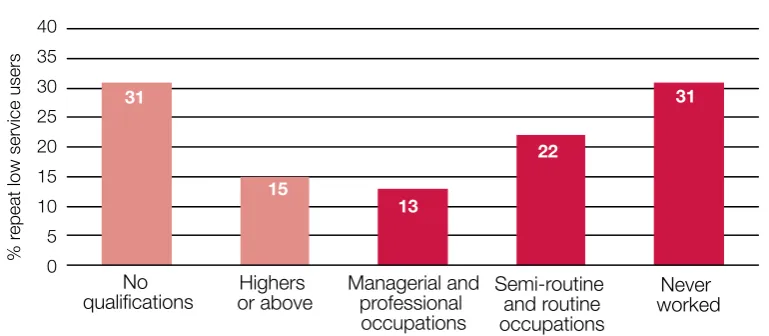
Maternal education was the only characteristic to be statistically significant in all three low service use models; mothers with lower educational qualifications were more likely to be low users at each of years 1 and 5 and to be repeat low users. Figure 2-E shows that nearly one-third (31%) of mothers with no qualifications were repeated low service users, double the proportion amongst mothers with qualifications at Higher Grade or above (15%).
Figure 2-E Repeat low service use by maternal education and NS-SEC
No qualifications
Highers or above
Managerial and professional occupations
% r
epeat low service users
31
Semi-routine and routine occupations
15
13
22
Never worked
31
40
35
30
25
20
15
10
5
0
chapter
WHY ARE SOME MOTHERS DISENGAGED
Why are some mothers disengaged with formal services?
3.1 Introduction
Ante-natal classes are one of the cornerstones of the provision of ante-natal education. Attendance at ante-natal classes has been linked to the propensity to breastfeed (Skafida, 2009), a lower rate of complications during childbirth and a more satisfying experience of childbirth (Spinnelli, 2003). However, as far back as the Black report in 1980, it has been apparent that the women deemed to be most in need of the additional support and information which these classes offer, are those least likely to access them. GUS data, for example, shows that women who live in more disadvantaged
circumstances and who may, therefore, be considered to be in greater need of the support and advice offered by formal services, are those least likely to be using those services (see results reported above in section 2.6).
However, whilst this pattern of service use is clear, less is known about why some women do not use formal services. This section uses GUS data about specific examples of attendance at ante-natal classes and mother and baby groups, as well as non-use of childcare, to examine the reasons why some mothers choose not to engage with these services.
3.2 Key findings
• Reasons for non-attendance at ante-natal classes were distinct for first-time and other mothers, the latter mainly citing previous experience as their main reason. In contrast, the main reasons amongst first-time mothers were that they didn’t like groups, didn’t know where classes were or that simply they didn’t have a reason. Younger mothers were particularly likely to say they didn’t like groups.
• The most common reason given for not attending a mother and baby group was lack of time, largely reflecting the employment patterns of many mothers. However, a small proportion of mothers said that the availability or accessibility of such groups was a problem with others reporting feeling shy or awkward or that they just didn’t want to go.
GROWING UP IN SCOTLAND:
Parental service use and informal networks in the early years
20
3.3 Reasons for non-attendance at ante-natal classes and baby/ toddler groups
3.3.1 Ante-natal classes
[image:31.595.75.457.446.638.2]In year one of the study, mothers who had not attended ante-natal classes (55% of women) were asked to give the reason(s) why they did not attend. Reasons given were distinct for first-time mothers and mothers who already had other children. The majority of women who had children older than the cohort child, said that they did not attend because they ‘had a child already’ or ‘knew it all already’. When reasons are examined for first-time mothers only, three main reasons emerge: not liking groups, not knowing where classes were and simply for ‘no reason’. Differences are seen by maternal age, with the youngest group of mothers being particularly likely to say that they didn’t like groups (Figure 3-A). Very small numbers of women reported not attending due to logistical reasons such as cost, travel, childcare and availablity.
Figure 3-A First-time mothers reasons for not attending ante-natal classes by age at the birth of the cohort child
No reason
% of first-time mothers
21
Don’t like groups
29
Didn’t know where there were classes
9 11 10
14 9 12 7 50 45 40 35 30 25 20 15 10 5 0
Under 25’s 25 to 29 30 to 34 35 or older
10 14
2
Unweighted base – those who did not attend ante-natal classes = 1793
3.3.2 Mother and baby groups
Why are some mothers disengaged with formal services?
isolation and a way of learning childrearing skills (Telleen et al, 1989, Hogg and Worth, 2009).
When their child was 10 months, around 2 in 5 (39%) women regularly attended a
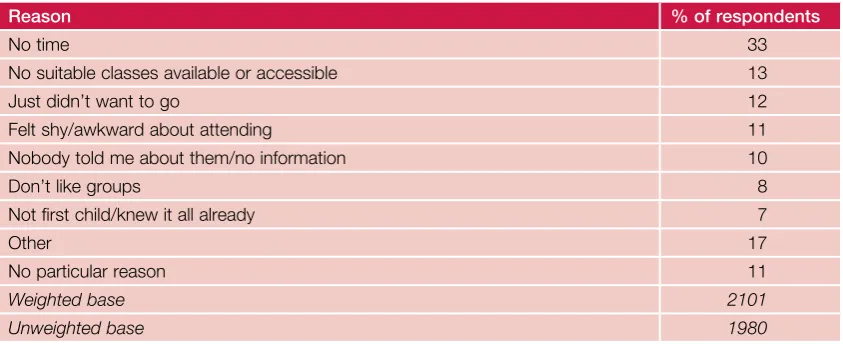
[image:32.595.101.523.429.601.2]mother and baby group, leaving 3 in 5 who did not. Reasons for not going to mother and baby groups at 10 months appeared to mirror, in some respects, the reasons for non-attendance at ante-natal classes. Thirteen per cent reported not going to mother and baby/toddler groups because there were none available or accessible and 10% reported nobody telling them about groups. In addition, 11% felt shy or awkward about attending and 12% just didn’t want to go. The most common reason cited was lack of time (33%), most probably due to the interview taking place at 10 months, when around half (52%) of mothers were working. Indeed, 53% of respondents who were back at work full-time said they did not attend because they had no time, compared with 23% who were not working at the time.
Table 3.1 Reasons for not going to mother and baby groups at 10 months
Reason % of respondents
No time 33
No suitable classes available or accessible 13
Just didn’t want to go 12
Felt shy/awkward about attending 11
Nobody told me about them/no information 10
Don’t like groups 8
Not first child/knew it all already 7
Other 17
No particular reason 11
Weighted base 2101
Unweighted base 1980
Again, mirroring ante-natal class findings, younger mothers were more likely to not attend due to disliking the group format or, what appeared to be more important at this stage, being shy or awkward about attending (1 in 6 giving the latter as a reason). Younger mothers were also less likely to know about groups (12% of those aged under 25
compared with 6% of those over 25), while older mothers were likely to not attend due to this not being their first child.
3.3.3 Toddler groups
GROWING UP IN SCOTLAND:
Parental service use and informal networks in the early years
22
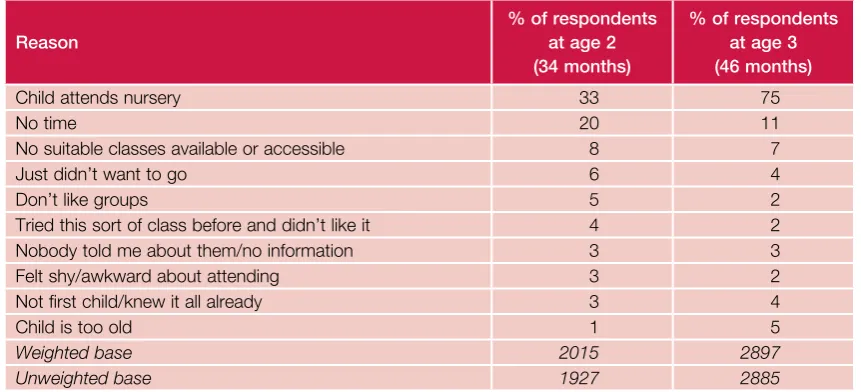
when their child was aged 2, they were not attending because the child was at nursery. By the age of 4, this explains 75% of non-attendance. In addition, 20% of respondents at age 2 and 11% at age 3 said that they had no time to attend a group.
[image:33.595.69.500.413.609.2]Of those who actively decided not to attend when their child was 3, the main reasons given, other than that the child was attending nursery, were that there were no suitable groups available or accessible (7%), that the child was too old (5%), that it wasn’t their first child (4%) or that they simply just didn’t want to go (4%). However, other reasons emerged amongst some mothers including that they had tried this sort of group before and didn’t like it (2%), that they didn’t like groups (2%) and that they felt shy or awkward about attending (2%). In similarity to ante-natal education, there appears to be something about the group format which some mothers find difficult to engage with.
Table 3.2 Reasons for not going to mother and baby/toddler groups at age 2 and 3
Reason
% of respondents at age 2 (34 months)
% of respondents at age 3 (46 months)
Child attends nursery 33 75
No time 20 11
No suitable classes available or accessible 8 7
Just didn’t want to go 6 4
Don’t like groups 5 2
Tried this sort of class before and didn’t like it 4 2
Nobody told me about them/no information 3 3
Felt shy/awkward about attending 3 2
Not first child/knew it all already 3 4
Child is too old 1 5
Weighted base 2015 2897 Unweighted base 1927 2885
3.4 Reasons for using and not using childcare
Data about reasons for using and not using childcare were considered at years 1 and 3, when the children are aged 10 months and 2 years old respectively. Around 1 in 5 parents used a formal childcare provider as their main childcare provider at 10 months. Reasons for using and not using childcare were quite different to those given for ante-natal classes and parent baby/toddler groups. This is, of course, primarily due to the predominant use of childcare to allow parents to work, this reason being given for almost three quarters of respondents using childcare at 10 months.
Why are some mothers disengaged with formal services?
[image:34.595.107.478.254.437.2]10 months, ‘necessity’ wasn’t the only reason given for using childcare, with around 1 in 10 respondents reporting that they use childcare for their child’s educational development or for their social development12 (see Figure 3-B).
Figure 3-B Reasons for using childcare when child aged 10 months
27 25
% of those using childcare To give carer a break
Child likes spending time at provider
For child’s social development
For child’s educational development
Shop/attend appt/socialise
Look after home/other children
Respondent studying
Respondent working
0 10 20 30 40 50 60 70 80 90 100
11 11 30 9 5 73
At year 1 of the study, when the children were just 10 months old, the majority of parents who did not use childcare said they did not do so because they would rather look after the child themselves, because childcare was not required, or because they rarely needed to be away from the child. However, as Figure 3-C shows, 1 in 6 parents not using childcare reported that they could not afford childcare when their child was 10 months old, while 1 in 10 said there was a lack of availability or choice.
Figure 3-C Reasons for not using childcare by year
11
% of those not using childcare Lack of availability/choice
Childcare not required
Child too young
Can’t afford it
No providers I could trust
Rarely need to be away from child
Rather look after them myself
0 10 20 30 40 50 60 70 80 90 100
Year 3 Year 1 2 59 5 5 1 14 12 4 2 48 43 68 69
Note: Birth cohort: Year 1 n = 1344, Year 3 n = 590 (unweighted)
[image:34.595.111.536.581.752.2]GROWING UP IN SCOTLAND:
Parental service use and informal networks in the early years
24
Fourteen per cent of respondents at year 1 said that they could not afford childcare. Affordability was more of an issue for lower income households. Just 6% of parents not using childcare in the highest income group cited this as a reason compared with 19% of those with a household income less than £26,000 and 14% of those with an income of less than £15,000. It is likely that this slightly lower figure for the latter group reflects a lower requirement for formal childcare amongst this group due to the lower employment rate rather than a greater ability to meet the costs of childcare.
4
chapter
ATTITUDES TOWARDS ENGAGING
GROWING UP IN SCOTLAND:
Parental service use and informal networks in the early years
26
4.1 Introduction
At years 1 and 4, respondents were asked the extent to which they agreed or disagreed with a range of statements about help-seeking behaviour and accessing support13:
• “Nobody can teach you how to be a good parent – you just have to learn for yourself.”
• “If you ask for help or advice on parenting from professionals like doctors or social workers, they start interferring or trying to take over.”
• “It’s difficult to ask people for help or advice unless you know them really well.”
• “It’s hard to know who to ask for help or advice about being a parent.”
Agreement with the statements suggests reluctance to engage with formal services. For example, if you agree that when you ask for help or advice from professionals they start interfering and trying to take over, this would suggest you are more likely to feel
uncomfortable seeking help and advice from these formal sources.
4.2 Key findings
• There was at least some reluctance to engage with formal services amongst most respondents; 71% of respondents agreed with at least one statement including 16% who agreed with two statements, 8% who agreed with three and just 2% agreed with all the statements.
• Characteristics associated with reluctant attitudes to service use were similar to those associated with low actual service use. Generally speaking mothers in more disadvantaged circumstances – unemployed, lower incomes, lower educational qualifications – were more likely to have negative attitudes towards service use.
• Importantly, perceived confidence as a parent was also associated with reluctant service use – those mothers who did not consider themselves to be good parents were more likely to be amongst the reluctant service users.
• Overall, agreement with all but the first statement (“Nobody can teach you how to be a good parent…”) increased between years 1 and 4, suggesting that parents become more reluctant to engage with services as their children get older.
• In contrast, agreement with “Nobody can teach you how to be a good parent…” fell, most noticably amongst younger mothers suggesting that although this group were still amongst the least receptive to parenting advice, as their children grew older they were becoming more accepting of the idea of engaging with formal services or at least of accepting parenting advice.
Attitudes towards engaging with formal support
• Looking at changes in individual parental attitudes over time, whilst most parents’ views were identical at both years, many reported more positive, receptive attitudes towards formal support at year 4 than year 1. In particular, 30% of parents indicated greater ease with asking for help.
• However, the attitudes of a reasonable proportion of parents had become more negative over time including 19% who suggested they found it more difficult to know who to ask for help at year 4 than they had at year 1.
4.3 Attitudes towards formal support at 10 months
At 10 months, the highest rates of agreement were with the statement “nobody can teach you how to be a good parent…” with over half of all respondents (62%) agreeing or strongly agreeing (Figure 4-A). Twenty-five per cent agreed that it was “difficult to ask for help or advice unless you knew someone really well”, while 22% agreed with the statement “It’s difficult to know who to ask for help or advice about being a parent”. In addition, just under 1 in 10 parents agreed with the statement “If you ask for help or advice about parenting from people like doctors or social workers, they start interfering and try to take over”.
Overall, 71% of respondents agreed with only one statement, suggesting some
[image:38.595.113.467.579.760.2]reluctance to engage with formal services for the majority of respondents including 16% who agreed with two statements, 8% who agreed with three and just 2% agreed with all four statements.
Figure 4-A Agreement with statements on accessing support for parents at year 1 (child aged 10 months)
Nobody can teach you how to be
a good parent
If you ask for help they start interfering It’s difficult to ask for help 70 60 50 40 30 20 10 0 % agr eeing/str ongly agr eeing 62
It’s difficult to know who to ask for help
9
25
22
GROWING UP IN SCOTLAND:
Parental service use and informal networks in the early years
28
Respondents who agreed with two or more statements were grouped into a ‘reluctant service users’ category (26% of respondents fell into this group). Multivariate analysis was then used to explore the factors associated with being a ‘reluctant service user’.
[image:39.595.72.445.393.555.2]Unemployment and low income were shown to be two key characteristics associated with reluctant service use. Forty-five per cent of respondents in the lowest income quartile at year 1 were reluctant service users, compared with just 16% in the highest income quartile. Education also had an effect; mothers with no qualifications were more than twice as likely as those with Higher Grades or above, to be in the reluctant users group (52% compared with 23%, see Figure 4-B).
Figure 4-B Reluctant service users by educational qualifications of the mother
Reluctant Service Users
No qualifications Standard grades Highers or above 60
50
40
30
20
10
0
%
52
40
23
Note: Birth cohort n = 3595 (unweighted)
Parenting confidence was also independently associated with a reluctant attitude – 49% of respondents who thought they were not very good at being a parent were classed as reluctant service users compared with 28% who thought they were a very good parent. If the least confident parents are the most wary of engaging with formal services, this can create a problematic cycle for providers of services such as parenting classes – part of the aim of which is to build parent’s confidence. If a service cannot get the people they need through the door, then the service cannot perform its job.
Actual service use at 10 months was also independently related to being a reluctant service user. Forty per cent of respondents who had low formal service use at 10 months held attitudes suggesting they were uncomfortable engaging with formal services,
Attitudes towards engaging with formal support
[image:40.595.101.487.241.433.2]parents who are reluctant to engage are less likely to use services, or whether not using and experiencing services affects attitudes towards these services.
Figure 4-C Reluctant service users by actual service use at 10 months
60 50 40 30 20 10 0 % r
eluctant service users
40
Low use Medium use High use
28
18
Note: Birth cohort n = 3595 (unweighted)
4.4 Attitudes towards formal support at age 4
At age 4, again the highest rates of agreement were with the statement “nobody can teach you how to be a good parent”; over half of all respondents (56%) agreed or
strongly agreed. A third (33%) agreed that it was “difficult to ask for help or advice unless you knew someone really well”, while a quarter (25%) agreed with the statement “It’s difficult to know who to ask for help or advice about being a parent”. In addition, 10% of parents agreed with the statement “If you ask for help or advice about parenting from people like doctors or social workers, they start interfering and try to take over”.
Figure 4-D Agreement with statements on accessing support for parents at year 4
Nobody can teach you how to be
a good parent
If you ask for help they start interfering It’s difficult to ask for help 70 60 50 40 30 20 10 0 % agr ee/str ongly agr ee 56
It’s difficult to know who to ask for help
10
33
25
[image:40.595.106.454.617.792.2]GROWING UP IN SCOTLAND:
Parental service use and informal networks in the early years
30
Again, we looked at the total number of attitude statements the respondents agreed with. Results were similar to those at year 1: 71% agreed with at least one statement, including 19% who agreed with two, 11% who agreed with three and 3% who agreed with all four statements. Respondents who agreed with two or more statements at year 4 were grouped into a ‘reluctant service users’ category (33% of respondents).
Multivariate analysis revealed similar associations between key respondent characteristics and being a reluctant service user at year 4 as were found in the year 1 analysis. Having a lower income was related to being a reluctant service user; 48% of those in the lowest income group were reluctant users compared with 21% in the highest income group. Likewise, respondents with no qualifications were more likely to hold attitudes that suggest they are uncomfortable engaging with formal services (54%) than respondents with Standard Grades (42%), or Higher Grades or above (28%).
Lack of confidence as a parent and low service use were again found to be
[image:41.595.80.459.570.729.2]independently associated with being a reluctant service user. The one additional factor which was found to be independently associated with reluctant service use at year 4 but not at year 1, was living in an urban area. As Figure 4-E demonstrates, those in more urban areas, from large urban to small remote towns, were more likely to be reluctant service users than those in more rural areas: 36% of parents living in large urban areas were reluctant service users compared with 20% of those living in remote rural areas.
Figure 4-E Reluctant service users by urban/rural area at year 4
Reluctant Service Users
Large urban Other urban Small, accessible towns Small, remote towns Accessible rural Remote rural 50 45 40 35 30 25 20 15 10 5 0 % 36
34 34 34
27
20
Attitudes towards engaging with formal support
At year 4, two additional statements were put to respondents:
• “Professionals like health visitors and social workers do not offer parents enough advice and support with bringing up their children.”
• “If other people knew you were getting professional advice or support with parenting they would probably think you were a bad parent.”
Overall, 16% of respondents agreed with the first statement and 24% agreed with the second. This latter statement demonstrates the stigma currently associated with getting help with parenting. It will be interesting to monitor this with the new GUS cohort to see if, with the introduction of an increasing number of parenting education schemes and in particular, more universal education for parents, this stigma is reduced.
Again, some parents were more likely to agree with these statements than others. Agreement with professionals not offering parents enough support was associated with lower socio-economic classification – 21% of parents in routine or semi-routine
occupations agreed compared with 13% in managerial or professional occupations. Parents living in more urban areas were also more likely to agree that there is not enough support – 17% of those living in large urban areas and 18% in other urban areas agreed compared with just 8% living in remote rural areas. The final factor independently
associated with agreement with this statement was having low service use at 10 months, although again, it is difficult to establish the direction of causality here.
GROWING UP IN SCOTLAND:
Parental service use and informal networks in the early years
[image:43.595.74.466.250.444.2]32
Figure 4-F Agreement with the statement: “If other people knew you were getting professional advice or support with parenting they would probably think you were a bad parent” by service use at 10 months and current family type.
Low service use High service use Lone parent
30 Couple family 18 32 22 50 45 40 35 30 25 20 15 10 5 0
4.5 Changing attitudes towards formal support
Change in levels of agreement with those statements repeated at both years was considered. The analysis shows that for parents as a whole agreement with all but the first statement (“Nobody can teach you how to be a good parent”) increased between years 1 and 4 (see Figure 4-G), suggesting that parents become more reluctant to engage with services as their children age.
Figure 4-G Agreement with statements on accessing support for parents by year
0 10 20 30 40 50 60 70
22 25 25 33 9 10 62 56 Year 1
% agree/strongly agree
Year 4 It’s difficult to know who to ask for help
It’s difficult to ask for help
If you ask for help they start interfering
Nobody can teach you how to be a good parent
[image:43.595.99.480.596.766.2]Attitudes towards engaging with formal support
[image:44.595.105.488.372.564.2]In contrast, agreement with the “nobody can teach you how to be a good parent” statement fell by around 7 percentage points, suggesting that, as their children grew older, respondents became more receptive to the idea that parenting, or aspects of it, could be ‘taught’. Notably, as shown in Figure 4-H, the difference was greatest among the youngest mothers who saw a fall of 9 percentage points in the proportion agreeing with the statement. Thus, although this group were still those least receptive to parenting advice, this movement could be seen to mean that as their children grew older, younger parents were becoming more comfortable with the idea of engaging with formal services or at least accepting parenting advice.
Figure 4-H Agreement with the statement: “Nobody can teach you how to be a good parent” by year and age
Year 1 Agree/strongly agree
Under 25 25 to 29 30 to 34
71 80
65
35 and older
58
49 55
49 45
Year 4 Agree/strongly agree
100 90 80 70 60 50 40 30 20 10 0 % agr ee/str ongly agr ee
Although changes occurred at the overall level, this does not necessarily mean that change moved in the same direction for all parents. The next, more detailed, stage of the analysis therefore explored change in attitudes at an individual level. Respondents were categorised into three groups for each statement: those who had moved their views towards being more receptive to receiving/seeking help from formal sources, i.e. towards disagreeing with the statements; those who became less receptive, and those who had not changed their views14.
GROWING UP IN SCOTLAND:
Parental service use and informal networks in the early years
34
[image:45.595.76.425.414.656.2]At an individual level, most people (between 53% and 62%) held the same attitudes at 10 months and 46 months, suggesting that for the majority, experience of parenthood doesn’t change their perspective on formal support. Change was more likely to be in a positive than negative direction. The largest change was in relation to the statement “It’s difficult to ask for help unless you know them really well” – 30% of respondents found it less difficult to ask for help from someone they don’t know well by year 4. In addition, around a quarter of respondents also moved away from agreeing with the statements that “If you ask for help…they start interfering” and “It’s difficult to know who to ask for help”, indicating a more receptive attitude to formal support. However, for each statement a small proportion of parents voiced more negative attitudes at year 4 than at year 1. This was most clear in relation to the statement “nobody can teach you how…” where almost one quarter (23%) of parents moved towards a more negative perspective over time.
Figure 4-I Changes in attitudes over the first four years
No change
Nobody can teach you how to be
a good parent
If you ask for help they start interfering It’s difficult to ask for help 100 90 80 70 60 50 40 30 20 10 0 % 16 More receptive 23 Less receptive
It’s difficult to know who to ask for help
62 23 15 62 30 17 53 26 19 56
Factors that were related to a change in opinions were explored in the analysis. The findings showed that being in a managerial or professional household was related to increasing agreement that parenting can be taught.