DISSERTATION ON
SCREENING CHILDREN OF TYPE 2
DIABETES MELLITUS PARENTS
Dissertation submitted to
THE TAMIL NADU DR. M.G.R. MEDICAL UNIVERSITY CHENNAI
In partial fulfillment of regulations for award of the degree of
M.D.PAEDIATICS BRANCH- VII DEPARTMENT OF PAEDIATRICS,
GOVERNMENT KILPAUK MEDICAL COLLEGE, CHENNAI - 10
THE TAMIL NADU DR. M.G.R. MEDICAL UNIVERSITY CHENNAI, TAMILNADU
BONAFIDE CERTIFICATE
This is to certify that this dissertation entitled “SCREENING
CHILDREN OF TYPE 2 DIABETES MELLITUS PARENTS” is the
original and bonafide work done by Dr.A.C.RAJARAJAN under
the guidance of Prof.Dr.K.SUGUNA, M.D., DCH., Professor and
Head, Department of Pediatrics , Govt Kilpauk Medical College &
Hospital & Govt Royapettah Hospital, Chennai – 600 014, during
the tenure of his course in M.D. Pediatrics from 2015 to
May-2018 held under the regulation of the Tamilnadu Dr. M.G.R
Medical University, Guindy, Chennai – 600 032.
Prof.Dr.P.VASANTHAMANI,
M. D., D.G.O., MNAMS., DCPSY., MBA
DEAN,
Govt. Kilpauk Medical College& Hospital, Chennai-600 010
Prof.Dr.K.SUGUNA, M.D,DCH.,
Professor and Head, Department of Pediatrics, Govt.Kilpauk Medical College, Govt.Royapettah Hospital, Chennai- 600 014.
CERTIFICATE BY THE GUIDE
This is to certify that this dissertation titled “SCREENING
CHILDREN OF TYPE 2 DIABETES MELLITUS PARENTS” is the
original and bonafide work done by Dr.A.C.RAJARAJAN under
my guidance and supervision at the Govt Royapettah Hospital &
Govt Kilpauk Medical College & Hospital, Chennai – 600 010,
during the tenure of his course in M.D. Pediatrics from May-2015
to May-2018 held under the regulation of the Tamilnadu Dr.M.G.R.
Medical University, Guindy , Chennai – 600 032.
Prof.Dr.K.SUGUNA, M.D,DCH.,
Professor and Head, Department of Pediatrics,
DECLARATION BY THE CANDIDATE
I solemnly declare that this dissertation titled “SCREENING
CHILDREN OF TYPE 2 DIABETES MELLITUS PARENTS” is the
original and bonafide work done by me at the Govt Royapettah
Hospital & Govt Kilpauk Medical College & Hospital, Chennai –
600 014.
This is submitted to the Tamilnadu Dr.M.G.R.Medical
University, Chennai in partial fulfilment of the rules and
regulations for the award of M.D.Degree in PAEDIATRICS,
BRANCH 7.
Signature by the candidate
(Dr.A.C.RAJARAJAN)
Place : Chennai
CERTIFICATE - II
This is to certify that this dissertation work titled
“SCREENING CHILDREN OF TYPE 2 DIABETES MELLITUS
PARENTS” of the candidate Dr.A.C.RAJARAJAN, Post graduate in PAEDIATRICS with registration Number 201517153 for the
award of M.D.PAEDIATRICS in the Branch VII. I personally
verified the urkund.com website for the purpose of plagiarism
check. I found that the uploaded thesis file contains from
introduction to conclusion pages and result shows
2%
percentageof plagiarism in the dissertation.
ACKNOWLEDGEMENT
It gives me immense pleasure to express my sincere thanks and deep gratitude to my beloved Dean, Prof.Dr.P.VASANTHAMANI, M.D., D.G.O., MNAMS., DCPSY., MBA, for permitting me to utilise the infrastructure and resources needed to conduct this study in Government Kilpauk Medical College & Government Royapettah Hospital.
I express my sincere gratitude to Prof.Dr.HEMACHANDRIKA M.D., Vice Principal for the timely help and support to conduct this study.
I take this opportunity to express my heartfelt gratitude and appreciation for my guide Prof. Dr.K.SUGUNA, M.D.,DCH., Professor and Head, Department of Pediatrics, Govt Kilpauk Medical College & Hospital & Govt Royapettah Hospital ,Chennai for her keen interest, constant encouragement, guidance and valuable suggestions throughout this study. Her constant motivation and drive were the key factors for the construction of this study. I am extremely grateful to her.
I sincerely thank to my Professors Prof.Dr.K.Devimeenakshi, M.D. DCH., Prof.Dr.Subramaniyam, M.D., DCH, and
Prof.Dr.V.Vivekanandhan, M.D.DCH for their support.
I sincerely thank Prof.Dr.Gopinanthan M.D. Radiology, Head of Department, Department of Radiology, Government Royapettah Hospital for his support and allowing me to conduct the study in his department.
I am extremely grateful to my Assistant Professor Dr.Nandhini Balaji D.C.H.,DNB, MNAMS., for guiding and encouraging me during this study.
I would like to thank all my Assistant Professors Dr K.V.Sivakumar M.D, DNB., Dr.C.Chandrasekaran M.D., Dr.A.S.Noor Hussair, D.C.H., Dr.Shree Nandhini, M.D. and Dr.Preethi M.D. for their valuable guidance and support for this study.
I would like to express my special thanks to my formerly Assistant Professor Dr.K.M.Senthilkumar, D.C.H. DNB., MNAMS for guiding and encouraging me during the study.
I would like to thank my friends and fellow post graduates of Department of Paediatrics, Government Royapettah Hospital, who were an immense help in collecting the samples.
I would like to thank all the children and their parents who participated in this study.
CONTENTS
S.NO TITLE PAGE NO.
1. INTRODUCTION 1
2. REVIEW OF LITERATURE 32
3. STUDY JUSTIFICATION 43
4. AIMS AND OBJECTIVES 44
5. SUBJECTS AND METHODS 45
6. OBSERVATION AND ANALYSIS 56
7. DISCUSSION 75
8. CONCLUSION 84
9. LIMITATIONS 85
10. RECOMMENDATIONS 86
11. BIBLIOGRAPHY
INTRODUCTION
Diabetes mellitus is a common chronic metabolic syndrome characterised by hyperglycemia as a cardinal biochemical feature. It is group of disorders having varying etiology and pathogenesis
leading to the impairment of glucose tolerance characterised by
hyperglycemia, glycosuria and polyuria.
Diabetes mellitus is the most common non communicable
disease which shortens lifespan by 15 years and it is a leading
cause of blindness and end stage renal disease. The factors that
contribute to hyperglycemia include decreased insulin secretion,
decreased insulin action and gluconeogenesis.
Diabetes mellitus can be treated and complications can be
avoided or delayed by dietary management, lifestyle management,
medication and regular screening and treatment for complications.
INCIDENCE OF DIABETES MELLITUS :( 1)
Incidence is increasing alarmingly affecting 3% of world
population. Globally, an estimated 422 million adults were living
with diabetes in 2014, compared to 108 million in 1980. The global
1980, rising from 4.7% to 8.5% in the adult population. This
reflects an increase in associated risk factors such as being
overweight or obese.
In 2014, 8.5% of adults aged 18 years and older had diabetes.
In 2015, diabetes was the direct cause of 1.6 million deaths and in
2012 high blood glucose was the cause of another 2.2 million
deaths. WHO projects that diabetes will be the seventh leading
cause of death in 2030. Healthy diet, regular physical activity,
maintaining a normal body weight and avoiding tobacco use are
ways to prevent or delay the onset of type 2diabetes.
INCIDENCE OF DIABETES MELLITUS IN CHILDREN (2)
The most common cause of diabetes in children is due to an absolute deficiency of insulin secretion because of destruction of the beta cells of the pancreatic islets. Diabetes in children and
adolescence affects growth and puberty.
In 2001, 4958 of 3.3 million youth were diagnosed with type
1 diabetes for a prevalence of 1.48 per 1000. In 2009, 6666 of 3.4
million youth were diagnosed with type 1 diabetes for a prevalence
In 2001, 588 of 1.7 million youth were diagnosed with type 2
diabetes for a prevalence of 0.34 per 1000. In 2009, 819 of 1.8
million were diagnosed with type 2 diabetes for a prevalence of
0.46 per 1000.
CLASSIFICATION OF DIABETES MELLITUS
DM classification based on American Diabetes association(3)
1. Type 1 diabetes ( -cell destruction causing insulin
deficiency)
2. Type 2 diabetes (defect in insulin secretion on the
background of insulin resistance)
3. Gestational diabetes mellitus (diabetes diagnosed in
pregnancy)
4. Specific types of diabetes due to other causes
Monogenic diabetes syndromes( maturity-onset diabetes of
the young [MODY])
Diseases of the exocrine pancreas : Chronic pancreatitis,
Pancreatectomy, Neoplasia, Cystic fibrosis,
Drug induced diabetes (Glucocorticoids, Thyroid hormone,
-Adrenergic agonists)
Infections (Cytomegalovirus, Coxsackievirus B, Congenital
rubella)
Genetic Syndromes Associated with Diabetes (Down
syndrome, Klinefelter syndrome, Turner syndrome).
TYPE 2 DIABETES IN CHILDREN AND ADOLESCENTS
Type 2 diabetes mellitus is emerging as a new clinical
problem within pediatric practice. Recent reports indicate an
increasing prevalence of type 2 diabetes mellitus in children and
adolescents around the world in all ethnicities.
Reinehr T et al study (4) described, type 2 diabetes mellitus
has been thought to be a rare occurrence in children and
adolescents 30 years ago. However, in the mid-1990s, investigators
began to observe an increasing incidence of type 2 diabetes mellitus
worldwide. This observation followed a striking increase in both
the prevalence and the degree of obesity in children and
Type 2 Diabetes Mellitus was considered a rarity in
adolescence until recently. However, in recent decades, many
authors have been reporting an increase in the incidence of diabetes
in adolescents with similar characteristics to those of DM 2 in
adults. The increase in the incidence of T2DM in young people was
observed among those between 15 and 24 years old. The increase in
the prevalence of obesity in adolescence explains the increase of
DM2 in young populations.
T2DM IN INDIAN CHILDREN AND ADOLESCENTS
The prevalence of T2DM in children in India is increasing and during the last ten years it was shown by the following studies.
Study conducted by Ramachandran, et al (5) reported T2DM in 18 children (13 girls and 5 boys) out of 257 aged less than 15 years. Nine of them were obese and without any symptoms and was
detected on screening which was done due to strong family history of DM and/or due to obesity.
Bhatia, et al (6) conducted study in which of 160 children,
Hence in India we need Screening for T2DM in children
seems meaningful especially in high risk groups such as children
and adolescents with obesity, parents with type 2 diabetes mellitus,
and clinical features of insulin resistance (Hypertension,
Dyslipidemia, PCOS and Acanthosis nigricans).
PATHOPHYSIOLOGY OF TYPE 2 DIABETES MELLITUS IN
CHILDREN AND ADOLESCENTS (4)
Type 2 diabetes mellitus is a disorder with heterogeneous
etiology such as social, behavioral, and environmental risk factors.
These factors unmask the effects of genetic susceptibility which
plays a major role in Type 2 DM.
Glucose homeostasis
It depends on the balance between insulin secretion and
insulin action. The insulin resistance to glucose uptake is a
characteristic finding in patients with type 2 diabetes mellitus. The
evolution from normal to impaired glucose tolerance (IGT) is
associated with a worsening of insulin resistance.
Impaired glucose tolerance is an intermediate stage in the
risk of developing diabetes mellitus. Insulin resistance alone is not
sufficient for development of diabetes but also inadequate insulin
secretion. It has been proposed that hyperglycaemia may worsen
both insulin resistance and insulin secretory function and thus
enhancing the transition from impaired glucose tolerance to
diabetes mellitus.
INSULIN RESISTANCE
Resistance to the action of insulin in the liver leads to an
increase of hepatic glucose production. During the initial phase, the
increase in glycemia levels is compensated by an increase in insulin
secretion, but as the process persists for prolonged periods a
glucotoxic effect will come. A glucotoxic effect is defined as an
increased resistance to the effects of insulin and a decrease in beta
cell function due to chronic hyperglycemia.
Disorders associated with insulin resistance and obesity: (7)
1. Acanthosis nigricans
2. Polycystic Ovarian Syndrome
1. Acanthosis nigricans:
Acanthosis nigricans is a cutaneous finding characterized by
intertrigenous area and is present in up to 90% of children with
T2DM. It is recognized more frequently in darker-skinned obese
individuals.
Histology of Acanthosis nigricans
It is characterized by papillomatosis and hyperkeratosis which is a
darkening due to the thickening of the superficial epithelium which
contains keratin. There is hyperplasia of all elements of the dermis and
epidermis which suggests stimulation by a local growth factor. Increased
IGF-1 and epidermal growth factor (EGF) are implicated in this
process.(8)
Polycystic Ovarian Syndrome (PCOS) (9)
PCOS is a reproductive disorder characterized by
hyperandrogenism and chronic anovulation. PCOS is a disorder of
hormone function affecting 5-8% of women of reproductive age . It
is characterized by the triad of oligoovulation or anovulation,
clinical or biochemical hyperandrogenism, and ovaries with a
polycystic morphology on ultrasound examination ( 12 follicles in
1 ovary and/or ovarian volume >10 ml/mm3). Abnormalities
commonly associated with PCOS include obesity, insulin
resistance, and the metabolic syndrome. Insulin resistance is greater
and more prevalent among women with PCOS. PCOS is associated
with an increased prevalence of insulin resistance and type 2
diabetes in adolescent girls.
RISK FACTORS FOR T2DM
1.Ethinicity
2.Family History
3.Puberty
4.Obesity
5.Low birth weight
6.History of GDM in mother
1. Ethnicity
According to survey conducted by Health Survey for
England (HSE) (10), the risk group for T2DM are Indo-Asians.
Indo-Asians who have migrated to western societies as well as
those living in urban areas of the Indian subcontinent have higher
prevalence of T2DM.
Yajnik CS, Lubree HG, Rege SS et al study (11) described,
Indian babies are usually lighter at birth but their fat mass is
preserved and have tendency to truncal or central adiposity even
during intrauterine development. They also have Higher umbilical
cord insulin concentrations have been demonstrated, suggesting that
an insulin-resistant phenotype is present at birth in Indian babies.
abnormalities in systolic blood pressure, fasting plasma insulin,
subscapular/triceps skinfold ratios and total LDL cholesterol
concentrations and are at risk for diabetes.
2. Family history
Haines L, Wan KC, Lynn R, Barrett TG, Shield JPH et al
study (12) shows the great majority of children with T2DM have a
strong family history of T2DM. 74–100% had a first- or second
degree relative with T2DM.
Diabetes in the parent or other relative may not be recognized
until the child is diagnosed. The high frequency of relatives with
T2DM demonstrate the strong hereditary (likely multigenic)
component to the disease.
Families will also share the same dietary habits as well as
approaches to physical activity. UK data suggest that 84% of
children diagnosed with T2DM have a family history. Family
history is also important among children with obesity. 85%, of
3. Puberty
Arslanian SA et al study (13) described a major role of
puberty in the development of type 2 diabetes mellitus in children.
During puberty, there is increased resistance to the action of
insulin, resulting in hyperinsulinemia. After puberty, basal and
stimulated insulin responses decline and there is normalization
from IGT to normal glucose tolerance in children and adolescents
with impaired glucose tolerance. This normalization has been
attributed to changes of insulin resistance at end of puberty.
Increased growth hormone secretion in puberty is also
responsible for the insulin resistance. Growth hormone acts as a
lipase stimulant, provoking an increase in free fatty acid
oxidization, which results in a reduced sensitivity to the action of
insulin.
Hence, it is not surprising that the peak and average age at
presentation of type 2 diabetes mellitus in children coincides with
4. Obesity
Obesity is defined as excess adipose tissue in the body. It is
the hallmark of type 2 diabetes mellitus. Most of the children with
T2DM up to 85% are obese or overweight at diagnosis. Adipose
tissue expanding in the obese state synthesizes and secretes
metabolites & signalling proteins like leptin, adiponectin, and
tumor necrosis factor-alpha which alters the insulin secretion and
sensitivity and cause insulin resistance.
In a study conducted by Weiss R, Dziura J et al (14) the
effect of obesity on glucose metabolism is evident early in
childhood and obese children are hyperinsulinemic and have
approximately 40% lower insulin stimulated glucose metabolism
compared with non obese children.
In a study conducted by Taksali SE, Caprio S et al (15) there
is a inverse relationship between insulin sensitivity and abdominal
fat is stronger for visceral than for subcutaneous fat.
Haines L, Wan KC, Lynn R et al (12) did study in Argentina.
They studied 400 obese children who showed a prevalence rate of
Definition of overweight and obesity:
According to WHO, (16)
Overweight is defined as > +1 Standard deviation (equivalent
to BMI 25 kg/square meters at 19 years). Obesity is defined as >+2 Standard deviation (equivalent to BMI 30kg/square meters).
The most commonly used and preferred indicator for obesity is the body mass index (BMI). BMI has become the standard
practical measure of adiposity.
BMI =WEIGHT (Kg) / HEIGHT (m2)
5. Low Birth weight
Low birth weight is one of the risk factor for T2DM. The
following studies has clearly demonstrated the fact that low birth
weight babies born for mothers with high maternal BMI has higher
risk in future for developing T2DM.
Monica Gabbay, Paulo R. Cesarini et al(8) study noted that
adults who were born with low birth weights with inadequate
intrauterine nutrition had a sevenfold risk of developing insulin
resistance, glucose intolerance and T2DM.
Erikkson et al (17) did a study on Effects of size at birth and
childhood growth on the insulin resistance syndrome in elderly
individuals.They studied 7086 men and women born in Helsinki,
Finland and they found that the development of Type II diabetes
mellitus is associated with low birth weight followed by accelerated
gain in height and weight during childhood and with high maternal
BMI. They concluded that the Insulin resistance and Type II
diabetes share common associations with retarded fetal growth and
6. History of gestational diabetes in mother
ADA (3) defines Gestational diabetes as any degree of glucose
intolerance with onset or first recognition during pregnancy. The
definition applies regardless of whether insulin or only diet
modification is used for treatment or whether the condition persists
after pregnancy.
Anna V, van der Ploeg HP, Cheung NW et al (18) study
noted GDM mothers with a history of stillbirth or giving birth to an
infant with congenital abnormality and excess glucose in urine
during pregnancy has increased risk of obesity and type 2 diabetes
in offspring.
Monica Gabbay, Paulo R. Cesarini et al(8) study described
the increased risk of T2DM among the children of GDM women.
An abnormal intrauterine environment is the key factor which is
responsible for the development of diabetes. Factors which
increases the insulin secretion is associated with the intrauterine
environment. Those factors have a direct effect on the fetus,
increasing insulin secretion leading to the development of insulin
CRITERIA FOR SCREENING FOR T2DM IN CHILDREN
AND ADOLESCENTS
Screening for diabetes is needed for at-risk asymptomatic children to prevent Type 2 diabetes related morbidity and mortality.
Screening should commence at the age of 10 years at onset of
puberty and should be repeated every 2 years.
ADA (3) suggests that children who are overweight (BMI,
85th percentile for age and sex) and who have any two of the
following risk factors should be tested for T2DM:
1. Family history of T2DM in first- or second-degree relative
2. Race/ethnicity (American Indian, African American,
Hispanic, Asian/Pacific Islander)
3. Signs of insulin resistance or conditions associated with
insulin resistance (acanthosis nigricans, hypertension,
dyslipidaemia, polycystic ovarian syndrome)
Recommended test by ADA is fasting plasma glucose. Hba1c
HbA1c - SCREENING TEST FOR TYPE 2 DM:
HbA1c can be used as alternative test for screening T2DM.
The following studies described the use of HbA1c test in screening
diabetes.
Chirag Kapadia, Philip Zeitler et al (19) conducted study in diabetic
patients and found HbA1c and FPG tests as equally effective screening
tools for the detection of Type 2 diabetes.
C. M. Bennett, M. Guo et al (20) study clearly described the
glycated haemoglobin (HbA1c) test as a screening tool for early
detection of Type 2 diabetes. They also noted HbA1c and FPG are
equally effective screening tools for the detection of Type 2
diabetes.HbA1c has higher specificity than fasting plasma glucose
(FPG) in detecting Diabetes. Hence HbA1c can be suggested as an
alternative screening test for Type 2 diabetes.
Pavithra Vijayakumar, Robert G. Nelson et al (21) study
described HbA1c as a useful predictor of diabetes risk in children
and can be used to identify prediabetes in children with type 2
diabetes risk factors with the same predictive value as FPG and
CUT OFF POINT FOR HbA1c:
In most of the diabetic studies(19,20,21) so far reviewed
recommends the HbA1c cut-off point of > 5.7 to 6.1% for detection
of Prediabetes and > 6.1% for the detection of Diabetes.
ADVANTAGES OF HbA1c TEST:
1. Compared with the OGTT, HbA1c measurement is quicker
and more convenient.
2. HbA1c can be measured at any time of the day regardless of
the duration of fasting or the content of the previous meal.
3. HbA1c levels represent a 2–3-month average of blood
glucose concentrations.
4. HbA1c, OGTT and FPG are equivalent as predictors of the
development of retinopathy and nephropathy
LIMITATIONS OF HbA1c TEST:
The accuracy of HbA1c is influenced by the presence of
haemoglobinopathy or renal failure, as well as laboratory error
CRITERIA FOR DIAGNOSIS OF PRE DIABETES IN
CHILDREN AND ADOLESCENTS
According to ADA (3), Prediabetes is defined as
Impaired fasting glucose (IFG)
(Glucose level 100 mg/dl but <125 mg/dl)
or
Impaired glucose tolerance (IGT)
(2-hour postprandial 140-199 mg/dl)
or
Glycated Hemoglobin level HbA1c >5.7 but < 6.1%
Prediabetes represents the earliest stages of impaired glucose
metabolism. Many studies have reported a high prevalence of
prediabetes in obese children and adolescents. Screening for
prediabetes should be considered for these high-risk children to
understand the early pathophysiologic changes underlying this
metabolic dysfunction and to halt the progression of prediabetes to
CRITERIA FOR DIAGNOSIS OF DIABETES IN CHILDREN
AND ADOLESCENT
American Diabetes Association (ADA) Criteria for DM (3):
1) Symptoms of diabetes (polyuria, polydipsia, and unexplained
weight loss) plus random glucose level >200 mg/dl (11.1
mmol/l) in venous plasma or capillary whole-blood samples
or
2) Fasting glucose level >126 mg/dl (7.0 mmol/l) in venous
plasma or capillary whole-blood samples
or
3) 2 hour glucose level during oral glucose tolerance test
(OGTT) >200 mg/dl (11.1 mmol/l) in venous plasma or
capillary whole-blood sample.
or
4) HbA1c > 6.1%. The test should be performed in a laboratory
using a method that is NGSP certified and standardized to the
CLINICAL PRESENTATION OF T2DM IN CHILDREN AND
ADOLESCENTS (22)
Clinicians should be aware of the clinical presentation of
T2DM in children and adolescents. It includes the following
Age: 11yrs–17yrs
Gender: Female > male
Family history of T2DM
Overweight / Obesity
Acanthosis nigricans
Polycystic ovarian syndrome (PCOS)
Symptoms:
1. Mild form T2DM – Asymptomatic (or) mild polyuria and
polydipsia.
COMPLICATIONS OF DIABETES (23)
If diabetes is not treated properly at appropriate time,
complications will develop which endanger life and health. The
complications of diabetes are as follows,
1. Acute complications
2. Hypoglycemia
3. Multiorgan damage
Acute complications
Acute complications are due to the abnormally high blood
glucose level and can have a life-threatening impact. Acute
complications are diabetic ketoacidosis (DKA) in type 1 and 2 and
hyperosmolar coma in type 2.
Hypoglycemia
Hypoglycemia is one of the complication of diabetes due to
abnormally low blood glucose that can also lead to seizures or loss
of consciousness. It is mainly due to skipping the meal or excessive
exercising more than usual, or due to the intake of anti-diabetic
Multiorgan damage
Over time diabetes can damage multiple organs which include
the heart, blood vessels, eyes, kidneys and nerves. It is the leading
cause of blindness and kidney disease. Diabetes patients are at
increased risk of developing the following diseases,
Cardiovascular disease
Stroke
Diabetic Neuropathy in the feet which increases the chance of foot ulcers, infection and the eventual need for limb amputation.
Diabetic retinopathy is an important cause of blindness and occurs due to the long-term accumulated damage to the small blood vessels in the retina.
Diabetic Nephropathy - Renal failure.
Management of T2DM in Children and Adolescents (4)
Goal of Management of T2DM in Children And Adolescents
The ideal goal of treatment is normalization of blood glucose
values and HbA1c. Successful control of the associated co
morbidities is also important. The ultimate goal of treatment is to
with diabetes mellitus. There are three main steps in the
management of T2DM.
1. Weight management
2. Pharmacological Management of T2DM 3. Management of complications of T2DM
1. Weight Management in Children and Adolescents
Weight control is the initial management of obese children
and adolescents with T2DM consists of lifestyle and behaviour
modifications like decreasing high-caloric high-fat food choice
while increasing the physical activity. Referral to a dietician for
nutritional management of children with diabetes mellitus is
necessary. Encouraging healthy eating habits by the entire family is
important.
2. Pharmacological management of T2DM in Children and Adolescents
Indication for Pharmacological treatment:
Pharmacological therapy is indicated if treatment goal
Drug of choice:
Many drugs are available for treatment of type 2 diabetes but
only metformin and insulin are drug of choice for use for under
18-year-old.
Oral anti diabetic drug:
Most of the doctors use oral agents for children with type 2
diabetes mellitus. Advantages of oral agents include potentially
greater compliance and convenience for the patient. The oral anti
diabetic drug of choice is Metformin.
Insulin treatment:
If monotherapy with metformin for a period of 3-6 months is
not successful Insulin treatment should be started.
Metformin treatment in T2DM in children and adolescents:
Metformin, a biguanide, is the most appropriate drug for
pharmacological treatment in children with type 2 diabetes
Action of Metformin:
Metformin decreases hepatic glucose output and enhances
primarily hepatic and also muscle insulin sensitivity without a
direct effect on -cell function.
Dose of metformin: up to 2 g in split doses Advantages of metformin:
Metformin has the advantage of weight reduction, decrease in
lipids without the risk of hypoglycaemia.
Side effect of metformin:
The most common side effects of metformin are
gastrointestinal disturbances. The other side effect is lactic
acidosis. Hence metformin is contraindicated in patients with
impaired renal function
Insulin treatment:
If monotherapy with metformin for a period of 3-6 months is
not successful insulin treatment should be started. There is no
be adjusted according to the level of blood glucose (bedtime insulin
alone, twice-a-day insulin or multidose insulin regimes).
3. Management of complications T2DM in children and
adolescents
1. Dilated eye examinations should be performed to detect
retinopathy.
2. Screening for microalbuminuria should be performed yearly
to detect nephropathy. Angiotensin converting enzyme (ACE)
inhibitors are the agents of choice in children with
microalbuminuria.
3. Control of hypertension in diabetes mellitus is necessary. If
normotension is not achieved by ACE inhibitors, combination
therapy with a-blockers, calcium antagonists or low-dose
diuretics may be needed.
4. Testing for and treating lipid abnormalities are necessary to
PREVENTION OF T2DM IN CHILDREN AND
ADOLESCENTS (24)
Prevention of type 2 diabetes mellitus means prevention of
obesity in childhood. Prevention should start very early in life,
perhaps even before birth.
To prevent the development of type 2 diabetes mellitus and
its life-shortening complications early detection of impaired
glucose regulation may represent an appropriate strategy to prevent
type 2 diabetes mellitus, as subjects with impaired glucose
tolerance are at increased risk of developing this disease.
Adoption of a healthy lifestyle characterized by healthy
eating, regular physical activity and subsequent modest weight loss
can prevent the progression of impaired glucose tolerance to
clinical diabetes mellitus.
Prevention of diabetes can be done at two levels.
1. Primary Prevention 2. Secondary Prevention
Prevention of Childhood obesity and T2DM:
Population and community approach for prevention of obesity
adolescence seems to be the most promising and reasonable
treatment strategy available at present. Family based, behavioural
treatment for obesity is also effective in preventing type 2 diabetes
mellitus and is also extremely cost-effective. Good nutrition and
modest exercise for pregnant women as well as monitoring of
intrauterine growth of the foetus are mandatory. After birth, rapid
weight gain should be avoided and the principles of good nutrition
and physical activity be taught at all ages. Breast-feeding should be
strongly recommended. Children’s food choice can be influenced
by early intervention and guidance. In fact, teacher training,
modification of school meals and physical education are effective
in reducing risk factors for obesity.
Primary prevention:
The main modes in primary prevention is lifestyle
modification which includes
A) Measures to prevent obesity by encouraging Physical activity, exercise and healthy food habits.
Secondary prevention:
The main step in secondary prevention is to delay or prevent the development of complications of diabetes. Following measures can be taken
1. Early screening and diagnosis of DM 2. Good control of blood sugar.
3. Good Control of blood pressure.
4. Early screening for long term morbidities and mortalities. 5. Medical education for diabetes.
REVIEW OF LITERATURE
The purpose of our study is to screen the Obese children with
positive family history of diabetes and those children with signs of
insulin resistance or conditions associated with insulin resistance
(acanthosis nigricans, hypertension, dyslipidemia, polycystic
ovarian syndrome) should be screened for T2DM using HbA1c test
as screening tool. ADA (3) recommends using HbA1c test as one of
the screening test. General screening for type 2 diabetes mellitus in
youth is unlikely to be cost effective. Therefore a targeted
screening seems to be necessary.
Mazza CS, Ozuna B, Krochik AG et al (25) did a study in
Germany. They included 500 obese children and adolescents who
showed a prevalence rate of 1.5% for T2DM and 2.1% for IGT.
Excess body fat is the strongest risk factor for type 2 diabetes.
Overweight and obesity, together with physical inactivity, are
estimated to cause a large proportion of the global diabetes burden.
From the above study it is clear that obesity is the main factor in
developing T2DM in children and adolescents. Hence in ours study
NEED OF SCREENIG FOR T2DM IN CHILDREN:
The following studies highlighted the importance of early
screening for T2DM,
Hillier TA , Pedula KL et al(23) study clearly described type
2 diabetes mellitus developing at a younger age is associated with a
much higher risk of long-term cardiovascular disease than those
who develop type 2 diabetes mellitus in middle age group. Hence
early targeted screening for T2DM is needed in high risk children.
Eppens MC, Craig ME et al (26) study mentioned the
important fact that Screening of young people with type 2 diabetes
mellitus is necessary since they are at a much higher risk of
developing early diabetes mellitus associated complications than
those with type 1 diabetes mellitus. They also noted this higher
level of risk is related to occurrence of hypertension and
dyslipidemia associated with childhood obesity. Hence early
screening of obese children for T2DM is needed and also measures
to take modification of life style to prevent childhood obesity must
Copeland KC, Zeitler P et al (27)study described
cardiovascular risk factors are more frequent in adolescents
suffering from type 2 diabetes mellitus compared to type 1 diabetes
mellitus. Hence to reduce the T2DM related complication we need
early screening for at risk children and adolescents.
The DECODE study group (28) described the Development of
type 2 diabetes mellitus and its life-shortening sequelae can be
prevented by early detection of impaired glucose regulation.
Children with impaired glucose tolerance are at increased risk of
developing diabetes in future. Hence early screening represents an
appropriate strategy to prevent type 2 diabetes mellitus.
Helena W. Rodbard et al study(29) discussed the dramatic rise in
the incidence and prevalence of type 2 diabetes mellitus in the paediatric
and adolescent populations and its association with the ongoing epidemic
of overweight, obesity, insulin resistance, and metabolic syndrome seen
in these age groups. 50% of patients with diabetes in the paediatric age <
18 years have type 2diabetes. Hence screening of high-risk children for
diabetes and prediabetes is important for early intervention in terms of
lifestyle changes, hopefully leading to avoidance or delay of the
HbA1c TEST AS SCREENING TEST FOR DIAGNOSIS OF
DIABETES
The following studies support the use of HbA1c test as
screening test for diagnosis of diabetes.
In a study conducted by Tapp RJ, Tikellis G, et al (30)found a stronger correlation between HbA1c and retinopathy than between
fasting glucose levels and retinopathy.
Stratton IM, Adler AI, Neil HA et al(31) conducted a controlled clinical trial study in type 2 diabetes and found the
strong correlation between HbA1c levels and macro vascular and
micro vascular complications of type 2 diabetes.
Weykamp C, John WG, Mosca A et al (32) did a 6year study on The IFCC reference measurement system for HbA1c and
reported that preanalytic errors owing to sample handling is more in
FPG measurement than HbA1c assay. HbA1c values are relatively
stable after collection, and the recent introduction of a new
reference method to calibrate all HBA1c assay instruments has
Miller WG, Myers GL, Ashwood ER et al study (33) analysed the performance of a variety of clinical laboratory instruments and
methods that measure glucose and they found 41% of instruments
have a significant bias from the reference method leading to
misclassification of 12% of patients. Hence the measurement of
glucose alone is less accurate and precise. Storage of blood samples
at room temperature for as little as 1 to 4 h before analysis
decreases the glucose levels by 3–10 mg/dl. Hence Hba1c can be
used along with FPG to detect diabetes.
Ollerton RL, Playle R, et al study (34) showed the variability of HbA1c values is considerably less than that of FPG levels, with
day-to-day and within-person variance of 2% for A1C but 12–15%
for FPG
International expert committee (35) was convened in 2008 to
consider the current and future means of diagnosing diabetes and
the Committee made its report on the role of the HbA1c assay in
the diagnosis of diabetes.
In 1997 expert committee report was against the use of
HbA1c values for diagnosis of diabetes because of the lack of assay
After the National Glycohemoglobin Standardization
Program had succeeded in standardizing HbA1c assays, the current
Expert Committee examined the laboratory measurements of
glucose and A1C assay and they reported that with advances in
instrumentation and standardization, the accuracy and precision of
A1C assays match those of glucose assays. Committee has
concluded HbA1c as a laboratory measure of chronic glycemia and
a more stable biological marker than FPG which is known to
fluctuate within and between days.
All of these studies (30, 31, 32, 33, 34, 35) suggest that HbA1c as a
reliable measure of chronic glycemic levels and also related more
intimately to the risk of complications. HbA1c may serve as a
better biochemical marker of diabetes and should be considered a
diagnostic tool. The convenience for the patient and ease of sample
collection for A1c testing (which can be obtained at any time,
requires no patient preparation, and is relatively stable at room
temperature) compared with that of FPG testing (which requires a
timed sample after at least an 8-h fast and which is unstable at room
The following studies are reviewed for our study references :
Thomas reinter, et al (4) did “A Study of Type 2 Diabetes Mellitus in Children and Adolescents”. They did screening in high
risk children and adolescents with family history of with T2DM,
obese children and those with clinical features of insulin resistance
such as hypertension, dyslipidemia, polycystic ovarian syndrome or
acanthosis nigricans. For diagnosis of DM they used the following
criteria,
a) Symptoms like polydipsia, polyuria and unexplained weight
loss
b) Casual glucose concentration 200mg/dl in venous plasma,
fating glucose 126mg/dl in venous plasma or two hour
glucose during OGTT 200mg/dl in venous plasma and
HbA1c 6.5%.
In this study they demonstrated type 2 diabetes mellitus in
1% of screened obese children in Germany and 4% of screened
obese adolescents with high risk ethnic groups in the United States.
They used HbA1c as one of the screening tool in diagnosis of DM
since HbA1c test has been included in the ADA (3) recommendation
used as screening tool for the diagnosis of T2DM in children and
adolescents after the standardisation of HbA1c test.
K .A. MATYKA, et al (37) did an “A STUDY OF TYPE 2 DIABTES IN CHILDHOOD: EPIDEMIOLOGICAL AND CLINICAL
ASPECTS”, and they discussed about the obesity epidemic and risk of type 2 diabetes in childhood. In this study they discussed the risk factors for T2DM. Regarding ethnicity the Indo-Asians are at high risk for developing diabetes. In this study majority of children with T2DM had family history of diabetes. According to their study the recent increase in the prevalence of childhood T2DM was linked to
the increase in childhood obesity.
Pavithra Vijayakumar, Robert G. Nelson et al (20) did a
study about HbA1c and the Prediction of Type 2 Diabetes in
Children and Adults. They included 2,095 American Indian
children, adolescents, and adults children without diabetes aged 10–
19 years and followed them every 2years.Children and adults
underwent comprehensive clinical examinations, which included
detailed medical histories, anthropometric measurements, and
biochemical tests. They measured FPG, 2hPG and HbA1c in all
these subjects. HbA1c was measured by high performance liquid
chromatography. Participants were classified into prediabetes (5.7–
6.4%), intermediate (5.4–5.6%), or lower (<5.3%) baseline HbA1c
categories. During long-term follow-up of children and adolescents
who did not initially have diabetes, the incidence rate of subsequent
diabetes was fourfold (in boys) as high and more than sevenfold (in
girls) as high in those with HbA1c 5.7% as in those with HbA1c
5.3% category. Their analysis revealed no significant differences
between HbA1c, FPG, and 2hPG in sensitivity and specificity for
identifying children and adolescents who later developed diabetes.
Hence they suggested HbA1c as a useful predictor of diabetes risk
other type 2 diabetes risk factors with the same predictive value as
FPG and 2hPG.
STUDY JUSTIFICATION
1. India has the largest number diabetes mellitus patient in the world. Many clinical oriented diabetic studies shows that the prevalence and incidence of type 2 DM in children and adolescent is increasing among indoasians Indian children belongs to a high risk ethnic group, so all overweight/obese children >10 years with any risk factors for T2DM should be screened for Type 2DM.
2. At risk children for T2DM but asymptomatic for long period may remain undiagnosed. Screening is needed in such situation.
3. Type 2 diabetes related morbidity and mortality can be decreased by early screening and intense treatment in the early stage. Hence screening for T2DM is needed to avoid complications like retinopathy, nephropathy.
4. T2DM can be prevented, if children are treated in the pre-diabetes stage itself.
AIM OF THE STUDY
The main aim of our study is to screen the children of Type 2
Diabetic mellitus Parents for early detection of diabetes by HBA1C
SUBJECTS AND METHODS
METHODOLOGY
STUDY DESIGN:
Cross sectional study
STUDY POPULATION:
Adolescent children aged 10-18 Years of Parents having
Type2 Diabetes Mellitus
PLACE OF STUDY:
Govt. Royapettah Hospital, Chennai.
SOURCE OF DATA:
Diabetic OP and Paediatric OP at Govt. Royapettah Hospital
Chennai.
STUDY PERIOD:
INCLUSION CRITERIA:
All adolescent children aged between 10-18 years with
one or both parents having Type 2 Diabetes Mellitus.
EXCLUSION CRITERIA:
1. All children and adolescents with known Type 1 Diabetes
Mellitus (Insulin Dependent Diabetes Mellitus).
2. All children and adolescents suffering from Chronic
Pancreatic Disorders.
3. All children and adolescents suffering from other Endocrine
Disorders
ETHICS:
Ethical committee clearance was obtained from our
Institutional Review Board.
SAMPLE SIZE: 140
SAMPLE SIZE DETERMINATION: Sample size
Study: Long term consequences for offspring of Paternal
Diabetes and Metabolic Syndrome
Authored by: Benigno Linares Segovia et al.
Published in: Experimental Diabetes Research Volume 2012
Journal.
Calculation: In the above study following calculations were
followed.
The confidence level is estimated at 95% with a z value of
1.96.
The confidence interval or margin of error is estimated at +/-8
Assuming p% = 37.00 and q% = 63.00
n = p% x q% x [z/e%] ^2
n = 37.00 x 67.00 x [1.96/8] ^2
n = 139.92 (rounded to 140)
Therefore 140 is the minimum sample size required for the
METHOD OF COLLECTION OF THE CLINICAL DATA
Type 2 Diabetes mellitus patients who came to Diabetic OP at
Govt Royapettah Hospital have been advised to bring their
adolescent children aged between 10-18 years for the diabetic
screening.
All children aged between 10-18 years who were brought by
the parents were enrolled in my study. Detailed history regarding
the onset, duration and mode of treatment of type 2 diabetes
mellitus in the parents were noted.
Complete examination including anthropometry & signs of
insulin resistance like acanthosis nigricans, PCOS in female child
[by USG], and Blood pressure measurement has been recorded for
all those children.
Blood has been collected under aseptic sterile technique in
fasting state and sent to the laboratory for measurement of HbA1c
level.
Children with HbA1c level more than >5.7 % were further
CLINICAL QUESTIONNAIRE
PARENT’S DETAILS:
The questions were asked about parent’s education level and
employment status, consanguinity between the parents as well as
information regarding the child’s health condition.
CHILDREN DETAILS:
Information was collected regarding the children’s clinical
history.
Family history: Documented evidence of diabetes mellitus in
parents, sibling, paternal and maternal grandparents, maternal and
paternal aunty (or) uncle.
Physical activity: Physical activity score were recorded
based on different levels of physical leisure activity. Physical
activity score was based on the validated questionnaire for physical
exercise taken from the National Diabetes Register (NDR),
Sweden’s national quality registers operated by the Swedish
PHYSICAL ACTIVITY SCORE:
No activity, activity (1 time/ week)
Regular activity (1–2 times/week),
Regular activity (3–5times/week)
Regular daily activity
SYMPTOMS OF HYPERGLYCAEMIA:
The following symptoms of hyperglycaemia were enquired in
all children included in the study,
Excessive Thirst And Drinking
Frequent Urination
Recent Weight Loss
Fatigue
Recurrent Thrush Or Skin Infections
TOOLS USED IN THE STUDY:
1. Digital Weighing Scale for Weight
2. Stadiometer for Height
MEASUREMENTS DONE IN THE STUDY:
1. Anthropometric Measurements
Measurement of Weight
Measurement of Height
Calculation of BMI
2. Acanthosis nigricans
3. Blood pressure measurement
4. USG study for Female children
5. Blood collection for HBA1C Measurement
1. ANTHROPOMETRIC MEASUREMENTS
These measurements were carried out in all my study subjects
for calculating BMI to detect overweight and obesity in children
which is one of the risk factor for T2DM.
WEIGHT MEASUREMENT PROCEDURE:
Weight was taken using a Digital Weighing Scale to the nearest 0.1kg, which was calibrated every day with a standard
adjustments were made for the weight of the dress worn during the
examination.
HEIGHT MEASUREMENT PROCEDURE:
Height was recorded to the nearest 0.1cm using an in-built
stadiometer. The height was taken after removing the footwear. The height was measured with child standing in erect posture with
heels, buttocks and back in close contact with the stadiometer. The
head was positioned with child looking forward so that the
Frankfurt plane (the line joining floor of external auditory meatus
to the lower margin of orbit) and the biauricular plane were
horizontal.
CALCULATION OF BMI:
Quetlet Index was used to calculate BMI. The children were classified into overweight (or) obesity using WHO Z-scores
reference.
BMI = WEIGHT IN kg / HEIGHT IN m2
1. Overweight (BMI 25 to 30)
2. Obesity (BMI >30)
BMI > +2SD to +3SD for age and sex.
2. ACANTHOSIS NIGRICANS
It is characterized by dark, thick, velvety, pigmented skin in
the neck and axilla. The most commonly used site to find
acanthosis nigricans in our study was neck area since it is found that this site was commonly involved in acanthosis nigricans in 93 to 99% of the cases as evident from the previous studies. It is also
easy to expose the neck area in practical settings and it is more comfortable for the subjects to expose the neck area than other areas.
3. BLOOD PRESSURE MEASUREMENT (BP)
BP was measured using Mercurial type Sphygmomanometer
with appropriate cuff size. Prior to taking BP readings all children
were instructed to rest for at least 10 minutes in an air-conditioned
environment. Measurements were taken two times on the right arm
with short intervals between readings, and the average of BP
4. USG STUDY FOR FEMALE CHILDREN
Ultra sonogram of abdomen and pelvis was done for all
female children and we used ROTTERDAM CRITERIA for
detecting PCOS in female children. When 2/3 of the following
criteria are met, female children were categorised as having PCOS.
1. Oligo or anovulation
2. Polycystic ovaries on ultrasonography (12 or more follicles in
a single ovary or ovarian volume of >10ml in 1 ovary)
3. Clinical and/or biochemical hyperandrogenism.
5. HbA1c MEASUREMENT
Fasting venous blood sample( after a eight hours fasting) was
drawn for all children included in the study and taken to laboratory immediately under full aseptic and cold chain precautions for HbA1c measurement.HbA1C test was done using the standardised
High performance liquid chromatography method.
HbA1c measurement was used as the screening test for the diagnosis of pre-diabetes and diabetes in my study as it was
convenient, easier and faster to perform. The oral glucose tolerance
than the HbA1c test and also HbA1c has higher specificity
compared to fasting blood sugar.
Cut off criteria used in my study is as follows
HbA1c < 5.7 classified as normal. HbA1c > 5.7 to 5.9 classified as prediabetes.
OBSERVATION AND ANALYSIS
140 children and adolescents were enrolled in the study on the basis of inclusion and exclusion criteria. The data entry was done in Microsoft Excel sheet.
STATISTICAL METHODS: Diabetic status and HbA1c are
primary outcome variable. Age, Gender, Family history of Diabetic,
Anthropometric parameters and if presence Acanthosis Nigricans
was considered as explanatory variable.
DESCRIPTIVE ANALYSIS: Descriptive analysis was
carried out by mean and standard deviation for quantitative
variables, frequency and proportion for categorical variables. Data
was also represented using appropriate diagrams like bar diagram,
pie diagram and box plots.
INFERENTIAL STATISTICS:
The association between explanatory variables and
categorical outcomes was assessed by cross tabulation and
comparison of percentages. Chi square test was used to test
P value < 0.05 was considered statistically significant. IBM
SPSS version 22 was used for statistical analysis.
Table 1: Descriptive analysis for Age in study population (N=140)
Parameter Mean±
STD Median Min Max
95% C.I. for EXP(B)
Lower Upper Age 14.5± 2.87 15.00 10.00 9.00 14.03 14.99
The mean of age was 14.51 years with a standard deviation of
2.87. The youngest person was 10years old and the oldest person
[image:69.612.120.515.191.326.2]was 19-years-old. (Table1)
Table 2: Descriptive analysis of Age group in study population
(N=140)
Age group Frequency Percentages
10-12 years 45 32.14%
13-15years 31 22.14%
Among the study population, the age group 10-12 years was
32.14%, 13-15 and 16 -19 years was 22.14% and 45.71%
[image:70.612.127.505.182.408.2]respectively. (Table 2 & figure 1, 2)
Figure 1: Pie chart of Age group distribution in study population (N=140)
[image:70.612.130.503.467.652.2]Table 3: Descriptive analysis of Gender in study population (N=140)
Gender Frequency Percentage
Male 86 61.43%
Female 54 38.57%
Among the study population, the proportion of boys were
61.43% and 38.57% were girls. (Table 3 & figure 3)
Figure 3: Bar chart of Gender distribution in study population
Table 4: Descriptive analysis of Diabetic H/o Mother in study population (N=140)
Diabetic H/o Mother Frequency Percentage
Yes 71 50.71%
No 69 49.29%
Among the study population, the Family history of diabetes
in Mother was present in 50.71% of subjects. (Table 4 & figure 4)
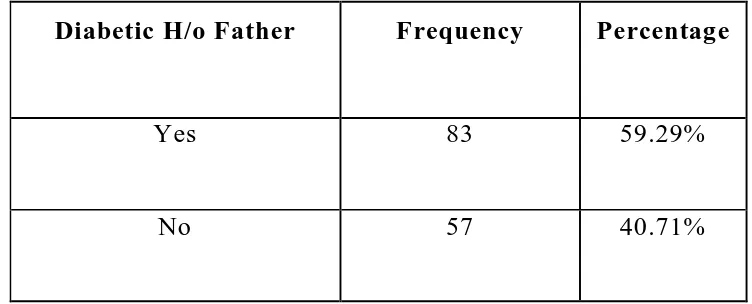
[image:72.612.128.503.431.663.2]Table 5: Descriptive analysis of Diabetic H/o Father in study population (N=140)
Diabetic H/o Father Frequency Percentage
Yes 83 59.29%
No 57 40.71%
Among the study population, the Family history of diabetes
in Father was present in 59.29% of people. (Table 5 & figure 5)
Figure 5: Bar chart of Diabetic H/o Father in study population
[image:73.612.120.503.458.694.2]Table 6: Descriptive analysis for Height in study population (N= 140)
Parameter Mean±
STD Median Min Max
95% C.I .for EXP(B)
Lower Upper
Height 153.53±
9.94 156.00 123.00 172.00 151.87 155.19
The Mean height of study population was 153.53± 9.94 with minimum 123 cm and Maximum 172 cm (95 C.I 151.87 to 155.19).(Table 6).
Table 7: Descriptive analysis for Weight in study population (N= 140)
Parameter Mean±
STD
Medi
an Min Max
95% C.I. for EXP(B)
Lower Upper
Weight 47.91±
9.75 49.00 22.00 70.00 46.28 49.54
[image:74.612.116.510.453.579.2]Table 8: Descriptive analysis for BMI in study population (N=140)
Parameter Mean±
STD Median Min Max
95% C.I. for EXP(B)
Lower Upper
BMI 20.32±
3.26 19.67 14.60 28.80 19.77 20.86
The Mean BMI of study population was 20.32± 3.26 with
[image:75.612.122.513.463.618.2]minimum 14.60 and Maximum 28.80 (95 C.I 19.77 to 20.86).
(Table 8)
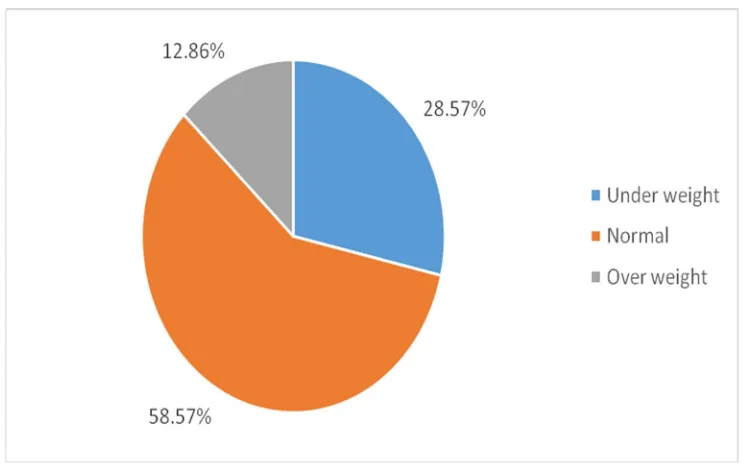
Table 9: Descriptive analysis of BMI category in study population (N=140)
BMI category Frequency Percentages
Under weight 40 28.57%
Normal 82 58.57%
Over weight 18 12.86%
Figure 6: Bar chart of BMI category distribution in study population (N=140)
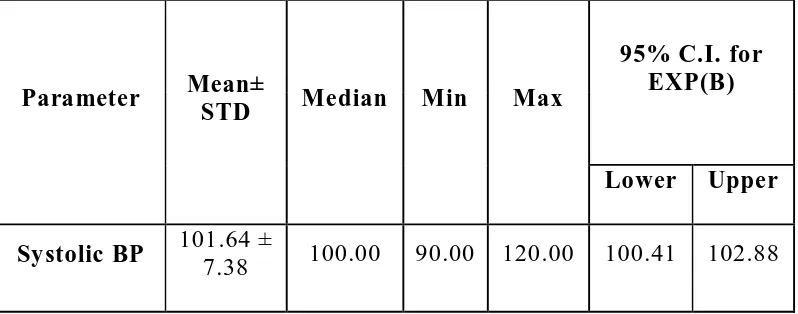
[image:76.612.130.503.449.685.2]Table 10: Descriptive analysis for BP Systolic in study population (N=140)
Parameter Mean±
STD Median Min Max
95% C.I. for EXP(B)
Lower Upper
Systolic BP 101.64 ±
7.38 100.00 90.00 120.00 100.41 102.88
[image:77.612.134.502.453.604.2]The Mean Systolic BP of study population was 101.64± 7.38 with minimum 90 and Maximum 120 (95 C.I 100.41 to 101.88). (Table 10)
Table 11: Descriptive analysis for BP Diastolic in study population (N= 140)
Parameter Mean±
STD Median Min Max
95% C.I. for EXP(B)
Lower Upper Diastolic
BP
70.21 ±
2.54 70.00 60.00 80.00 69.79 70.64
Table 12: Descriptive analysis of Acanthosis Nigricans in study
population (N=140)
Acanthosis Nigricans Frequency Percentage
Yes 27 19.29%
No 113 80.71%
Among the study population 19.29% people had Acanthosis
Nigricans. (Table 12 & figure 8)
Figure 8: Bar chart of Acanthosis Nigerians distribution in
[image:78.612.119.500.449.678.2]Table 13: Descriptive analysis of USG (female) in study population (N=54)
USG (female) Frequency Percentages
Normal study 52 96.30%
Prominent
ovaries/PCOD 2 3.70%
Among the study population, Ultra sound study (female) was
normal in 52(96.30%) of the female subjects. PCOD was present in
2 (3.70%) of female subjects (table 13 & figure 9)
[image:79.612.149.501.433.675.2]Table 14: Descriptive analysis for HbA1c in study population (N=140)
Parameter Mean±
STD Median Min Max
95% C.I. for EXP(B)
Lower Upper
HbA1c 4.9 ±
0.31 4.90 4.10 5.80 4.85 4.96
The Mean HbA1c of study population was 4.9± 0.31 with minimum 4.10 and Maximum 5.80 (95 C.I 4.85 to 4.96). (table14)
Table 15: Descriptive analysis of HbA1c category in study population (N=140)
HbA1c category Frequency Percentage
up to 5.6 (Normal) 136 97.14%
5.7to 5.9 (Prediabetes) 4 2.86%
Among the study population, the HbA1c category of up to 5.6
and was present in 97.14% and the HbA1c category of 5.7 to 5.9
[image:80.612.136.496.443.583.2]Figure 10: Bar chart of HbA1c category in study population (N=140)
Part-II: Factors associated with High HbA1c (Prediabetes and diabetes) level
Table 16: Association of HbA1c category with Age group of study population (N=140)
Age group
HbA1c category
Chi square
P value upto5.6(N=136)
(Normal)
5.7to 5.9(N=4)
(Prediabetes)
10-12
years 43 (31.62%) 2 (50%)
.810a 0.667
13-15years 30 (22.06%) 1 (25%)
[image:81.612.122.513.458.714.2]
Among the HbA1c up to 5.6 normal category (normal HBA1C
level) 43 (31.62%) were aged between 10-12 years, 30 (22.06%)
were aged between 13-15 years and 63 (46.32%) were aged
between 16-19 years was respectively. Among subjects with HbA1c
5.7 to 5.9 category (Pre diabetic), the number of subjects in Age
group 10-12, 13-15 and 16-19 years were 2 (50%), 1 (25%) and 1
(25%) respectively. The differences in HBA1C level and specific
age group were statistically not significant (P value 0.667). (table16
[image:82.612.139.496.433.678.2]& figure 11)
Figure 11: Bar chart of comparing Age group of the two study
Table 17: Association of HbA1c category with Gender of study population (N=140)
Gender
HbA1c category
Chi square
P-value Up to 5.6 (N=136)
(Normal)
5.7to5.9 (N=4) (Prediabetes)
Male 85 (98.84%) 1 (1.16%)
2.306a 0.129
Female 51 (94.44%) 3 (5.56%)
Among the HbA1c up to 5.6 category 85(98.84%) were Male and51 (94.44%) were Female. The number of Male and Female was 1 (1.16%) and3 (5.56%) in HbA1c 5.7 to 5.9 category. The differences in gender proportion between the two groups was statistically not significant (P value 0.129) (table 17 & figure 12)
[image:83.612.155.471.507.687.2]Table 18: Association of HbA1c category with BMI category of
study population (N=140)
BMI category
HbA1c category up to 5.6(N=136)
(Normal)
5.7to 5.9(N=4) (Prediabetes)
Under weight 40 (29.41%) 0 (0%)
Normal 79 (58.09%) 3 (75%)
Over weight 17 (12.5%) 1 (25%)
No statistical test was applied considering “0” subjects in one
of the BMI category.
Among the HbA1c up to 5.6 normal category 40 (29.41%)
were under weight, 79 (58.09%) were Normal Weight and 17
(12.5%) were Overweight children. The number of Normal and
Overweight children in HbA1c 5.7 to 5.9 prediabetes category were
Figure 13: Bar chart of comparing BMI category of the two study groups (N=140)
Table 19: Association of HbA1c category with USG (female) of
study population (N=54)
USG (female)
HbA1c category
Chi square
P-value up to 5.6 5.7 to 5.9
Normal study 50
(98.04%) 2 (66.67%)
7.819a 0.005
Prominent
[image:85.612.134.498.441.689.2]Among the HbA1c up to 5.6 category 50 females (98.04%)
were Normal and 1female child (1.96%) had PCOD. Among the
HbA1c 5.7 to 5.9 category 2 females (66.67%) had Normal USG
and 1 female (33.33%) had PCOD. The differences in USG
between the two groups were statistically significant (P value
0.005).
Bar chart of comparing USG (female) of the two study groups
DISCUSSION
Children of T2DM parents were chosen for conducting the
study because it is proven in many clinical trial studies that type 2
diabetes run in families. Hence we instructed the diabetic patients
(father/mother) who all came to the Diabetic op to bring their
adolescent children aged 10-19 years for diabetic screening using
various clinical and biochemical parameters.
140 children were brought by the parents and were included
in our study. We divided the children into three groups to know any age specific variation in HbA1c level. Age groups were 10-12 years, 13-15years and 16-19years. Among the study population,
children in the age group of 10-12 years were 45 in number
(32.14%), children in the age group of 13-15years were 31 in
number (22.14% ) and 16 -19 years age group were 64 in number (
45.71% ). Majority of the subjects in our study belonged to 16-19
years (45.71%) i.e. adolescent age.
Among the study population, boys were 86 in number
(61.43%) and girls were 54 in number (38.57%). Majority of the