EUROPEAN COMMISSION RESEARCH DIRECTORATE-GENERAL
The Director-General
Third
FP7 Monitoring Report
M
ONITORING
R
EPORT
2009
T
ABLE OFC
ONTENTS0 EXECUTIVE SUMMARY...1
1 FP7IMPLEMENTATION IN 2009–GENERAL OVERVIEW...3
1.1 Introduction ... 3
1.2 Participation patterns ... 5
1.2.1 Overall participation ... 7
1.2.2 Participation by funding scheme ... 13
1.2.3 Participation by type of organisation ... 15
1.2.4 Participation by country... 19
1.3 Gender equality and FP7... 28
1.3.1 Patterns of women participation as contact persons in FP7 projects... 29
1.3.2 Women participation in FP7 advisory groups, panels and committees ... 31
1.4 Quality assessment of proposal evaluation ... 32
1.5 Redress procedure ... 33
1.6 The FP7 ethics framework - ethics reviews and ethics audits... 34
1.6.1 Ethics review process ... 34
1.6.2 Ethics audit ... 35
1.6.3 Impact assessment procedure... 35
1.6.4 Ethics review helpdesk ... 35
1.7 Dissemination activities ... 36
1.7.1 Internet... 36
1.7.2 National Contact Points meetings ... 37
1.8 Time to grant ... 38
1.9 Timeliness of experts reimbursements ... 39
1.10 Independent assessment of FP7 implementation by National Contact Points .... 39
2 FP7IMPLEMENTATION IN 2009–SPECIAL FOCUS...41
2.1 European Research Council ... 41
2.1.1 The ERC peer review evaluation process... 42
2.1.2 Performance of the calls ... 42
2.1.3 Observing sound ethical principles of FP research ... 43
2.2 Joint Technology Initiatives ... 43
2.3 Initiatives under article 185 (ex-169) ... 45
2.4 Risk-Sharing Financial Facility... 46
2.5 International dimension of FP7 ... 48
2.6 Sustainable development ... 50
2.6.1 FP7 and the renewed EU Sustainable Development Strategy... 50
2.6.2 Web-based monitoring tool on research for sustainable development ... 50
2.6.3 Achievements regarding FP7 contribution to sustainable development... 51
2.7 Marie Curie Actions ... 53
2.7.1 Implementation of calls ... 55
2.7.2 REA and DG EAC... 55
2.8 EURATOM... 56
2.8.1 Nuclear fission and radiation protection ... 56
2.8.2 Fusion energy ... 57
3 SIMPLIFICATION...59
3.1 Simplification measures in FP7... 59
3.1.1 Certification of costs – fewer audit certificates ... 59
3.1.2 Fewer ex-ante financial capacity checks and protective measures - Introduction of the Participants Guarantee Fund ... 59
3.1.3 Unique registration of participating legal entities... 59
3.1.4 Grant agreement negotiation ... 60
3.1.5 Project reporting ... 60
3.1.7 Streamlining and harmonisation of documentation ... 61
3.1.8 Research Participant Portal ... 61
3.2 Perception of simplification in FP7 by National Contact Points... 61
3.2.1 User-friendliness of the FP7 administrative and financial procedures ... 61
3.2.2 Simplification measures ... 64
4 ACHIEVEMENTS...66
ANNEX A: MONITORING SYSTEM FOR FP7...68
ANNEX B: STATISTICAL TABLES ON PARTICIPATION PATTERNS...71
ANNEX C: STATISTICAL RESULTS OF NCPSURVEY ON FP7PROMOTION AND IMPLEMENTATION IN 2009 ...76
ANNEX D: GLOSSARY...89
0
E
XECUTIVES
UMMARYThe third FP7 Monitoring Report covers the implementation of the Framework Programme in the years 2007-2009. It is based on the FP7 monitoring system, which was designed as an internal management tool using a core set of performance indicators.
In section 1 this document provides a detailed factual analysis of the main elements of the overall implementation of FP7. Section 2 takes a closer look at some of the elements of the Framework Programme which deserve a special focus. Section 3 presents the current situation with regard to the simplification process and also the results of a survey on the perception of simplification in FP7 by National Contact Points (NCPs). Section 4 looks at the early achievements of the programme.
Although a substantial part of the report is based on existing material which has been already (at least partially) released, the report provides an integrated view on the different strands of FP7 activities.
Compared to the previous Monitoring Reports, this third Monitoring Report
shows that basic participation patterns are rather stable after three years of FP7 implementation;
allows in some specific areas a more complete comparison over time of FP7 implementation;
presents for the first time detailed gender participation statistics for the different FP7 thematic areas as well as for the 27 EU Member States;
includes two new 'special focus' topics, namely Sustainable Development and Marie Curie Actions.
The following selected facts and figures highlight some of the main findings of this report:
The magnitude of FP7 is illustrated by the impressive participation figures: During the three first years of FP7, 170 concluded calls received more than 55.000 proposals, out of which more than 40.000 – involving a staggering 235.000 applicant organisations and individuals – were included in the evaluation procedure, and more than 9.000 – involving more than 50.000 participants – were finally retained for negotiations, with a corresponding requested Community funding of € 15 billion. Proposals and applicants had an average success rate of around 22%.
On the participation of small and medium enterprises (SMEs), it is estimated that during the first three years of FP7 implementation 14,5% of all participants in signed grant agreements were SMEs.
On the gender dimension of FP7 participation, it is estimated that 20,5% of contact persons for scientific aspects in FP7 funded projects, 36,1% of Marie Curie fellows and 19,4% of principal investigators under ERC grants are women. A more detailed analysis shows significant variations among the different thematic areas of FP7 as well as among the EU member states.
On the redress and ethical review procedures, out of the 1.601 requests for redress received, only 19 led to a re-evaluation, whereas 771 ethical reviews were organised so far with no project having been stopped.
Feedback from readers and users is most welcome as it will help to improve the next reports to be produced under the FP7 monitoring system.
Comments can be sent to: European Commission DG Research
Unit A.3 "Evaluation and monitoring of programmes" Peter Fisch
SDME 02/41 1049 Brussels Belgium
1
FP7
I
MPLEMENTATION IN2009
–
G
ENERALO
VERVIEW1.1 Introduction
The legislative basis for FP7 states that "the overriding aim of the Seventh Framework Programme is to contribute to the Union becoming the world's leading research area. This requires the Framework Programme to be strongly focused on promoting and investing in world-class state-of-the-art research, based primarily upon the principle of excellence in research [...] The objectives [...] should be chosen with a view to building upon the achievements of the Sixth Framework Programme towards the creation of the European Research Area and carrying them further towards the development of a knowledge-based economy and society in Europe which will meet the goals of the Lisbon strategy in Community policies." 1
A new structure was designed to capture the broad range of research activities funded by the European Union under FP7. The objectives of FP7 have been grouped into four categories: "Cooperation", "Ideas", "People" and "Capacities". For each type of objective, there is a specific programme that corresponds to one of the main areas of EU research policy. In addition, the Joint Research Centre's (JRC) direct actions relating to non-nuclear research are grouped under a specific programme with its own budget allocation. JRC direct actions in the field of nuclear research and the indirect actions supported by the EURATOM 7th Framework for Programme for Nuclear Research and Training Activities comprise distinct strands of FP7. That structure can be further broken down into the general headings given in the diagram below. In broad terms:
The specific programme Cooperation provides project funding for collaborative, transnational research. The programme is organised through thematic priorities such as health, energy, transport etc.
The specific programme Ideas provides project funding for individuals and their teams engaged in frontier research. This programme is managed by the European Research Council (ERC).
The specific programme People funds actions to improve the training, career development, and mobility of researchers between sectors and countries world wide. It is managed under the Marie Curie programme.
The specific programme Capacities funds actions that are designed to improve Europe's research infrastructure and the research capacity of SMEs. It also hosts smaller programmes relating to Science in Society, Regions of Knowledge, Research Potential, International Cooperation, and the Coherent Development of Research Policies.
This structure of FP7 is illustrated in table 1 below. Figure 1 shows the budget breakdown for FP7.
FP7 builds on the achievements and good practice of earlier Framework Programmes with a good deal of continuity both at an operational level and in terms of strategic objectives. There are however, a number of novelties which represent a significant change compared to
1
previous Framework Programmes. These novelties were presented in more detail in the first
FP7 Monitoring Report.
Table 1: Structure of FP7 – Specific Programmes and Thematic Areas.
Specific
Programmes Thematic Areas
Abbreviation used in graphs
Health Health
Food, Agriculture, and Biotechnology Food
Information and Communication Technologies ICT
Nanosciences, Nanotechnologies, Materials and new Production Technologies Nanotech
Energy Energy
Environment (including Climate Change) Environment
Transport (including Aeronautics) Transport
Socio-economic Sciences and Humanities SSH
Space Space
Security Security
C
O
O
PER
AT
IO
N
General Activities General
Starting Independent Researcher Grants ERC
IDEAS
Advanced Investigator Grants ERC
Initial Training of Researchers Marie Curie
Lifelong Learning and Career Development Marie Curie
Industry - Academia Partnerships / Pathways Marie Curie
The International Dimension Marie Curie
PEO
PLE
Specific Actions Marie Curie
Research Infrastructures Infrastructures
Research for the Benefit of SMEs SME
Regions of Knowledge Regions
Research Potential Potential
Science in Society Society
Coherent Development of Research Policies Policies
CAPACI
TIES
Activities of International Cooperation INCO
Fusion Energy Fusion
Indirect Actions
Nuclear Fission and Radiation Protection Fission
EURATOM
Direct Actions Nuclear Field (undertaken by JRC)
Prosperity in a Knowledge Intensive Society
Solidarity and the Responsible Management of Resources
Security and Freedom JRC (Direct
Actions)
Figure 1: FP7 budget breakdown in € million.*
COOPERATION; 32.413
IDEAS; 7.510
PEOPLE; 4.750
CAPACITIES; 4.097 JRC; 1.751
* The EURATOM FP7 budget of €2,7 billion over 5 years is not included.
1.2 Participation patterns
This section aims to provide a comprehensive statistical overview of FP7 implementation in 2009 as well as a comparative overview of the first three years. The data used in this section are exclusively drawn from the Common Research Data (CORDA) warehouse.2
Some of the terms used throughout this section which require definition or clarification are the following:
A call for proposal is concluded when data on the evaluation and selection outcome are available and have already been communicated to the respective FP7 Programme Committees at the time of data extraction.
The dataset of included proposals, on which the analysis of participation patterns and success rates in this section is based, consists of eligible proposals, i.e. submitted proposals that fulfil the formal eligibility criteria set by the respective calls for proposals, without taking into account:
o duplicate and withdrawn proposals;
o eligible first stage proposals in the case of two-stage calls.
Success rates are always calculated as ratios of retained to included proposals.
2
This report is based on statistical data on calls for proposals with closure dates in 2007, 2008 and 2009, which have been concluded by April 2010. The reported numbers of concluded calls are not final, especially for the last year, and are likely to rise in the course of FP7 as more calls are concluded and recorded in the CORDA database. For this reason the reported statistical data for past years are always retrospectively updated in subsequent Monitoring Reports; this is also applied in this report to the data for 2007 and 2008, which have been updated according to the latest available information. It is, therefore, important to keep in mind the preliminary nature of the 2009 data included in this report, as later updates are likely to affect the analysis.
Recently signed grant agreements are continuously added in the CORDA database in the course of the Framework Programme implementation, and figures on signed grant agreements are accordingly updated. Due to the constantly changing picture of grant agreement statistics, the time lag of this procedure and the consequent limited availability of data on grant agreements signed during the most recent year at the moment of data extraction, the Monitoring Reports follow the convention of only presenting cumulative statistics on grant agreement counts instead of on a year by year basis.
Box 1: Data issues and methodology
The FP7 proposals and participants database contains information on calls for proposals for which validated evaluation and selection data is available centrally and has already been communicated to the respective FP7 Programme Committee configurations. Call-specific evaluation and selection results enter the system almost on a daily basis and are then validated by the responsible Commission services. Commission services cannot be held responsible for the quality and content of applicant-supplied information contained in submitted proposals.
In FP7 the problem of the existence of multiple entries on participants is addressed by the introduction of a 'Unique Registration Facility' (URF) for participants.
Information on the type of activity and legal status, including SME status, at the proposal submission phase is provided by the applicant organisation; this information is not verified by Commission services before the proposal is retained for negotiation and, consequently, is subject to considerable identification and measurement error which limits the reliability of this type of data. It is expected that such inconsistencies will be sorted out with the introduction of more intelligent data acquisition system, such as a revised version of the Electronic Proposal Submission System (EPSS).
Summary statistics on FP7 including proposals, applicants and success rates by funding scheme, applicant activity type and nationality are based on (i) eligible proposal and participants data submitted to single stage calls for proposals and (ii) second stage eligible proposal and participants data for FP7 calls for proposals involving two-stage proposal submission and evaluation procedures, without taking into account data from proposals submitted to the first stage of the calls. First stage proposals are, in most cases, reduced or outline versions of the full proposal and they do not provide data on participants other than the coordinator and, therefore, no meaningful statistics on participant nationality or type of activity can be compiled. Following evaluation, each proposal is associated to an Evaluation Summary Report (ESR) and the resulting evaluation outcome. Those proposals that pass to the second stage of the evaluation are submitted in full together with complete participants' data thus allowing for statistical analysis, and first stage data are overwritten by second stage data. Following the second stage evaluation each proposal is once again associated with the corresponding ESR, evaluation outcome and, finally, an EC decision.
The following limitations in the availability of financial data in "Ideas" and "People" proposals need to be carefully considered when drawing conclusions on the basis of reported statistics:
1.2.1 Overall participation
1.2.1.1 Calls, proposals, applicants and corresponding success rates
The 54 calls for proposals with call closure date in 2009 recorded in CORDA by April 2010 attracted in total 13.654 applications for funding. The large majority of the 2009 applications (12.800) was submitted to 47 one-stage calls (see also table B1 in annex B).
The majority of submitted proposals (94% or 12.858) was 'included' (as defined above), and about a quarter of that (3.285) retained for funding negotiations with an overall success rate of 25,5% – significantly higher than in previous years.
At the time of data extraction included and retained proposals involved a total of 62.569 and 15.291 applicants respectively with an overall success rate of 24,4%. The so-far recorded numbers of applicants in retained proposals are higher than those in 2008 (14.110) and their success rates are considerably higher than those of 2008 (20,9%) and also above the average for the three years (22%).
The aggregate figures for 2007, 2008 and 2009 show that for a total of 170 concluded calls, 55.379 proposals were submitted, out of which 41.747 – involving 234.023 applicants – were included, and 9.121 – involving 51.397 participants – retained for negotiations. The average success rate for the three years was 21,8% in terms of proposals and 22% in terms of applicants.
1.2.1.2 Project costs, requested contributions and corresponding success rates
The included proposals, which correspond to the 54 recorded calls in 2009, involved a total project cost of € 26,2 billion with a requested Community contribution of € 20 billion. After the evaluation and selection stage the total project cost of the retained proposals is € 5,4 billion, which corresponds to a success rate of 20,8%, and the requested Community contribution is € 4 billion – about three quarters of the total cost, corresponding to a success rate of 20,1%.
The aggregate project cost of the retained proposals from 2007 to 2009 is € 20,6 billion and the corresponding Community financial contribution is € 14,9 billion with a corresponding average success rate of 20%.
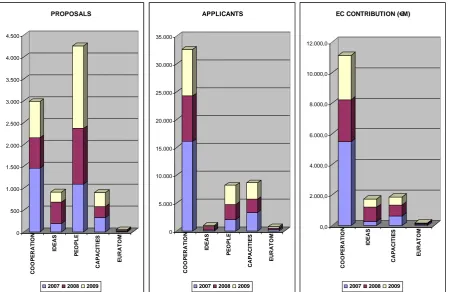
Figure 2: Numbers of proposals, applicants and amounts of requested Community financial contribution (in € million) in retained proposals for FP7 calls concluded in 2007, 2008 and 2009 by specific programme.
0 500 1.000 1.500 2.000 2.500 3.000 3.500 4.000 4.500 C O O PER A T IO N IDE A S PEO PL E C A P ACIT IE S EU R A T O M PROPOSALS
2007 2008 2009
0 5.000 10.000 15.000 20.000 25.000 30.000 35.000 CO O P E R AT IO N ID E A S PE O P L E CA P A CIT IE S EU R A T O M APPLICANTS
2007 2008 2009
0,0 2.000,0 4.000,0 6.000,0 8.000,0 10.000,0 12.000,0 CO O P E R AT IO N IDE A S C A PA C IT IES EU R A T O M
EC CONTRIBUTION (€M)
2007 2008 2009
1.2.1.2.1 Specific programme Cooperation
In 2009 the specific programme Cooperation received more than a third of all included proposals (4.432) and a quarter of all retained proposals (831), which involved about two thirds (40.608) and more than half (8.389) of all applicants respectively.
The aggregate figures for FP7 subscription and participation under Cooperation in 2009 in terms of numbers of proposals, applicants and amounts of budgets as recorded in CORDA at the time of data extraction (April 2010) are higher (and expected to become even higher) than those in 2008, both in terms of included and retained proposals, while success rates are comparable to those in past years (see table B2 in annex B).
More than half of all retained proposals, applicants and requested Community financial contribution under Cooperation in 2009 come from the thematic area of Information and Communication Technologies, followed at a distance by Nanosciences, Nanotechnologies, Materials and new Production Technologies (10,8% of proposals), and Environment and Food, Agriculture and Fisheries, and Biotechnology with similar shares (below 10%).
1.2.1.2.2 Specific programme People (Marie Curie Actions)
At the time of data extraction for this report (April 2010) there were 9 concluded calls with call closure date in 2009 launched under the specific programme People recorded in the CORDA database.3 These calls received 5.282 included and 1.889 retained proposals (or
3
41,1% and 57,5% of the total respectively) with 13,3% and 22,6% of all applicants respectively.
The recorded success rates were 35,8% at the level of proposals and 41,5% at the level of applicants (see figure 4). These success rates for 2009, however, are expected to be lower in subsequent Monitoring Reports with the retroactive updating of 2009 data, due to the exclusion of a large call under People, namely FP7-PEOPLE-2010-ITN, which at the time of data extraction for this report was not yet 'concluded' (see footnote 3).
Due to the specific design of a number of the Marie Curie Actions (financial support to individual researchers in liaison with a 'host organisation' as legal entity – see box 1 for a more detailed explanation) the CORDA database does not provide comprehensive information on projects costs and corresponding Community financial contribution.
1.2.1.2.3 Specific programme Ideas (European Research Council)
The single concluded one-stage call, as recorded in CORDA, with closure date in 2009 launched by the European Research Council (ERC) attracted 1.584 proposals, 1.526 of which were included in the selection but only 230 of those were retained for negotiations – a mere 7% of the total number of retained proposals in 2009 and less than half of those in 2008 – with a corresponding success rate of 15,1%.
The corresponding Community contribution amounts to an estimated € 532 million or 13,2% of the total, and a success rate of 16,3%.
1.2.1.2.4 Specific programme Capacities
In 2009 the specific programme Capacities exhibited levels of included and retained proposals, participants and amounts of requested Community contribution comparable to those in the previous years. In relative terms, Capacities accounted for approximately a tenth of the whole FP7 in terms of retained proposals, somehow higher in terms of Community financial contribution, and close to a fifth of the total in terms of applicants. In absolute terms, the Community financial contribution in retained proposals under Capacities is similar in size to that of the ERC, namely € 529 million.
As in previous years the thematic area with by far the largest share of retained proposals was Research for the benefit of SMEs (57% of the total number of retained proposals under Capacities), corresponding to slightly less than half of the entire budget of the Capacities programme. Research Infrastructures came second with 12% of all proposals and with approximately a quarter of the total requested Community contribution under the specific programme Capacities.
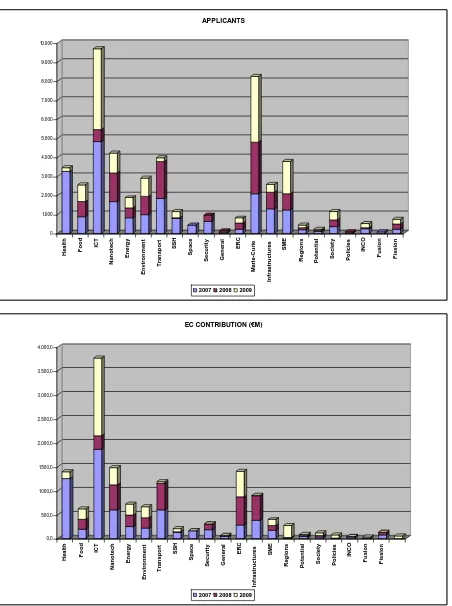
Figure 3: Numbers of applicants and amounts of requested Community financial contribution (in € million) in retained proposals for FP7 calls concluded in 2007, 2008 and 2009 by thematic area.
0 1.000 2.000 3.000 4.000 5.000 6.000 7.000 8.000 9.000 10.000 He al th Food IC T N a not e c h En e rg y E n vi ro n m en t Tr a ns por t SS H S p ace S ecu ri ty Ge n e ra l ER C M a ri e -C u ri e In fr a s tr uc tu re s SM E R e gi on s Po te n ti a l So c ie ty P o lic ie s IN C O Fus ion Fi s s ion APPLICANTS
2007 2008 2009
0,0 500,0 1.000,0 1.500,0 2.000,0 2.500,0 3.000,0 3.500,0 4.000,0 H eal th Food IC T N a not e c h En e rg y E n vi ro n m en t Tr a ns por t SSH S p ace Se c u ri ty Ge n e ra l ER C In fr ast ru ct u res SM E R e gi ons Po te n ti a l S o ci et y P o lic ie s IN C O Fus ion Fi s s ion
EC CONTRIBUTION (€M)
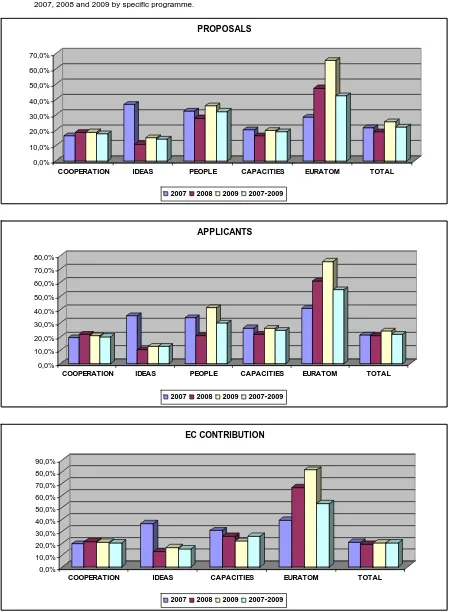
Figure 4: Success rates in proposals, applicants and requested Community financial contribution for FP7 calls concluded in 2007, 2008 and 2009 by specific programme.
0,0% 10,0% 20,0% 30,0% 40,0% 50,0% 60,0% 70,0%
COOPERATION IDEAS PEOPLE CAPACITIES EURATOM TOTAL
PROPOSALS
2007 2008 2009 2007-2009
0,0% 10,0% 20,0% 30,0% 40,0% 50,0% 60,0% 70,0% 80,0%
COOPERATION IDEAS PEOPLE CAPACITIES EURATOM TOTAL
APPLICANTS
2007 2008 2009 2007-2009
0,0% 10,0% 20,0% 30,0% 40,0% 50,0% 60,0% 70,0% 80,0% 90,0%
COOPERATION IDEAS CAPACITIES EURATOM TOTAL
EC CONTRIBUTION
2007 2008 2009 2007-2009
1.2.1.3 Signed grant agreements
For the concluded calls with closure dates in 2007-2009 as of April 2010, 6.483 grant agreements have been signed, which involve 38.691 participants and will be funded by the Community with € 11,9 billion.
Figure 5: Numbers of FP7 signed grant agreements, participants and amounts of project costs and Community financial
contribution in € million during the first three years of FP7 implementation (as of April 2010).
0 500 1.000 1.500 2.000 2.500 3.000 CO O P E RAT IO N ID E A S PE O PL E CAP ACI T IE S E URAT O M GRANT AGREEMENTS 0 5.000 10.000 15.000 20.000 25.000 30.000 CO O P E RAT IO N ID E A S PE O PL E CAP ACI T IE S E URAT O M PARTICIPANTS 0,0 2.000,0 4.000,0 6.000,0 8.000,0 10.000,0 12.000,0 CO O P E RAT IO N ID E A S PE O P L E CAP ACI T IE S E URAT O M
PROJECT COST & EC CONTRIBUTION
1.2.2 Participation by funding scheme
Data on FP7 participation are conventionally aggregated in the CORDA database according to the following groups of funding schemes:4
Collaborative Projects, including combinations of Collaborative Projects and Coordination and Support Actions (CP/CP-CSA)
Networks of Excellence (NoE)
Coordination and Support Actions (CSA)
Marie Curie Actions (support for training and career development of researchers), Research for the Benefit of Specific Groups, and European Research Council (support for frontier research) (MC/BSG/ERC)
Similarly to the previous years, in 2009 Collaborative Projects made up by far the largest part of FP7 in retained proposals both in terms of total numbers of applicants (49,4%) and of requested Community contribution (71,2%), while Marie Curie Actions, BSG and the ERC have the highest share of retained proposals – more than two thirds of the total (2.271 or 69,1%). The share of the Networks of Excellence funding scheme remains very low, with only 16 new retained proposals (14 of which in the thematic area of Information and Communication Technologies) involving 209 applicants and a corresponding Community contribution of € 73,9 million.
4
Figure 6: Numbers of retained proposals, numbers of applicants and amounts of requested Community financial contribution (in € million) in retained proposals for FP7 calls concluded in 2007, 2008 and 2009 by funding scheme.
0 1.000 2.000 3.000 4.000 5.000 6.000
CP
/CP
-CS
A
No
E
CS
A
M
C
/B
S
G
/E
RC
PROPOSALS
2007 2008 2009
0 5.000 10.000 15.000 20.000 25.000 30.000
CP
/CP
-CS
A
No
E
CS
A
M
C
/B
S
G
/E
RC
APPLICANTS
2007 2008 2009
0,0 2.000,0 4.000,0 6.000,0 8.000,0 10.000,0 12.000,0
CP
/CP
-CS
A
No
E
CS
A
MC
/B
S
G
/E
R
C
EC CONTRIBUTION (€M)
2007 2008 2009
Figure 7: Numbers of applicants and amounts of requested Community financial contribution in retained proposals for FP7 calls concluded in 2007, 2008 and 2009 by funding scheme and specific programme.
0 2.000 4.000 6.000 8.000 10.000 12.000 14.000 16.000
2007 2008 2009 2007 2008 2009 2007 2008 2009 2007 2008 2009
CP/CP-CSA NoE CSA MC/BSG/ERC
APPLICANTS
COOPERATION IDEAS PEOPLE CAPACITIES EURATOM
0,0 1.000,0 2.000,0 3.000,0 4.000,0 5.000,0 6.000,0
2007 2008 2009 2007 2008 2009 2007 2008 2009 2007 2008 2009
CP/CP-CSA NoE CSA MC/BSG/ERC
EC CONTRIBUTION (€M)
COOPERATION IDEAS PEOPLE CAPACITIES EURATOM
1.2.3 Participation by type of organisation
Data on the type of activity of participating organisations in FP7 is collected according to a classification scheme which groups organisations in the following categories:
Higher or secondary education (HES)
Private for profit (excluding education) (PRC)
Public body (excluding research and education) (PUB)
Research organisations (REC)
Other (OTH)
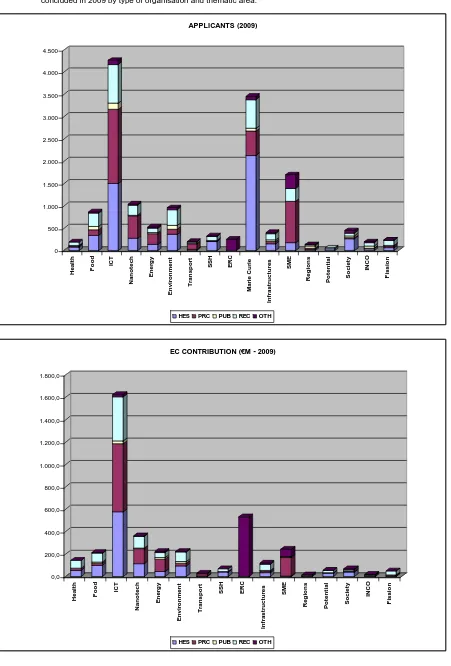
In terms of requested Community funding in retained proposals, the biggest beneficiaries in 2009 are again education institutes (HES) and private for profit organisations (PRC) with similar shares (29% of total), closely followed by research organisations (REC) (23% of total).
Figure 8: Numbers of applicants and amounts of requested Community financial contribution (in € million) in retained proposals for FP7 calls concluded in 2007, 2008 and 2009 by type of organisation.
0 2.000 4.000 6.000 8.000 10.000 12.000 14.000 16.000 18.000 20.000
HES PRC PUB REC OTH
APPLICANTS
2007 2008 2009
0,0 500,0 1.000,0 1.500,0 2.000,0 2.500,0 3.000,0 3.500,0 4.000,0 4.500,0 5.000,0
HES PRC PUB REC OTH
EC CONTRIBUTION (€M)
2007 2008 2009
Figure 9: Numbers of applicants and amounts of requested Community financial contribution (in € million) in retained proposals for FP7 calls concluded in 2007, 2008 and 2009 by type of organisation and specific programme.
0 1.000 2.000 3.000 4.000 5.000 6.000 7.000 8.000 9.000
2007 2008 2009 2007 2008 2009 2007 2008 2009 2007 2008 2009 2007 2008 2009
HES PRC PUB REC OTH
APPLICANTS
COOPERATION IDEAS PEOPLE CAPACITIES EURATOM
0,0 500,0 1000,0 1500,0 2000,0 2500,0
2007 2008 2009 2007 2008 2009 2007 2008 2009 2007 2008 2009 2007 2008 2009
HES PRC PUB REC OTH
EC CONTRIBUTION (€M)
COOPERATION IDEAS PEOPLE CAPACITIES EURATOM
Figure 10: Number of applicants and amounts of requested Community contribution in retained proposals for FP7 calls concluded in 2009 by type of organisation and thematic area.
0 500 1.000 1.500 2.000 2.500 3.000 3.500 4.000 4.500 H ealt h Food ICT N a note c h En e rg y E n vir o n m en t Tr a ns p or t SSH ER C M a ri e C u ri e In fr ast ru ct u res SM E R e gi ons Po te n ti a l S o ciet y IN CO Fi s s ion APPLICANTS (2009)
HES PRC PUB REC OTH
0,0 200,0 400,0 600,0 800,0 1.000,0 1.200,0 1.400,0 1.600,0 1.800,0 H ealt h Foo d ICT N a not e c h En e rg y E n vir o n m en t Tr a ns por t SSH ER C In fr ast ru c tu res SME R e gi ons Po te n ti a l S o ciet y IN CO Fi s s ion
EC CONTRIBUTION (€M - 2009)
1.2.3.1.1 SME participation
Due to the well-known limitations of the statistical data on SMEs in submitted, included and retained proposals, the figures provided in this report are drawn from data on signed grant agreements corresponding to concluded calls with call closure date from 2007 to 2009 as recorded in CORDA at the time of the last data extraction in April 2010.
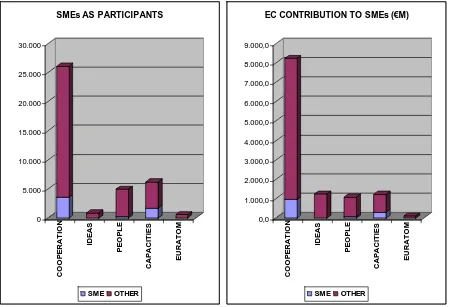
During the first three years of FP7 implementation SMEs represented 14,5% of all participants in signed grant agreements, and their share of total project costs and requested Community contribution was 11% (€ 1,8 billion) and 11,3% (€ 1,3 billion) respectively. SMEs represent 13,7% of participants and receive 11,7% of Community funding in the specific programme Cooperation (see figure 11 below and table B5 in annex B).
[image:22.595.74.524.362.669.2]About two thirds (63,6%) of all SMEs that participate in signed grant agreements are under the specific programme Cooperation, and more than a quarter (27,4%) of them under the specific programme Capacities. Their presence in the specific programmes Ideas and Euratom is negligible. In the case of the specific programme People, SME participation varies significantly from one action to another: While individual fellowships rarely involve SMEs, SMEs make up 25% of all participants in IAPP and their budget share is € 25,4 million or 33,4% of the total for this Action.
Figure 11: Share of SMEs in terms of numbers of participants and amounts of Community financial contribution in grant
agreements corresponding to FP7 calls concluded in 2007, 2008 and 2009.
0 5.000 10.000 15.000 20.000 25.000 30.000 CO O P E RAT IO N ID E A S PEO PL E CAP ACI T IE S E URAT O M
SMEs AS PARTICIPANTS
SME OTHER 0,0 1.000,0 2.000,0 3.000,0 4.000,0 5.000,0 6.000,0 7.000,0 8.000,0 9.000,0 CO O P E RAT IO N ID E A S PEO PL E CAP ACI T IE S E URAT O M
EC CONTRIBUTION TO SMEs (€M)
SME OTHER
1.2.4 Participation by country
For analytical and comparative purposes participating countries are conventionally grouped in this section in four groups, namely EU member states, candidate and associated countries, third countries with S&T agreements, and other third countries. It should be emphasised that these groups are largely heterogeneous in terms of the socio-economic characteristics and the scientific and technological capacities of their members, as well as in terms of their FP7 participation levels and performance.
For detailed statistical figures on participation by country or group of countries see table B3 in annex B.
Figure 12: Numbers of applicants and amounts of requested Community financial contribution (in € million) in retained proposals for FP7 calls concluded in 2007, 2008 and 2009 by country group.
0 5.000 10.000 15.000 20.000 25.000
2007 2008 2009
APPLICANTS
3RD (OTHER)
3RD (S&T AGREEMENT) CANDIDATE & ASSOCIATED EU27
0,0 1.000,0 2.000,0 3.000,0 4.000,0 5.000,0 6.000,0 7.000,0
2007 2008 2009
EC CONTRIBUTION (€M)
3RD (OTHER)
1.2.4.1 EU member states
[image:25.595.78.524.144.629.2]The following graphs present various aspects of the EU member states participation patterns during the first three years of implementation of FP7, as well as the aggregate picture.
Figure 13: Numbers of EU27 applicants and requested Community financial contribution (in € million) in retained proposals for FP7 calls concluded in 2007, 2008 and 2009 by EU member state.
0 1.000 2.000 3.000 4.000 5.000 6.000 7.000
LU MT LV LT CY SK EE BG SI RO CZ HU IE PT PL DK FI AT EL SE BE NL ES IT FR UK DE
APPLICANTS
2009 2008 2007
0,0 500,0 1.000,0 1.500,0 2.000,0 2.500,0 3.000,0
MT LU LV LT CY SK EE BG SI RO CZ HU PT PL IE DK AT FI EL SE BE ES NL IT FR UK DE
EC CONTRIBUTION (€M)
Figure 14: Success rates of EU27 applicants and requested Community financial contribution for FP7 calls concluded in 2007, 2008 and 2009 by EU member state.
0,0% 5,0% 10,0% 15,0% 20,0% 25,0% 30,0% 35,0%
BE NL FR DK SE UK IE EE DE FI LV AT CZ ES LT SK PT HU LU IT PL MT CY EL BG SI RO
APPLICANTS' SUCCESS RATES
2007-2009 2009 2008 2007
0,0% 5,0% 10,0% 15,0% 20,0% 25,0% 30,0%
FR BE NL DK DE FI UK SE AT EE IE ES LT CZ IT PT PL EL HU LV SK SI BG CY MT LU RO
EC CONTRIBUTION SUCCESS RATES
2007-2009 2009 2008 2007
Figure 15: Requested Community financial contribution per applicant (in € thousand) in retained proposals for FP7 calls
concluded in 2007, 2008 and 2009 by EU member state.
0,0 50,0 100,0 150,0 200,0 250,0 300,0 350,0 400,0 450,0 500,0
DE FI NL FR DK SE UK AT BE IT EL ES IE PT PL LU EE CZ SI HU CY LT BG RO SK LV MT
EC CONTRIBUTION PER APPLICANT (€K)
[image:26.595.75.525.564.781.2]1.2.4.2 Candidate and associated countries
Candidate and associated Countries constitute a heterogeneous group,5 which in 2009 accounted for 8,3% of total applicants in retained proposals and 9,9% of requested Community financial contribution with success rates 23,6% and 18,7% respectively.
[image:27.595.75.522.208.673.2]Figures 16, 17 and 18 present the situation in terms of numbers of applicants and requested Community contribution, success rates, and Community contribution per applicant in candidate and associated countries in the years 2007, 2008 and 2009.
Figure 16: Numbers of applicants and requested Community financial contribution (in € million) in retained proposals for FP7
calls concluded in 2007, 2008 and 2009 for candidate and associated countries.
0 200 400 600 800 1.000 1.200 1.400 1.600 1.800
LI BA AL ME MK IS RS HR TR IL NO CH
APPLICANTS
2009 2008 2007
0,0 100,0 200,0 300,0 400,0 500,0 600,0 700,0
BA AL LI ME MK IS HR RS TR IL NO CH
EC CONTRIBUTION (€M)
2009 2008 2007
5
Figure 17: Success rates of applicants and requested Community financial contribution for FP7 calls concluded in 2007, 2008 and 2009 for candidate and associated countries.
0,0% 5,0% 10,0% 15,0% 20,0% 25,0% 30,0% 35,0%
CH NO IS IL ME MK HR TR AL RS LI BA
APPLICANTS' SUCCESS RATES
2007-2009 2009 2008 2007
0,0% 5,0% 10,0% 15,0% 20,0% 25,0% 30,0%
CH NO LI IS IL ME MK HR RS AL TR BA
EC CONTRIBUTION SUCCESS RATES
2007-2009 2009 2008 2007
Figure 18: Requested Community financial contribution per applicant (in € thousand) in retained proposals for FP7 calls
concluded in 2007, 2008 and 2009 for candidate and associated countries.
0,0 100,0 200,0 300,0 400,0 500,0 600,0
CH IL LI NO RS IS HR MK TR ME BA AL
EC CONTRIBUTION PER APPLICANT (€K)
2007-2009 2009 2008 2007
1.2.4.3 Third countries
average success rate of 27,6% for applicants and of 16,8% for requested financial contribution.
The sub-group of third countries with S&T agreements, which now consists of 19 members,6 accounted in 2009 for 80% of the total number of third country applicants and for 70,4% of the total requested Community contribution to third countries in retained proposals, with success rates of 28,4% and 16,1% respectively.
The 10 biggest third country participants in 2009 in terms of numbers of successful applicants have been the USA, China, Brazil, Russia, Australia, Mexico, India, South Africa, Canada, and Argentina (in descending order). In terms of Community financial contribution the 10 biggest beneficiaries (in descending order) have been Russia, USA, China, Brazil, India, South Africa, Tunisia, Morocco, Egypt, and Mexico. All of these countries have S&T agreements with the EU.
Figures 19, 20 and 21 below present the situation of the 19 third countries with S&T agreements in terms of numbers of applicants and requested Community financial contribution (in € million) in retained proposals, the corresponding success rates and the Community financial contribution per applicant (in € thousand).
6
Figure 19: Numbers of applicants and requested Community financial contribution (in € million) in retained proposals for FP7 calls concluded in 2007, 2008 and 2009 for third countries with S&T agreements.
0 100 200 300 400 500 600 700
J O KR T N C L N Z J P E G M A M X A R UA C A Z A A U B R IN C N R U US
APPLICANTS
2009 2008 2007
0,00 5,00 10,00 15,00 20,00 25,00 30,00 35,00 40,00
J O N Z KR C L J P E G A U C A M X T N M A A R UA Z A B R C N IN US R U
EC CONTRIBUTION (€M)
Figure 20: Success rates of applicants and requested Community financial contribution for FP7 calls concluded in 2007, 2008 and 2009 for third countries with S&T agreements.
0,0% 5,0% 10,0% 15,0% 20,0% 25,0% 30,0% 35,0% 40,0% 45,0% 50,0%
NZ AU KR US CA JP ZA AR MX CL IN BR CN MA RU UA JO TN EG
APPLICANTS' SUCCESS RATES
2007-2009 2009 2008 2007
0,0% 5,0% 10,0% 15,0% 20,0% 25,0% 30,0% 35,0% 40,0% 45,0% 50,0%
KR AU JP NZ US CA ZA IN AR RU CN MA BR TN UA CL MX JO EG
EC CONTRIBUTION SUCCESS RATES
[image:31.595.75.521.77.397.2]2007-2009 2009 2008 2007
Figure 21: Requested Community financial contribution per applicant (in € thousand) in retained proposals for FP7 calls
concluded in 2007, 2008 and 2009 for third countries with S&T agreements.
0,0 20,0 40,0 60,0 80,0 100,0 120,0 140,0 160,0
RU IN ZA TN BR CN MA AR UA JO EG KR CL JP MX US NZ CA AU
EC CONTRIBUTION PER APPLICANT (€K)
2007-2009 2009 2008 2007
1.3 Gender equality and FP7
In 1999, early in FP5, the Commission adopted a Communication in which it undertook the commitment to develop a coherent approach towards promoting women in research financed by the European Communities.7 The Commission's stated aim was to achieve at least a 40%
7
representation of women in Marie Curie scholarships, Advisory Groups, Assessment Panels and Monitoring Panels of FP5. This target was subsequently expanded to include all groups, panels, committees and projects involved in the Framework Programmes. The 40% target remained in place for FP6 and is currently also valid for FP7.
1.3.1 Patterns of women participation as contact persons in FP7 projects
The CORDA database contains data on individuals with assigned contact person roles for each of the organisations which participate in FP7 funded projects, for which grant agreements have already been signed. This data includes gender identity. Data of this type in the thematic area Information and Communication Technologies are not included in the CORDA database.8
At the moment of data extraction the database contained an estimated total of 122.129 individual project participants with assigned contact person roles whose gender identity has been registered in the database, of which 31.165 or 25,5% were women. Of all individuals having a contact person role in coordinating organisations, 29,4% (7.277) are women; in participating (non-coordinating) organisations the corresponding share of women is 24,5% (23.888).
About a fifth (20,5%) of all individuals characterised as contact person for scientific aspects in signed grant agreements are women. Women represent more than a third (36,1%) of individuals in the category fellow, which corresponds to the specific programme People (Marie Curie Actions), and about a fifth (19,4%) of individuals in the category principal investigator, which corresponds to lead scientists in ERC grant agreements (specific programme Ideas).
Tables 2 below and B6 in annex B present a detailed breakdown of this data.
Table 2: Participation of women in FP7 funded projects in signed grant agreements as percentage of total number of
participants by individual role and role of participant organisation in the project.
ROLE COORDINATOR PARTICIPANT ALL
Contact person 40,4% 33,7% 34,9%
Contact person for scientific aspects 19,5% 20,6% 20,5%
Principal investigator - - 19,4%
Fellow - - 36,1%
Contact person for legal aspects 45,2% 39,1% 40,4%
First administrative officer 18,8% 14,1% 14,9%
Secondary administrative officer 27,6% 22,9% 23,8%
Total 29,4% 24,5% 25,5%
Figures 22 and 23 present the participation shares of women in contact person roles in FP7 funded projects (in signed grant agreements from 2007 to 2009) by country of origin of the participating organisation for the group of EU member states.
8
Figure 22: Participation share of women in contact person roles in FP7 signed grant agreements by country in EU27. 0,0% 5,0% 10,0% 15,0% 20,0% 25,0% 30,0% 35,0% 40,0%
LV FI BG RO PL SI UK LT EE HU IE FR SE MT BE ES EL DK DE PT SK IT AT LU CZ CY NL
EU
2
7
WOMEN AS CP
Figure 23: Participation share of women in contact person for scientific aspects, fellow and principal investigator roles in FP7 signed grant agreements by country in EU27.
0,0% 10,0% 20,0% 30,0% 40,0% 50,0% 60,0% 70,0%
BG MT RO LV SI EE LT PT PL HU FI SK ES BE SE LU FR IE IT CY AT DK CZ UK EL NL DE EU27
WOMEN AS CP FOR SCIENTIFIC ASPECTS
COOPERATION CAPACITIES PEOPLE
0,0% 10,0% 20,0% 30,0% 40,0% 50,0% 60,0%
SE BG DK IT PL PT NL FR UK ES BE EE FI SI DE IE EL AT HU SK RO CZ CY LT LU LV MT EU27
WOMEN AS RESEARCHERS
Figure 24 presents the participation share of women in contact person roles in FP7 funded projects (in signed grant agreements from 2007 to 2009) by thematic area. It is interesting to observe the considerable variation of female participation shares among different thematic areas, which ranges from more than a third of the total in areas like Science in Society, Support for the coherent development of research policies, and Socio-economic sciences and Humanities, to less than a fifth in Euratom activities, Nanosciences, Nanotechnologies, Materials and new Production Technologies, Energy, Space and Transport.
Figure 24: Participation share of women in contact person and contact person for scientific aspects roles in FP7 signed grant agreements by thematic area.
0,0% 5,0% 10,0% 15,0% 20,0% 25,0% 30,0% 35,0% 40,0% 45,0% 50,0%
Transport Space Energy SMEs Security Fusion JTIs Nanotech Infrastructures Fission Marie Curie ERC Environm ent Potential Food Regions Health INCO SSH Policies Society General
WOMEN IN CONTACT PERSON ROLES
Contact Person Contact Person for Scientific Aspects
1.3.2 Women participation in FP7 advisory groups, panels and committees
Following a reduction of the number of the initially 16 Advisory Groups and a membership renewal in most groups in 2008, the percentage of women in the 11 Advisory Groups managed by DG RTD increased to 38,5%. These numbers are still below the 40% target, but they show an improvement in comparison to previous years. However, the percentage of women in all FP7 Advisory Groups, including those managed by other DGs, was 32,7% at the end of 2009, and hence slightly lower than in previous years.
The percentage of female members of FP7 Programme Committees in 2009 was 35%. In the same year female members of the ERC Scientific Council represented 27% of the total. The corresponding figure for the European Research Area Board (ERAB) – the consultative body responsible for advising the EU on the realisation of the ERA – was 40,9%, which is higher than the respective figure (33% until 2006) for the European Advisory Board (EURAB) – the high level advisory board established for FP6.
[image:35.595.74.522.304.558.2]Figure 25 below presents in more detail the shares of women participation in groups, panels and committees from FP4 to FP7 (1998-2009).
Figure 25: Participation share of women in advisory groups, panels and committees (FP4, FP5, FP6, FP7).
0,0% 5,0% 10,0% 15,0% 20,0% 25,0% 30,0% 35,0% 40,0% 45,0%
Evaluation Panels Expert Databases Advisory Groups Program m e Com m ittees
ERC Scientific Council
EURAB / ERAB
1998 1999 2000 2001 2002 2003 2004 2005 2006 2007 2008 2009
1.4 Quality assessment of proposal evaluation
Table 3: Key figures of evaluators' survey 2009.
EVALUATORS' SURVEY 2007 2008 2009
Experts invited to participate 3.630 3.492 4.612
Responses received 2.281 1.682 2.373
Respondents finding the quality of the evaluation overall satisfactory to excellent 96,1% 97,6% 97,6%
Respondents rating the quality of the evaluation overall excellent 22,1% 26,5% 29%
Respondents, having previously evaluated research proposals for national or
international research funding schemes, finding the EU evaluation process better
or much better
52,6% 61,3% 61,0%
The results demonstrate that the high quality of the evaluations has been maintained. Evaluators were very satisfied with the way in which the evaluations were conducted with respect to impartiality, confidentiality and fairness. In particular the level of efficiency of the evaluation task has been rated as excellent, good or satisfactory by 96,6% of the respondents. There are a number of results pointing to issues for attention:
Available time: Still a large majority of the respondents (79%) believe there was sufficient time for the reading and the individual evaluation of proposals. However, similarly to previous years, a significant minority of the experts (18,5%) thought they had too little or totally insufficient time for this part of the evaluation, which is slightly more than what was recorded in 2007 and 2008.
Evaluation criteria: A frequently recurrent comment is that more weight should be given to the S/T quality criterion compared to the other two criteria. The 'impact' criterion is still found to be the most difficult to apply. Among experts evaluating Collaborative Projects, 47% thought this was the most difficult to apply, which represents an increase compared to previous years (2007: 31%; 2008: 43%).
Conflicts of interest: 25% of the evaluators answered 'yes' when asked if they were aware of any possible conflicts of interest. However, as in previous years, an overwhelming majority of these, 92% (same as in 2008) believed that these possible conflicts of interest were thought to be handled correctly.
Logistical aspects: There has been a continuous improvement of the logistical aspects over the years. An overwhelming majority of the experts (97%) rated the overall organisation of the evaluation positively. A significant part of these respondents (47%) rated it as 'excellent' (2008: 43,9%; 2007: 29,9 %).
1.5 Redress procedure
The FP7 rules for participation stipulate that the Commission shall provide a redress procedure for applicants. The intention of the legislator was to formalise the ad hoc approaches for dealing with complaints that existed in previous programmes.
In line with these requirements, a redress procedure has been set up that aims to be both efficient and consistent with the principles of transparency and equal treatment that underpin all Commission evaluations.
Following the work of the "submission to ranking" working group, redress guidelines were drafted, setting out the more operational aspects of the new procedure. In particular:
The configurations work independently, and deliver their advice to the responsible directors. They may take account of possible comments from the director, and from the redress office (see below).
A redress office (RO), located in unit RTD A1, is responsible for registering and tracking redress requests, supporting the committee configurations, and ensuring that policy is coherent and consistent over time, based on case histories.
These guidelines have since been endorsed by the Legal Service, and some of the most salient guidelines have been incorporated into the evaluation rules.9
Table 4 presents the results of the redress procedure for FP7 calls launched in 2007-2009 (except ERC calls).
Table 4: Key figures for redress procedure in 2007-2009.
REDRESS PROCEDURE 2007 2008 2009 2007-2009
Proposals received 17.418 9.962 11.528 38.908
Redress requests received 772 398 431 1.601
Redress cases upheld but not leading to re-evaluation* 41 25 1 67
Redress cases leading to re-evaluation 8 9 2 19
Redress cases leading to re-evaluation (% of proposals received) 0,046% 0,090% 0,017% 0,049%
* Due to the fact that the proposal failed anyway for other reasons or because the identified problem was minor and not crucial to the experts' evaluation.
Problems leading to a re-evaluation were, for example, related to the eligibility of proposals (scope, number of participants), or to serious factual errors, or to insufficient specialist expertise on the part of the experts.
In 2007, the ERC put in place redress procedures, following the model established for FP7, but with a separate Ideas configuration of the redress committee. The ERC now has its own formal procedure, including its own redress committee and guidelines. Information on 2007-2009 cases can be found in section 2.1.1.
1.6 The FP7 ethics framework - ethics reviews and ethics audits
The Commission has included in FP7 procedures a thorough ethics review process for all proposals that raise ethical questions and are likely to receive Community funding. The ethics review process safeguards the protection of fundamental rights and the respect of ethical principles. It guarantees that no funding is allocated to research that does not comply with the relevant EU and national legislation and the ethical considerations specified in the Framework Programme. The ethics review process is described in detail in annex A (Ethical Review Procedures) of the "Rules for submission of proposals, and the related evaluation, selection and award procedures" (Version 3, 21 August 2008, COM (2008)4617).
1.6.1 Ethics review process
All proposals that are selected for funding and raise ethical issues undergo an ethics review by independent experts in research ethics coming from a variety of scientific disciplines. The
9
ethics review process is split in two phases: the ethics screening and the ethics review. The ethics screening had been introduced in order to facilitate the selection of projects that required ethics review at the EC level versus projects that can be implemented following only national approvals and ethics committee opinions. The screening is the responsibility of the programmes that receive the applications and similarly to the ethics review is carried out by independent experts.
Research proposals involving interventions on human beings (such as surgical interventions, clinical trials etc.), non-human primates, or human embryos/embryonic stem cells are automatically referred for ethics review at EC level. In addition to the three mandatory categories mentioned above particular attention is paid to research involving children, research undertaken in developing countries, and security-related research.
The ethics review is the responsibility of the Ethics Review Sector of DG RTD, which also coordinates the methodological and implementation aspects of the screening phase.
The organisation of the ethics review process involves the appointment of the members of the ethics review panels and the procedural coordination of the entire evaluation process. The requirements put forward by the ethics review experts become contractual obligations and are part of the terms of the FP7 grant agreement between the Commission and the researchers.
1.6.2 Ethics audit
Proposals that undergo an ethics screening and an ethics review can be flagged by the reviewers as requiring an ethics audit. The objective of the audit procedure is to assist the researchers to deal with the ethics issues that are raised by their work and if necessary take corrective measures.
1.6.3 Impact assessment procedure
In 2010, the Ethics Review Sector of DG RTD will organise specialised workshops and undertake all necessary activities and initiatives so as to assess the impact of the ethics review and audit procedures upon the FP7 scientific community, the host institution structures and the competent national authorities and relevant ethics committees. Selected FP7 projects might be asked to participate on a voluntary basis. The objective of this procedure is to improve the ethics review process, maximise the positive impact of the FP7 ethics framework on the research community and contribute to the positive societal image of research.
1.6.4 Ethics review helpdesk
All FP7 funded projects can request specific assistance on ethics issues from the Ethics Review Helpdesk, accessible through the "get support function" of the CORDIS site.
Table 5: Key figures for ethics reviews in 2007-2009.
ETHICS REVIEWS 2007 2008 2009 2007 - 2009
Number of ethics reviews organised 245 294 232 771
Projects stopped as a result of the ethics review 0 0 0 0
Project proposals found to have insufficient safeguards in place, requested to modify project following contractually binding requirements
44 82 122 248
Proposals flagged for ethics audit N/A* 7 12 19
Experts having participated in ethics review process 79 95 103 277
* Ethics audits represent a rather recent addition to the FP7 ethics framework.
The project proposals that were reviewed cover a broad variety of issues under different thematic areas and specific programmes. In 2009 People is the area with the highest number of ethics reviews, which is due to the higher number of applications for funding received by this programme, followed by the ERC, Health and Food themes. Table 9 provides more details.
Table 6: Ethics reviews by FP7 thematic area in 2009.
ETHICS REVIEWS IN 2009 BY FP7 THEMATIC AREAS
Environment
Food, Agriculture and Fisheries, Biotechnology
Health
ICT (Information and Communication Technologies)
Nanosciences, Nanotechnologies, Materials and new Production Technologies
Security
SMEs (Small and medium enterprises)
Transport
Ideas (ERC)
People (Marie Curie Actions)
4 35 39 21 13 11 4 4 48 52
Total 232
1.7 Dissemination activities
1.7.1 Internet
The European Commission Research web site on EUROPA provides up-to-date information on the latest decisions and latest advances in European Research. According to DIGIT/DG COMM statistics, the entire research web site on EUROPA, including pages of historical interest (e.g. FP5, FP4), currently has over 50.000 pages. It should be noted however, that there is some undercounting due to various reasons (e.g. to counting dynamic sites where parameters determine the page content as one page). Key figures for 2009, compared to 2008 and 2007 are shown below.
Table 7: EUROPA usage statistics (DIGIT/DG COMM statistics).
EUROPA USAGE 2007 2008 2009
Visits per year (total) 7,5 million 8,5 million 6,9 million
Page views (total) 16,65 million 16,2 million 21 million