A NUMERICAL AND EXPERIMENTAL ANALYSIS OF FLOW IN A CENTRIFUGAL
PUMP
M T Stickland, T J Scanlon
University of Strathclyde, Department of Mechanical Engineering Glasgow, G1 1XJ Scotland
J Fernández
Universidad de Extremadura, Dpto. de Electrónica e Ingeniería Electromecánica Avda. de Elvas s/n. 06071 Badajoz, Spain
E Blanco, J Parrondo
Universidad de Oviedo, Área de Mecánica de Fluidos Campus de Viesques, 33271-Gijón (Asturias), Spain
ABSTRACT
This paper describes the use of a rotating all mirror image derotator system in collaboration with Particle Image Velocimetry (PIV) to visualise and quantitatively examine the flow patterns between the blades of a centrifugal impeller. The authors have been able to obtain the relative velocities in a centrifugal impeller at rotational speeds between 300 and 600 revs per minute with water flow rates between 450 and 900 litres per hour. Velocity contours and vector maps of the relative flow field within a blade passage are presented for an impeller speed of 350 rpm and a flow rate of 510 l/h. The data are compared with the results of a computational fluid dynamics (CFD) model.
INTRODUCTION
Flow in centrifugal pumps is a complex three-dimensional phenomenon involving features such as turbulence, secondary flows, unsteadiness, etc. In addition, the geometry is often complex and asymmetric thus the relative movement between impeller and volute generates an unsteady interaction which may affect, not only the overall pump characteristics, but can also be responsible for pressure fluctuations. Such pressure fluctuations may interact with the flow circuit and generate transient forces over the mechanical parts, Adkins & Brennen (1988). This is recognised as one of the most important sources of vibration and hydraulic noise, Dong et al. (1997).
The numerical simulation of centrifugal pumps contains the usual CFD problems; turbulence, separation, boundary layers, etc. Specific problems are also evident:
- Complex geometry: a great number of cells are needed and, due to skewness, usually unstructured grids give better convergence than structured ones.
- Energy transfer: generated mainly by the centrifugal forces in the impeller. A cascade simulation is not valid and these force source terms must be included in the equations of the moving zone.
- The interaction between impeller and volute requires an unsteady solution process to calculate the time derivatives of the equations. Also, the blade position with respect to the volute tongue must be taken into account. This can be partially accomplished in a quasi-steady way: recalculating the solution with different grid positions. But it is desirable that the code can perform an unsteady calculation at the same time that the impeller slides along the grid at each time step.
CFD has proved to be a very useful tool in the analysis of such turbomachinery, both in design and performance prediction. Much research has been carried out in this field. Croba & Kueny, (1996) give a list of selected papers up to that date. Denus & Göde (1999) give a more extended and up to date bibliography, but is not as specific in nature. However, due to the difficulties of the task, most of the studies begin by performing gross simplifications of the problem either in the geometry or in the flow characteristics. Research appears slowly to be tending towards a more complete simulation.
CFD MODEL
The numerical simulations contained in this paper have been carried out with the commercial software package FLUENT 5. This code uses the finite volume method and solves the 3-D Navier-Stokes equations. It has the ability to handle unstructured grids, include relative reference frames and make transient calculations with moving meshes.
For the flow calculation itself the pressure-velocity coupling is based on the well-known SIMPLE algorithm. The standard form of the k-
ε
model has been applied for turbulence closure. Spatial resolution for the convection terms for momentum is based on second order upwinding while the temporal resolution is fully implicit with a time step size of 1.96x10⁻³ s applied.The number of iterations has been adjusted to reduce the residual below an acceptable value in each time step. In particular, the ratio between the sum of the residuals and the sum of the fluxes for a given variable in all the cells is reduced to the value of 10-5 (five orders of magnitude). Initialising the unsteady calculation with the steady solution, over 7 impeller revolutions are necessary to achieve the periodic unsteady solution convergence.
Intensive grid size dependence tests were carried out with several grid spacing and the overall performance of the pump was the same, even with less than a half of the cells finally used for the computations (the variations observed in flow rate, head and efficiency were kept under very reasonable values, 1%, 0.5% and 1.2%, respectively). Although the static values change in that range, more detailed flow patterns, especially near the walls, could be observed with increasing cell numbers. The numerical accuracy for the pressure fluctuations was estimated to be 0.001 (non-dimensional values, that is pA divided by
2 2
U
2
1
ρ
). More informationcan be read in Fernández, (1998). IMAGE DEROTATION
[image:2.595.309.560.110.297.2]An image rotator consists of prisms or their mirror equivalents, Swift (1972). A stationary object observed, in transmission or reflection, from such a device will appear to rotate twice for each revolution of the rotator. Figure 1 illustrates the effect of observing a stationary object through a pair of mirrors, placed at right angles to each other, as the optics are rotated. Used in such a manner this device, called
Figure 1Image de-rotation
an image rotator, was used, amongst other things, in microfiche readers. Thus allowing the stationary observer to rotate the image of the document. An image derotator is the same device but now caused to rotate at exactly half the speed of the observed, rotating, component. The phenomenon of image derotation is now observed. A continuously stationary image of the rotating component will be seen, when observed through the mirrors, provided the derotator’s optics rotational axis and the rotational axis of the component are correctly aligned, Sullivan (1972).
The image de-rotator described above has been used to map the instantaneous velocity distribution in the casing of a centrifugal impeller by the whole field velocity measurement technique Particle Image Velocimetry (PIV). For a general overview of the technique the reader is recommended the review paper by Grant (1997). A more detailed approach to the technique is given in the book by Raffel et al (1998).
Shepherd et al (1993) employed PIV to map the flow field in a centrifugal fan and, from the flow field measured, calculated the vorticity distribution within the flow to examine the structure of the relative flows within the impeller which are the source of acoustic noise. This was necessary due to the stationary viewpoint taken by most PIV investigations i.e. the viewer has a stationary frame of reference with respect to the moving flow. This by its nature hides the relative flow structure, vortices, turbulence etc. within the dominant primary flow. An alternative is to take a relative viewpoint where the frame of reference moves with the primary flow. Analysis by this method will reveal relative flows by removing the primary flow. It is possible to transform from a stationary point of view to a relative view by manually subtracting the primary flow velocity from each vector. This, of course, assumes the primary flow field is known at all points within the flow field and restricts this technique to simple, well defined, flows.
90 degrees
45 degrees
180 degrees
90 degrees
Object Image
The image de-rotator allows the frame of reference of the PIV imaging system to move with the rotating flow and hence produce an image of the entire flow field, as if the camera was rotating at the same speed as the impeller, and hence reveal the structure of the relative flows hidden by the dominant primary flow field.
Stickland et al (1996) in their paper describe mapping the flow field in a mixed flow impeller by PIV and image de-rotation. However, the images analysed for this paper were acquired by wet film high-speed cine. The images were then projected and digitised by a CCD camera attached to a frame grabber in a PC and analysed by autocorrelation. The process was time consuming and tedious. This paper describes the use of a high-speed digital video with direct, digital, download to a PC for cross correlation analysis. The process was much more efficient and allowed the production of vector maps within minutes rather than the days previously required. The data generated by this technique was then compared with the output of the computational model.
EXPERIMENTAL EQUIPMENT
[image:3.595.325.538.106.292.2]Annotated photographs of the centrifugal pump and optics are shown in figure 2.
Figure 2 Photograph of experimental rig
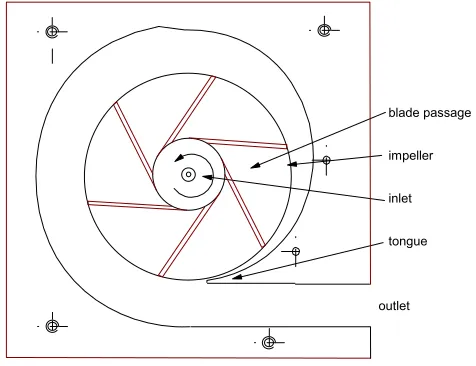
The pump impeller, figure 3, has a diameter of 136mm and has 6 straight arms extending to the rim. The eye of the impeller is 46mm in diameter. The design conditions for this impeller are 600 rpm with a flow rate of 2731 litres per hour. The impeller and housing, figure 4, are machined from acrylic and are highly polished to give optical access.
[image:3.595.319.557.342.525.2]The image de-rotator consists of two, optically flat, four inch by two inch, front silvered, mirrors formed in a V groove. The angle between the mirrors is 90o± 1′. The mirror assembly is mounted on a shaft connected to a DC servo motor. The DC servo motor is controlled by a McLennan
Figure 3 Pump impeller
[image:3.595.65.270.386.557.2]servo gearbox slaved to a rotational position encoder connected to the motor shaft driving the pump impeller.
Figure 4 Impeller and housing
The Servo gearbox synchronises the rotation of the impeller and the derotator with the de-rotator running at half the speed of the impeller. The Impeller is viewed through a 25mm diameter mirror placed at 45o to the centreline. A schematic diagram of the experimental rig is shown in figure 5.
The images of the flow field are captured by a Photron Fastcam super 10KC. The Fastcam is a high speed digital video capable of capturing up to 10k images per second. The images were down loaded directly to a PC via a SCSI 2 link in .bmp format. The camera was fitted with a 25mm f1.4 lens.
Illumination was by a 5W Spectra Physics Argon Ion laser. The light was fed to the test rig via a fibre optic cable with approximately 4W available at the end of the fibre. A shutter mechanically connected to the interlock system on the
camera
derotator impeller
inlet
outlet mirror
motor
All dimensions in mm Material: perspex or acrylic not drawn to scale 15
3 3
4 136 1.5o
46O 2
outlet tongue impeller blade passage
Figure 5 Schematic of experimental rig
laboratory doors was placed in the beam path for safety. When any interlock was broken by the opening of the door the laser beam was isolated from accidental viewing. The beam was focused into the test section by an f300 bi-convex lens and spread into a sheet by an f12.7 planar convex cylindrical lens.
Water was used as the working fluid and was seeded with spherical particles of approximately 50µm diameter. The pump was included in a closed circuit feeding a header tank via 1” diameter flexible hoses. Flow rate was measured by a rotameter capable of measuring a maximum flow rate of 1780.5 litres per hour. The impeller was powered by an AC motor and controlled with a 13A Variac
Sequential images, downloaded from the Fastcam, were analysed by cross correlation using Flowmanager analysis software from Dantec
RESULTS AND DISCUSSION
The results shown in this paper are from a series of tests undertaken with impeller speeds from 300 to 550 revs per minute and flow rates between 450 litres per hour and 900 litres per hour.
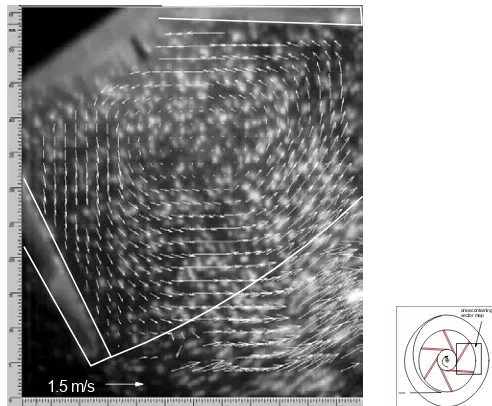
Images were acquired at 1000 frames per second with an exposure time of 0.001s. Sequential images, 0.001 seconds apart, were cross correlated. Vector maps, are shown from a plane through the centreline of the impeller at positions corresponding to 135o and 270o as shown in small diagram on each figure.
The PIV images were taken at an impeller speed of 350rpm with a flow rate of 516 l/h (1.43x10⁻⁴ kg/s) and were therefore well away from the design condition of the impeller. From figure 6 it may be seen that the primary flow has been completely removed and only the relative flow, is evident. The impeller is rotating in a clockwise direction. This figure shows the velocity vectors in a blade passage at a
[image:4.595.55.293.98.285.2]position of 270o. It may be seen that the computational data, figure 7, and experimental data agree reasonably well
Figure 6 PIV magnitude of velocity, 270o Figure 7 CFD magnitude of velocity, 270o
quantitatively with the same magnitude evident. There is a slightly higher velocity found in the computational data next to the pressure side of the leading blade.
It may be seen in figures 8 and 9 that there also exists good agreement between the CFD and experimental data in the highly complex flow as the impeller blades pass the volute tongue.
image derotator mirror
f300 bi convex lens f12.7 planar convex lens
motor encoder
camera
interlocked shutter
mirrored faces
bearing shaft mirror
fibre optic collimating optic
light sheet impeller shaft
impeller housing
DC servo motor
Servo gearbox
5
W
Ar
g
o
n
i
o
n
l
a
s
e
r
Kodak 10KC high speed digital video
SCSI 2link
optical path
area containing vector map
[image:4.595.317.556.329.504.2]Figure 8 PIV magnitude of velocity, 135o
Figure 9 CFD magnitude of velocity, 135o CONCLUSIONS
An all mirror image derotator, high speed digital video and PIV have been successfully used, for the first time, to study, quantitatively, the relative flow patterns within the blade
passage of a centrifugal impeller. The data acquired agrees reasonably well with the data generated by a CFD simulation of the pump. In the future the authors intend to extend this work to look at higher flow rates and rotational speeds and to look at the flows within different configurations of impellers.
REFERENCES
Adkins, D.R. and Brennen, C.E., 1988, “Analysis of Hydrodynamic Radial Forces on Centrifugal Pump Impellers”, ASME Journal of Fluids Engineering, Vol. 110, pp.20-28. Croba, D. and Kueny, J.L., 1996, “Numerical Calculation of 2D, Unsteady Flow in Centrifugal Pumps: Impeller and Volute Interaction”, International Journal for Numerical Methods in Fluids, Vol. 22, pp. 467-481.
Denus, C.K. and Göde, E., 1999 “A Study in Design and CFD Analysis of a Mixed-Flow Pump Impeller”, ASME-FEDSM-99-6858.
Dong, R., Chu, S. and Katz, J., 1997, “Effect of Modification to Tongue and Impeller Geometry on Unsteady Flow, Pressure Fluctuations and Noise in a Centrifugal Pump”, ASME Journal of Turbomachinery, Vol. 119, pp. 506-515.
Fernández, J. and Santolaria, C., 1993, “Esfuerzos de origen fluidodinamico en una bomba centrífuga con rodete recortado”, Actas del I Congreso Iberoamericano de Ingeniería Mecánica, Madrid, Spain, Vol. 2, pp. 187-193.
Fernández, J et al, 1998, “Modelización numérica del flujo en una bomba centrífuga con acoplamiento entre el rodete y la voluta”, Anales de Ingeniería Mecánica, Vol.2 , Nº 12, ISSN: 0212-5072.
Grant, I., 1997, “Particle Image Velocimetry: A review”. Proceedings of the IMechE Part C - Journal of Mechanical Engineering Science, Vol. 211, Part 1, pp 55 – 76
Longatte, F. and Kueny, J.L., 1999, “Analysis of Rotor-Stator-Circuit Interactions in a Centrifugal Pump”, ASME-FEDSM-99-6866.
Raffel, M. Willert, C. Kompenhans, J., 1998, “Particle Image Velocimetry: A Practical Guide”, Springer, ISBN 3-540-63683-8
Sullivan, D.L. 1972, “Alignment of rotational prisms” , Applied Optics, II, No. 9 pp 2028-2032, September.
Shepherd, I.C., Lafontaine, R.F., 1993, “Mapping the velocity field in a centrifugal fan using particle image velocimetry,” Journal of Wind Engineering and Industrial Aerodynamics, 50 373-382
[image:5.595.45.285.431.653.2]