Int. J. Electrochem. Sci., 13 (2018) 2102 – 2117, doi: 10.20964/2018.02.71
International Journal of
ELECTROCHEMICAL
SCIENCE
www.electrochemsci.org
Corrosion Protection of Copper in Sodium Chloride Solution
using Propolis
Ladislav Vrsalović1,*, Senka Gudić1, David Gracić,1 Ivana Smoljko1, Ivana Ivanić2, Maja Kliškić1, Emeka E. Oguzie3
1
University of Split, Faculty of Chemistry and Technology, Department of Electrochemistry and Materials Protection, Ruđera Boškovića 35, 21000 Split, Croatia
2
University of Zagreb, Faculty of Metallurgy, Aleja narodnih heroja 3, 44103 Sisak, Croatia
3
Federal University of Technology Owerri, Electrochemistry and Materials Science Research Laboratory, Department of Chemistry, Owerri, Nigeria
*
E-mail: ladislav@ktf-split.hr
Received: 18 October 2017 / Accepted: 4 December 2017 / Published: 28 December 2017
In this investigation the possibility of inhibiting corrosion of copper using ethanol extract of propolis in 0.5 mol dm-3 NaCl solution was investigated. The measurements were carried out in 200 cm3 of NaCl solution to which 4 ml of ethanol extract of propolis was added. Also, the protective effect of propolis coating, which was formed by applying the ethanol extract of propolis to the electrode surface, followed by air drying for 24 h, was investigated. Experiments were performed using electrochemical methods: open circuit potential measurements, linear and potentiodynamic polarization method and electrochemical impedance spectroscopy measurements (EIS). The results showed that the coating of propolis significantly shifted the value of the open circuit potential of Cu to more positive values, significantly increased the value of polarization resistance and as well led to a reduction in corrosion current density. On the other hand, addition of propolis in solution yielded minor changes in the value of the stable open circuit potential of copper, but increased the value of polarisation resistance and decreased the corrosion current density. After polarisation measurements, the electrode surface was examined by optical microscopy. Quantum chemical modelling of selected constituents of propolis was undertaken in order to ascertain their contributions to the corrosion inhibition performance.
Keywords: copper; corrosion; corrosion inhibition; electrochemical techniques; propolis
1. INTRODUCTION
corrosion resistance is often insufficient when in a contact with aggressive solutions. Indeed, in some environments containing ions such as chloride, sulphate or nitrate copper, passive film breakdown may occur, leading the propagation of corrosion [1-3].
The use of corrosion inhibitors is one of the most practical methods for protection of metals in aggressive solutions. Corrosion inhibitors are substances that effectively reduce the corrosion rate of a metal exposed to aggressive fluid environments. The environmental restrictions currently in place for corrosion inhibitor formulations have brought a great deal of interest in the use of natural products as corrosion inhibitors [4-10]. Most of the natural products are environmentally acceptable, cost effective and readily available. Our previous studies have shown that natural products, including honey, can be effectively used as corrosion inhibitors for different metals and alloys [11-13].
Propolis is a resinous substance prepared by honeybees from buds, leaves and exudates of trees and plants mixed with pollen, wax and enzymes secreted from the bees [14, 15]. The composition of raw propolis depends on geographical location, as well as nature of plant and bee species and is generally composed of approximately 50% resin (polyphenolic fraction), 30% wax, 10% essential oils, 5% pollen and 5% various organic and inorganic compounds [16]. More than 200 compounds from propolis have been identified and reported in the literature [16-19]. Spectrometric analyses of flavonoids in twenty propolis samples, collected from ten different geographic locations in northern Croatia were done by Kosalec and associates [16]. The results revealed similar contents of flavones and flavonols for most samples and ranged from 2 to 2.3%, while contents of flavanones varied between 15 and 24% and total levels of flavonoids in the majority of propolis samples ranged between 15 and 25.9%. Chemical characterization of Croatian propolis tinctures was undertaken by Medić Šarić, Cvek and co-workers [20-22]. Species identification as accomplished by means of HPLC revealed four phenolic acids (caffeic, p-coumaric, ferulic and isoferulic acids) and ten flavonoids (naringenin, kaempferol, apigenin, rhamnetin, sakuranetin, galangin, chrysin, tectochrysin, pinocembrin and pinocembrin-7-methyl ether) in propolis tinctures. 1H-NMR spectroscopy analysis of propolis extracts revealed phenolic compounds such as caffeic acid, p-coumaric acid, ferulic acid, quercetin, cinnamic acid, apigenin, naringenin, kaempferol, chrysin, pinocembrin, galangin and pinostrobin [14]. According to Cvek [22], the most common compounds in tested Croatian propolis are p-coumaric acid, chrysin and pinocembrin.
A broad range of biological activities, such as, anti-bacterial, anti-inflammatory, anti-cancer and anti-oxidant effects have been attributed to propolis [23-28]. This wide spectrum of healing properties mainly derives from the flavonoid and phenolic acid constituents, which are the major classes of phenolic compounds in propolis [14]. Interestingly, a number of such constituent compounds are even known to possess anticorrosion efficacy, hence it is reasonable to investigate propolis extract for anticorrosion activity.
the chemical structures of some representative constituents of propolis revealed a number of constituents having molecular structures resembling those of conventional corrosion inhibitors. These could be further subjected to computational analysis, to identify some basic quantum chemical descriptors that can be linked with corrosion inhibition performance.
In this research we have focused on the investigation of Croatian propolis as a potential corrosion inhibitor for Cu using combined electrochemical and imaging techniques. We have as well undertaken quantum chemical computations in the framework of the density functional theory, to probe the electronic structure parameters of selected chemical constituents of propolis, as reported by Huang et al. [19] and Cvek [22]. The parameters of interest include the highest occupied molecular orbital (HOMO), lowest unoccupied molecular orbital (LUMO), the HOMO-LUMO energy gap, as well as the total electron density around the molecules. We as well performed molecular dynamics simulations to probe the nature of interactions between the identified major constituents of Croatian propolis [22] and a model Cu surface.
2. EXPERIMENTAL
Copper electrodes were prepared by cutting a copper rod (99.9% purity), obtained from Sigma Aldrich, to yield cylindrical specimens which were soldered on insulated copper wires to ensure good electrical contact and then isolated with Polirepar S protective mass. The bare, non-insulated cylindrical base, with surface area of 0.32 cm2, served as the working electrode surface, in contact with the electrolyte. The surface preparation of the specimens was carried out using emery papers from 400 to 1500 grits, then polishing with the polishing suspension Buehler gamma micro polish II with particle size of 0,05 µm. Polished samples were degreased in ethanol using an ultrasonic cleaner, rinsed with deionized water and immerse in the electrolyte. The main electrolyte was 0.5 mol dm-3 NaCl solution, which was prepared by dissolving the weighed amount of sodium chloride salt (p.a. purity).
Electrochemical measurements were carried out using the EG&G Princeton Applied Research potentiostat/galvanostat (PAR model 273A) and "lock-in" amplifier (PAR model 5210) connected to a personal computer. A three-electrode cell assembly was used with a platinum sheet electrode as counter electrode and a saturated calomel electrode (SCE) as reference electrode. The electrochemical cell was connected to a thermostatic bath to maintain the desired temperature during measurements.
Open circuit potential (EOC) measurements were carried out over 60 min period, with potential
measurement every 30 s.
Linear polarization measurements were obtained by changing the electrode potential automatically from -15 to +15 mV vs. open circuit potential at a scan rate of 0.2 mV s-1.
EIS measurements were carried out with in a frequency range of 50 kHz to 30 mHz with an amplitude perturbation of 10 mV peak to peak using a.c. signals at open circuit potential.
After corrosion testing the surfaces of the investigated samples were photographed using a Canon Ixus 1000 HS digital camera in macro mode, in order to visualize the corrosion damage on the exposed Cu surfaces. A metallurgical microscope (Olympus GX51) was as well used for more in-depth visualization of the corroded surface morphology for unprotected and protected specimens.
Commercial alcoholic extract of propolis, used in these examinations, was prepared by maceration of solid propolis with 70% of ethanol. Investigation of propolis activity on corrosion of copper in NaCl solution was examined by addition of 4 ml of extract in 200 ml of NaCl electrolyte. The protective effect of propolis coating, which were formed by applying alcoholic extract of propolis to the electrode surface and dried in air for 24 h, were also investigated.
Quantum chemical computations to obtain electronic structure parameters of some constituents of propolis as well as molecular dynamics simulations of metal-inhibitor interactions were performed using the density functional theory (DFT) electronic structure programs Forcite and DMol3 as contained in the Materials Studio 7.0 software (BIOVIA Inc.).
3. RESULTS AND DISCUSSION
Figure 1 shows the results of the open circuit potential monitoring for Cu in a 0.5 mol dm-3 NaCl solution, without and with the addition of propolis in solution as well as applied as a coating. 99.9% Cu u 0.5M NaCl otopini bez i s propolisom; mirujuća otopina
t / min
0 10 20 30 40 50 60 70
E
/ V vs. SCE
-0.34 -0.32 -0.30 -0.28 -0.26 -0.24 -0.22 -0.20 -0.18 -0.16 -0.14 -0.12 -0.10
0.5 M NaCl
0.5 M NaCl + 4 ml propolis propolis coating
Figure 1. Open circuit potential measurements for Cu in 0.5 mol dm-3 NaCl solution without and with propolis.
[image:4.596.169.422.405.603.2]
addition of 4 ml of propolis. The propolis coating however completely modified the OCP behavior of the Cu electrode exposed to the NaCl solution, with the coated Cu electrode potential being significantly more positive in relation to the potential of the open circuit potential of Cu in the NaCl solution. This behavior indicates a significant corrosion inhibitory effect of the propolis coating on copper in NaCl solution.
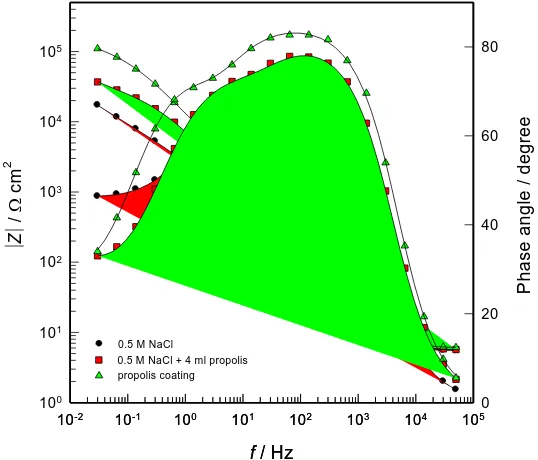
[image:5.596.162.431.405.635.2]Electrochemical impedance spectra were taken after the attainment of a stable open-circuit potential and the results are shown in Figure 2 in the Bode complex plane format. Bode plots are recommended as standard impedance plots, since all experimental impedance data are equally represented and the phase angle as a sensitive parameter to interfacial phenomena appears explicitly [32, 33].
Three distinctive segments can be observed in the Bode plots. The high frequency region (f > 1 kHz) corresponds to the electrolyte resistance with the low values of the |Z| and a phase angle which falls rapidly around 0o. The medium frequency region reflects the capacitive behavior of the system, which is specified with the Bode slope close to –1 and phase angle approaching to 80o. The low frequency region (f < 1 Hz), with Bode slope close to –0.5 and phase angle around 40o indicate the presence of a slow diffusion process. The obtained results are in accordance with the results given in the literature [34-37]. The dissolution of Cu at the open circuit potential in a neutral solution shows typical impedance response with two time constants that describe anodic partial reaction of Cu dissolution and mass transfer through the surface layer of corrosion products [34-36].
f / Hz
10-2 10-1 100 101 102 103 104 105
Z / c m 2 100 101 102 103 104 105
f / Hz
10-2 10-1 100 101 102 103 104 105
P h a s e a n g le / d e g re e 0 20 40 60 80
0.5 M NaCl
0.5 M NaCl + 4 ml propolis propolis coating
Figure 2. Bode plot for Cu in 0.5 mol dm-3 NaCl solution without and with propolis.
Rel
R1 Q2
R2
[image:6.596.186.411.69.167.2]W Q1
Figure 3. Equivalent circuit used for fitting the experimental impedance response.
The obtained results were fitted with the equivalent circuit shown in Fig. 3 in which the resistance of the electrolyte, Rel, is connected serially with two time constants. The high frequency time
constant (Q1R1) is the result of the fast charge transfer process during the Cu dissolution in NaCl
solution: R1 represents the charge transfer resistance, while Q1 replaces the capacitance of the
electrochemical double layer. The time constant in the low frequency region (Q2(R2W)) results from
mass transfer (mainly Cu ions) through the surface film of corrosion products: R2 is the surface film
resistance, Q2 replaces the capacitance of the surface film, and W is the diffusion element.
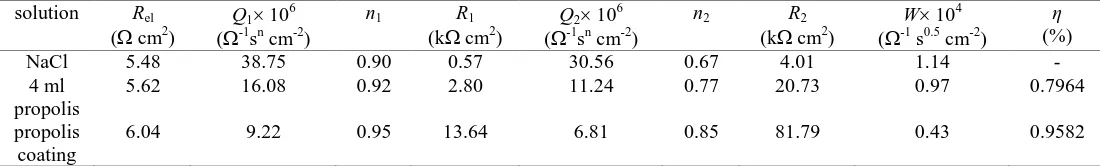
The calculated equivalent circuit parameters are presented in a Table 1.
Table 1. EIS data of the Cu electrode in 0.5 mol dm-3 NaCl solution without and with propolis
solution Rel ( cm2)
Q1 106 (-1sn cm-2)
n1 R1 (k cm2)
Q2 106 (-1sn cm-2)
n2 R2 (k cm2)
W 104 (-1 s0.5 cm-2)
η (%)
NaCl 5.48 38.75 0.90 0.57 30.56 0.67 4.01 1.14 -
4 ml propolis
5.62 16.08 0.92 2.80 11.24 0.77 20.73 0.97 0.7964
propolis coating
6.04 9.22 0.95 13.64 6.81 0.85 81.79 0.43 0.9582
It can be seen that the presence of propolis significantly increased the total impedance of Cu in the NaCl solution. The propolis in a NaCl solution increased the charge transfer resistance (R1) and the
surface layer resistance (R2), which corresponds to an increase in corrosion resistance, while the
capacity of the double layer (Q1), capacity of the surface layer (Q2) and the diffusion element (W)
decreased, which indicates that the Cu surface gets more protection, due to adsorption of some organic constituents of propolis. These changes are even more pronounced with the propolis coating on the Cu surface.
The inhibition efficiency, η of propolis on the corrosion of the copper electrode can be calculated from the charge transfer resistance as follows [40, 41]:
100
1 1 1
R R
R o
(1)
where R1 and R1o represent the charge transfer resistances in the chloride solution in the
[image:6.596.22.572.412.495.2]
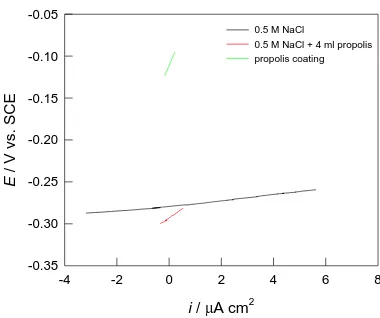
The linear polarization method has been found as a very rapid and convenient method for evaluation of corrosion systems. Since applied potential is close to the open circuit potential, the surface of the electrode is not entirely affected by the experiment, so the same sample can be used in other studies. The linear polarisation measurements were performed in the potential region of ±15 mV around EOC and the results are shown on Figure 4. Polarisation resistance (Rp) represents the resistance
of a metal to corrosion, and is defined by the slope of the polarisation curve near the corrosion potential by equation (2):
i E Rp
(Ω cm2
) (2)
From Figure 4 it can be seen that the slopes of the linear parts of polarization curves obtained from linear polarization measurements are much higher in the presence of propolis (in solution or applied as a coating), which clearly confirms the corrosion inhibition performance of propolis. The values of the polarization resistance for Cu in NaCl solution without and with propolis are shown in Table 2, along with the calculated values of inhibition efficiency which were calculated according the equation (3): 100 pi p pi R R R
(3)
where Rpi represent the value of polarization resistance for Cu in the presence of propolis and
Rp without propolis.
David Gracić Diplomski rad Prevlake propolisa na 99.9% Cu
i / A cm2
-4 -2 0 2 4 6 8
E / V vs. S CE -0.35 -0.30 -0.25 -0.20 -0.15 -0.10 -0.05
0.5 M NaCl
[image:7.596.201.391.414.573.2]0.5 M NaCl + 4 ml propolis propolis coating
Figure 4. Linear polarization curves for Cu in 0.5 mol dm-3 NaCl solution without and with propolis. Table 2.Values of polarization resistance and corrosion inhibition efficiency obtained from linear
polarization measurements
solution Rp
(k cm2)
η (%)
0.5 mol dm-3 NaCl 3.335 -
0.5 mol dm-3 NaCl + 4 ml propolis
[image:7.596.142.458.658.744.2]
The other electrochemical method used in this corrosion study was the potentiodynamic polarization technique and the results were showed in Figure 5. The potentiodynamic polarization curve is composed of two branches: the cathodic branch corresponding to the cathodic reaction which is in our case oxygen reduction reaction, and the anodic branch resulting from the anodic dissolution of Cu.
From Figure 5 it can be seen that the anodic parts of the polarization curves for Cu in 0.5 mol dm-3 without and in the presence of 4 ml of propolis are similar, and can be divided into three regions: section I is a potential region of apparent Tafelian behavior, where mixed charge transfer and mass transport controlled kinetics are usually assumed; section II in which the formation of surface corrosion products result in lowered the anodic current density and section III were corrosion products dissolve due to the formation of Cu(II) species. This anodic behavior is characteristics for copper and some copper alloys [42-44]. Such behavior was considerably subdued for the Cu electrode coated with propolis, meaning that the activity of the anodic reactions was considerably lowered.
David Gracić diplomski rad
99.9% Cu u 0.5M NaCl + 4 ml propolisa + prevlaka
i / A cm-2
10-9 10-8 10-7 10-6 10-5 10-4 10-3 10-2
E
/ V v
s. SCE
-0.8 -0.6 -0.4 -0.2 0.0 0.2 0.4 0.6 0.8
0.5 M NaCl
0.5 M NaCl + 4 ml propolis propolis coating
Figure 5. Potentiodynamic polarization curves for Cu in 0.5 mol dm-3 NaCl solution without and with propolis.
It is apparent that propolis in solution caused a shift in the corrosion potential towards more negative values well as reduced the cathodic and anodic current densities, with a more pronounced cathodic effect.
Copper protection with propolis coating leads to significant changes of corrosion potential in the positive direction as well as a huge reduction of cathodic and anodic current densities, with more pronounced anodic effect.
From the potentiodynamic polarization curves, the corrosion parameters were determined and given in Table 3. Percentage of corrosion inhibition was calculated according to equation (4):
100
corr i corr corr
i i i
[image:8.596.169.419.314.516.2]
where (icorr)i represent the value of the corrosion current densities for Cu in the presence of propolis
and icorr is without propolis.
Table 3. Values of corrosion current density, corrosion potential and corrosion inhibition efficiency obtained from potentiodynamic polarization measurements
Solution
icorr
(A cm-2)
Ecorr
(V)
η (%)
0.5 mol dm-3 NaCl 3.70 -0.270 -
0.5 mol dm-3 NaCl + 4 ml propolis 1.06 -0.340 71.35
propolis coating on Cu 0.22 -0.138 94.05
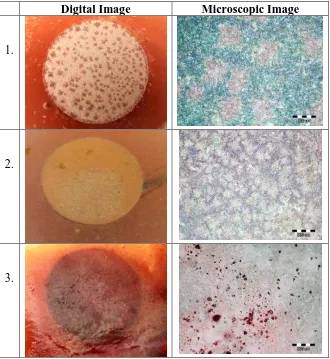
After the potentiodynamic polarization experiments, the electrodes were taken from the cell and left to dry in a desiccator. Afterwards, the surface of the alloys were photographed in macro mode using a digital camera, and then examined with the metallurgical microscope with the magnification of 100 x (Figure 6).
In Figure 6 (1) the surface condition of the Cu electrodes after polarization measurements in NaCl solution appeared quite rough, due to general corrosion. The blue colored areas on the micrograph indicate the presence of copper chloride in combination with copper oxide and hydroxide. Studies have found that in neutral chloride solutions the dominant corrosion product on the copper surface is CuCl, which eventually transforms into Cu2O, which oxidizes to Cu(OH)2, Cu2(OH)3Cl ×
Cu(OH)2 [43].
A different surface morphology is seen on the Cu electrode after polarization tests in NaCl solution containing propolis (Figure 6 (2)), which is due to the protective influence of propolis. Figure 6 (3) shows the surface condition of the Cu electrode coated with the propolis coating after potentiodynamic polarization measurements. It is evident that the propolis coating almost completely covers the surface of the Cu electrode which is barely visible under the coating, indicating good adhesion of propolis to the Cu electrode.
[image:9.596.95.499.161.342.2]
Digital Image Microscopic Image
1.
2.
3.
Figure 6. Digital and microscopic images of the surface of the Cu samples after potentiodynamic polarization measurements in 0.5 mol dm-3 NaCl solution (1) without propolis; (2) in the presence of 4 ml of propolis added to NaCl solution; (3) in the presence of propolis coating on Cu.
Compound Molecular Structure
Total Electron Density
HOMO orbital LUMO orbital
Luteolin
7-O-prenylpinocembrin
[image:10.596.134.464.69.428.2]
Linalool
P-methoxycinnamic acid
3-prenyl-4-hydroxy-suberosin
cinnamic acid
3-prenylresveratrol
6-methoxydiphyllin
Prenylated coumarin
[image:11.596.43.553.65.505.2]Figure 7. Electronic properties of selected constituents of propolis: HOMO orbital, LUMO orbital, and total electron density.
Table 4. Electronic structure parameters for selected propolis constituents
Compound EHOMO
(eV)
ELUMO
(eV)
∆E (eV)
Luteolin -5.37 -2.545 2.83
7-O-prenylpinocembrin -5.406 -2.373 3.03
Cearoin -4.974 -2.447 2.53
Linalool -4.785 -0.604 4.19
[image:11.596.126.472.582.766.2]
The EHOMO values (−5.559 to −4.823 eV), ELUMO values (−2.810 to −0.604 eV), and ΔE (ELUMO
− EHOMO) values (2.25 – 4.19 eV) do not vary very significantly, meaning that the molecules will exert
somewhat similar effects. More importantly, the magnitude of the ΔE values (> 1 eV) suggest that the molecules would favor non specific interactions with the metal surface, which agrees well with the physical adsorption mechanism proposed for propolis on carbon steel [26] and stainless steel [27].
Figure 8 shows the electronic structure descriptors for the identified common constituents of Croatian propolis as reported by [22] (p-coumaric acid, chrysin and pinocembrin), while the computed electronic structure parameters are listed in Table 5.
Compound Molecular Structure
Total Electron Density
HOMO orbital LUMO orbital
Chrysin
p-Coumaric
acid
[image:12.596.52.551.219.455.2]Pinocembrin
Figure 8. Electronic properties of common constituents of Croatian propolis: HOMO orbital, LUMO orbital, and total electron density.
Indeed, our findings for the common constituents of Croatian propolis are quite comparable to those of other propolis constituents (Figure 7 and Table 4). This possibly explains why propolis from different sources have been consistently found to exert appreciable anticorrosion efficacy.
Table 5. Electronic structure parameters for common constituents of Croatian propolis
Compound EHOMO
(eV)
ELUMO
(eV)
∆E (eV) Chrysin -5.632 -2.867 2.77 p-Coumaric acid -5.636 -2.676 2.96 Pinocembrin -5.589 -2.421 3.168
undertaken such computations to model the adsorption structures of the common constituents of Croatian propolis on Cu. Although the computational study is not intended to provide in depth explanation of the adsorption mechanisms of propolis, it is very relevant for recognizing and appreciating the relative contributions of individual constituents of such complex multi-component systems, which are normally difficult to achieve by experiments.
Compound Side view On top view
Chrysin
Eads = 41.82 kcal/mol p-coumaric acid
Eads = 41.88 kcal/mol Pinocembrin
Eads = 63.14 kcal/mol
Figure 9. Representative snapshots of common constituents of Croatian propolis adsorbed on Cu(110).
Molecular dynamics (MD) simulation of non covalent interaction between single molecules of p-coumaric acid, chrysin and pinocembrin and the Cu surface was performed using Forcite quench molecular dynamics in the MS Modeling 7.0 software to sample numerous low energy configurations and identify the low energy minima. Details of the computational procedures for the molecular dynamics simulations have been previously reported [9,10].
[image:13.596.63.536.189.554.2]
surface coverage. The interaction between each molecule and the Cu surface was quantified by calculating the adsorption energy (Eads) as follows:
Eads = Etotal − (EMol + ECu) (5)
Emol, ECu, and Etotal correspond respectively to the total energies of the molecule, Cu(110) slab,
and the adsorbed Mol/Cu (110) couple, calculated by averaging the energies of the five structures of lowest energy. The Eads values are all negative, indicating stable adsorption structures and accounts for
the remarkable ability of propolis to inhibit Cu corrosion. The magnitudes of the Eads values can be
attributed to the considerable dispersive interactions induced by the high polarizability of the heteroatoms in the molecules, including the π electron delocalization, which promote more specific adsorption of the molecules, corresponding to an adsorption mechanism involving blocking of active corrosion sites, in agreement with the experimental findings in this and other studies.
4. CONCLUSIONS
The dry coating of propolis significantly changed the open circuit potential for the Cu in 0.5 mol dm-3 NaCl solution towards positive values, while the addition of propolis to the solution does not change significantly the stable value of the open copper circuit potential.
EIS measurements indicated a high increase in total impedance for the copper electrode in the presence of propolis.
Polarization resistance values for Cu in the 0.5 mol dm-3 NaCl solution are significantly higher in the presence of propolis, and the values of corrosion current densities are significantly reduced indicating propolis corrosion inhibiting activity.
Optical investigations of Cu surfaces after polarization investigations have revealed that general corrosion occurs on the surface of the electrode causing the rough surface. After polarization investigation propolis coating still fully cover the surface of the Cu electrodes, indicating good adhesion of propolis to the Cu electrode.
Quantum chemical computations corroborate the experimentally determined corrosion inhibition mechanism of propolis and confirm the contributions of the individual constituents to the overall corrosion inhibition performance.
ACKNOWLEDGEMENTS
The project Natural Products for Materials Protection (NPMP) is supported by the Nigeria Tertiary Education Trust Fund (TETFund), 2014/2015 research projects intervention for the Federal University of Technology Owerri.
References
2. M. M. Antonijević, S. M. Milić, M. D. Dimitrijević, M. B. Petrović, M. B. Radovanović, A.T. Stamenković, Int. J. Electrochem. Sci., 4 (2009) 962.
3. H. Otmačić Ćurković, E. Stupnišek-Lisac, H. Takenouti, Corros. Sci., 52 (2010) 398. 4. L. Vrsalović, M. Kliškić, J. Radošević, S. Gudić, J. Appl. Electrochem., 35 (2005) 1059.
5. M. Sangeetha, S. Rajendran, T. S. Muthumegala, A. Krishnaveni, Zaštita materijala, 52 (2011) 3. 6. P. B. Raja, M. G. Sethuraman, Matt. Lett., 62 (2008) 113.
7. N. Patni, S. Agarwal, P. Shah, Chin. J. Eng., (2013) 1.
8. M. B. Petrović-Mihajlović, M. M. Antonijević, Int. J. Electrochem. Sci., 10 (2015) 1027.
9. S. Gudić, E. E. Oguzie, A. Radonić, L. Vrsalović, I. Smoljko, M. Kliškić, Maced. J. Chem. Chem. Eng., 33 (2014)13.
10. D. I. Njoku, I. Ukaga, O. B. Ikenna, E. E. Oguzie, K. L. Oguzie, N. Ibisi, J. Mol. Liq., 219 (2016) 417.
11. L. Vrsalović, S. Gudić, M. Kliškić, Indian J. Chem. Technol., 19 (2012) 96.
12. I. Jerković, A. Radonić, M. Kranjac, M. Zekić, Z. Marijanović, S. Gudić, M. Kliškić, Chem. Pap., 70 (2016) 726.
13. S. Gudić, L. Vrsalović, M. Kliškić, I. Jerković, A. Radonić, M. Zekić, Int. J. Electrochem. Sci., 11 (2016) 998.
14. D. Bertelli, G. Papotti, L. Bortolotti, G. L. Marcazzan, M. Plessi, Phytochem. Anal., 23 (2012) 260.
15. H. Hachelef, A. Benmoussat, A. Khelifa, D. Athmani, D. Bouchareb, J. Mater. Environ. Sci., 7 (2016) 1751.
16. I. Kosalec, M. Bakmaz, S. Pepeljnjak, S. Vladimir-Knežević, Acta Pharm., 52 (2004) 65. 17. G. A. Burdok, Food. Chem. Toxicol., 36 (1998) 347.
18. E. Langer, H. Schilcher, Dtsch. Apoth. Ztg., 37 (1999) 51.
19. S. Huang, C. P. Zhang, K. Wang, G. Q. Li, F. L Hu, Molecules, 19 (2014) 19610.
20. 20 M. MedićŠarić, I. Jasprica, A. Mornar, A. SmolčićBubalo, P. Golja, J. Planar. Chromatogr. -Mod. TLC, 17 (2004) 459.
21. J. Cvek, M. Medić-Šarić, I. Jasprica, D. Vitali, A. Mornar, I. Vedrina-Dragojević, S. Tomić, Phytochem. Anal., 18 (2007) 451.
22. J. Cvek, Chemical characterization and standardization of propolis tincture, PhD Thesis, University of Zagreb, Faculty of Pharmacy and Biochemistry, (2009) Zagreb, Croatia. 23. T. P. Cushnie, A. J. Lamb, Int. J. Antimicrob. Agents, 26 (2005) 343.
24. K. Tan-No, K. T. Nakajima, T. Shoii, O Nakagawasai, F Niijima, M Ishikawa, Y Endo, T Sato, S Satoh, K Tadano, Biol. Pharm. Bul., 29 (2006) 96.
25. A. H. Banskota, Y. Tezuka, S. Kadota, Phytother Res., 15 (2001) 561. 26. N. Oršolić, D. Štajcar, I. Bašić, Period. Boil., 111 (2009) 113.
27. I. Kosalec, S. Pepeljnjak, M. Bakmaz, S. Vladimir-Knežević, Acta Pharm. 55 (2005) 423. 28. S. Radić, Propolis, 21st century medicine? Graf Form, (2004) Split, Croatia. (in Croatian) 29. A. S. Fouda, A. Hamdy Badr, Afr. J. Pure Appl. Chm., 7 (2013) 350.
30. F. Gapsari, R. Soenoko, A. Suprapto, W. Suprapto, International Journal of Corrosion, (2015), Article ID 567202, 1.
31. L. M. P. Dolabella, J. G. Oliveira, V. Lins, T. Matencio, W. L. Vasconcelos, J. Coat. Technol. Res., 13 (2016) 543.
32. J. R. Macdonald, Impedance Spectroscopy, John Wiley & Sons, NewYork, 1987. 33. W. A. Badawy, F. M. Al-Kharafi, A. S. El-Azab, Corros. Sci., 41 (1999) 709. 34. M. Metikoš-Huković, R. Babić, I. Paić, J. Appl. Electrochem., 30 (2000) 617. 35. Lj. Aljinović, S. Gudić, M. Šmith, J. Appl. Electrochem., 30 (2000) 973.
36. L. Vrsalović, S. Gudić, M. Kliškić, E. E. Oguzie, L. Carev, Int. J. Electrochem. Sci., 11 (2016) 459.
38. A. Nikfahm, I. Danaee, A. Ashrafi, M. R. Toroghinejad, Materials Research, 16 (2013) 1379. 39. Y. Qiang, S. Zhang, S. Xu, L. Guo, N. Chen, I. B. Obot, Int. J. Electrochem. Sci., 11 (2016) 3147. 40. El-S. M. Sherif, Int. J. Electrochem. Sci., 7 (2012) 2832.
41. H. Ma, S. Chen, L. Niu, S. Zhao, S. Li, D. Li, J. Appl. Electrochem., 32 (2002) 65.
42. A. V. Benedetti, P. T. A. Sumodjo, K. Nobe, P. L. Cabot, W. G. Proud, Electrochim. Acta, 40 (1995) 2657.
43. G. Kear, B. D. Barker, F. C. Walsh, Corros. Sci., 46 (2004) 109.
44. M. Gojić, L. Vrsalović, S. Kožuh, A. Kneissl, I. Anžel, S. Gudić, B. Kosec, M. Kliškić, J. Alloys Compd., 509 (2011) 9782.