Rochester Institute of Technology
RIT Scholar Works
Theses Thesis/Dissertation Collections
11-1-2007
Assessment of accuracy and repeatability of verbal
exertion estimation in the presence of fatigue
Matthew Klosner
Follow this and additional works at:http://scholarworks.rit.edu/theses
This Thesis is brought to you for free and open access by the Thesis/Dissertation Collections at RIT Scholar Works. It has been accepted for inclusion in Theses by an authorized administrator of RIT Scholar Works. For more information, please [email protected].
Recommended Citation
Assessment of Accuracy and Repeatability of Verbal Exertion
Estimation in the Presence of Fatigue
By Matthew Klosner
A Thesis Submitted in Partial Fulfillment
of the Requirements for the Degree of Master of Science in Industrial Engineering
Industrial and Systems Engineering Department Rochester Institute of Technology
Approved by:
_________________________________________________Date:__________________ Dr. Matthew Marshall
Thesis Advisor – R.I.T. Department of Industrial and Systems Engineering
_________________________________________________Date:__________________
Dr. Jacqueline Mozrall
Assessment of Accuracy and Repeatability of Verbal Exertion
Estimation in the Presence of Fatigue
By Matthew Klosner
I, Matthew Klosner, hereby grant permission to the Wallace Memorial Library of the Rochester Institute of Technology to reproduce this document in whole or in part that any reproduction will not be for commercial use or profit.
Signature:
Acknowledgement
I would like to express my most sincere thanks to my advisor, Dr. Matthew Marshall, for his advice, guidance, and patience through this entire thesis project. I would also like to thank my committee member, Dr. Jacqueline Mozrall, for her support and feedback.
Special thanks to my family, without whose support the completion of this project would not have been possible. Lastly, I would like to thank my friends, who all
Abstract
Occupational ergonomics has long focused on physical exertion as a key to the prevention of musculoskeletal injuries. Traditionally, objective measurements of forceful exertion such as electromyography (EMG) and direct force measurement have been used to assess exposure to forceful exertion. However, these measurements are often not practical for occupational settings due to their cumbersome and costly nature. As a result, psychophysical magnitude estimation may be used, in which human subjects verbally estimate the magnitude of an exertion. Despite an abundance of research on verbal estimation, its repeatability and the effects of fatigue on estimation accuracy have not been sufficiently assessed. An understanding of these factors is critical for the successful implementation of verbal estimation in occupational settings. The objectives of this research were to quantify the short and long term repeatability of psychophysical magnitude estimation as well as analyze the effect of fatigue on the accuracy of
estimation.
Fifteen subjects performed two experiments separated by one week, in which they performed verbal estimation of submaximal forces. In addition to testing for
Table of Contents
Title Page………I
Acknowledgement………...…IV
Abstract……….V
List of Tables………VIII
List of Figures………...IX
List of Formulas………X
List of Tables... VIII
List of Figures...IX
List of Formulas... X
1 Introduction...1
1.1 Problem Statement...2
2 Literature Review...3
2.1 Repetitive Motion Injuries of the Upper Extremities...3
2.2 Force Measurement Techniques...4
2.2.1 Direct Force Measurement...4
2.2.2 Electromyography (EMG)...5
2.2.3 Psychophysical Magnitude Estimation...6
2.3 Muscular Fatigue and Endurance...9
2.3.1 Fatigue as a factor in Psychophysical Magnitude Estimation...9
2.3.2 Inducing Muscle Group Specific Fatigue...12
2.4 Repeatability of psychophysical magnitude estimation...13
3 Methodology...16
3.1 Experimental Objective...16
3.2 Experiment Design...16
3.3 Independent Variables...17
3.3.1 Experiment...17
3.3.2 Replication...17
3.3.3 Force Level...18
3.3.4 Fatiguing Task Force...18
3.4 Dependent Variables...18
3.4.1 Error in Submaximal Exertion Estimation...18
3.4.2 Error in Fatigue Estimation...19
3.4.3 Subjective Rating of Perceived Discomfort...19
3.5 Subjects...20
3.6 Experimental Procedure...20
3.6.1 Experiment A – Fatigue Trials Between Submaximal Estimation Trials...21
3.6.1.1 MVC Measurement...22
3.6.1.2 Submaximal Exertion Estimation...23
3.6.1.3 Fatiguing Exertions...24
3.6.2.1 MVC Measurement...27
3.6.2.2 Submaximal Exertion Estimations...27
3.7 Data Analysis...28
4 Results...29
4.1 Accuracy of Exertion Estimation...29
4.1.1 Effect of Replication...30
4.1.2 Effect of Experiment...33
4.1.3 Effect of Force Level...34
4.2 Fatigue Perception...36
4.2.1 Effect of Fatiguing Task Force Level and Order on Fatigued Strength Estimate ...36
4.2.2 Effects of Fatiguing Task Force and Order on Perceived Discomfort...38
4.2.3 Relationship between Perceived Discomfort, Error, and Strength Loss in Fatigued Strength Estimate...41
4.2.3.1 Fatigued Strength Estimate and Perceived Discomfort...41
4.2.3.2 Fatigued Strength Estimation Error, Perceived Discomfort, and Strength Loss...42
546 Discussion...46
5.1 Error in Submaximal Exertion Estimation...46
5.1.1 Repeatability of verbal estimation in submaximal exertion estimations...47
5.1.2 Effect of fatigue on psychophysical magnitude estimation...49
5.1.3 Effects of force level on psychophysical magnitude estimation...51
5.2 Fatigue Perception...52
5.2.1 Error in Fatigued Strength Estimate...53
5.2.2. Perceived Discomfort of Fatiguing Task...56
5.3 Limitations...57
5.4 Future Research...58
6 Conclusion...60
References:...62
Appendix A: Informed Consent Form...67
Appendix B: Ratings of Perceived Discomfort...68
Appendix C: Analysis of Variance for Submaximal Exertion Estimation...69
Appendix D: Analysis of Variance for Fatigued Strength Estimation Error...81
Appendix E: Analysis of Variance for Perceived Discomfort of Fatiguing Task...86
Appendix F: Analysis of Variance of Strength Loss from Fatiguing Task...91
List of Tables
List of Figures
Figure 3.1 Overview of the experiment ………17
Figure 3.2 Hand position on apparatus ……….21
Figure 3.3 Timeline for experiment A ………..22
Figure 3.4 Fatiguing task display ………..24
Figure 3.5 Fatiguing task display while subject performs task ……….25
Figure 3.6 Rohmert curve (Rohmert, 1960) ………..26
Figure 3.7 Timeline for experiment B ……….….27
Figure 4.1 Main effect of replication on submaximal exertion estimation error ………..31
Figure 4.2 Interaction effect of replication and experiment on submaximal exertion estimation error ………32
Figure 4.3 Interaction effect of replication and force level on submaximal exertion estimation error ………32
Figure 4.4 Main effect plot of experiment on submaximal exertion estimation error …..33
Figure 4.5 Interaction effect of experiment and force level on submaximal exertion estimation error ………....34
Figure 4.6 Main effect of force level on submaximal exertion estimation error ………..35
Figure 4.7 Main effect of fatiguing task force level on fatigued strength estimation error ……….37
Figure 4.8 Main effect of order of estimation on fatigued strength estimation error …...38
Figure 4.9 Main effect of fatiguing task force on perceived discomfort of fatiguing task ………..40
Figure 4.10 Main effect of order on perceived discomfort of fatiguing task ………40
Figure 4.11 Graph of perceived discomfort of fatiguing task vs. fatigued strength estimation error with trendline ………...41
Figure 4.12 Graph of fatigued strength estimation error vs. strength loss from fatiguing task with trendline ...43
Figure 4.14 Main effect plot of fatiguing task force on strength loss from fatiguing
task ………..45
List of Formulas
Formula 3.1 Exertion estimation error ………..19Formula 3.2 Fatigue estimation error ………....19
Formula 4.1 Fatigued strength percentage ………36
Section 1
Introduction
Workplace ergonomics has long focused on physical exertion as a key to the prevention of musculoskeletal injuries. Overexertion of a muscle or group of muscles, either through a one time event or the build up of repetitive exertions leads to injuries. Thus, it is imperative to have a good understanding of the amount of physical exertion needed to perform a work task. This may seem like a very simple notion because it is conceptually straightforward to assess the physical demands of most work tasks. The challenge however arises from the lack of accurate tools to effectively assess the physical demands of the work task.
Traditionally, objective measurements of forceful exertion such as
electromyography (EMG) and direct force measurement have been used whenever a truly objective measurement is needed. However, these objective strength measurements are often not practical for occupational settings due to their cumbersome and costly nature. As a result, worker estimates of their physical exertion intensity are often used.
However, these subjective measurements carry with them a question of accuracy. A substantial amount of research has been performed on psychophysical
Fatigue as a physical and mental result of physical exertion has been explored considerably. Research has examined everything from the biophysical causes of fatigue to the endurance limits of different muscle groups in performing tasks. The research, however, is very sparse when evaluating how aware people are of their fatigue level and their strength when fatigued. This awareness of fatigued strength is important since a worker at the end of a 12-hour shift could be put at risk by trying to lift something heavy that they were able to safely lift at the beginning of their shift, all due to a lack of
awareness of their current (fatigued) strength.
Workplace ergonomics is currently without a practical and proven method to evaluate the amount of exertion required to perform work tasks. As a result, researchers and practitioners are left with costly and cumbersome equipment or a subjective verbal estimate from the worker performing the task. Since questions remain over the validity of worker estimates, this study aims to evaluate the accuracy of psychophysical
magnitude estimation while examining the effect of fatigue on these estimations to determine if worker estimation is an acceptable method of evaluating task acceptability.
1.1 Problem Statement
The objective of this thesis is to determine the accuracy and repeatability with which subjects can estimate the magnitude of submaximal exertions and what role fatigue plays in the accuracy of these estimated physical exertions during hand grip tasks.
Section 2
Literature Review
2.1 Repetitive Motion Injuries of the Upper Extremities
A pressing concern in workplace ergonomics is repetitive motion injury.
Repetitive motion injuries are injuries to the musculoskeletal and nervous systems caused by the combined effects of repeated motions, forceful exertions, awkward or sustained postures, or vibration. Also known as cumulative trauma disorders, repetitive strain disorders, and repetitive stress syndrome, RMI’s develop gradually over time and can affect nerves, tendons, and muscles all over the body, and are especially prevalent in the upper extremities (fingers, hands, wrists, arms, shoulders, upper back, and neck). In a study of Washington State’s workers compensation claims from 1987 through 1995, Silverstein, Welp, Nelson, and Kalat (1998) found that hand and wrist injuries were by far the most prevalent, with almost 1 in 100 employees suffering from a hand wrist disorder. RMI’s of the hand and wrist (such as carpal tunnel syndrome or tendonitis) have limited workers performing all types of work tasks. Affected occupational tasks range from as simple as typing on a computer to operating a heavy vibrating tool (Palmer, Harris, & Coggon, 2007). Tasks that involve repetitive motions can put workers at risk for developing RMI’s.
Albers, 1999; Palmer et. al, 2007; Silverstein, Fine, & Armstrong, 1986; Viikari-Juntura & Silverstein, 1999). Additionally, high repetition has been found to be a greater risk factor for RMI’s than high forces (Silverstein, Fine, & Armstrong, 1987), which seems to point out common assembly tasks as high risk for an RMI.
In order to identify tasks as high risk for RMI’s, it is important to have a thorough understanding of the task and its requirements. In determining the force requirements for a task, there are several techniques available.
2.2 Force Measurement Techniques
Several force measurement techniques are available to evaluate the exertion needed to perform a task. In choosing between these techniques, there appears to be a tradeoff between cost, ease of use, and accuracy.
2.2.1 Direct Force Measurement
exertion measurement techniques when evaluating handgrip force, such as
electromyography (Duque, Masset, & Malchaire, 1995; Iridiastadi & Nussbaum, 2006), psychophysical magnitude estimation (De Serres & Fang, 2004; Spielholz, 2006), or both (Grant, Habes, & Putz-Anderson, 1994; Koppelaar & Wells, 2005; Marshall, Armstrong, & Ebersole, 2004).
However, practical considerations often lead practitioners of industrial ergonomics away from direct force measurements. Although ideal for laboratory activities, the gauges needed to assess force are quite expensive, require specialized knowledge to use, and may not be adaptable to the specific task. If the task is adaptable, it can be very time consuming to fit a force gauge to the task, requiring customized handles on the tool(s) being used. If this is not enough, most sensors have to be attached to the hands and fingers, causing workers to deviate from normal practices (Jensen, Radwin, & Webster, 2001). Additionally, the precision produced by the force gauges is often in excess of what is required in a workplace setting (Koppelaar & Wells, 2005). As a result of the impracticality of direct force measurement, indirect force measurement methods are being integrated into the evaluation of forceful exertions.
2.2.2 Electromyography (EMG)
EMG is a technique of tracking the electrical potential of muscles as they are at rest and as they contract (Rau, Schulte, & Disselhorst-Klug, 2004). Surface
with other measures of applied force, such as direct force measurement (Duque, et. al 1995; Iridiastadi & Nussbaum, 2006) and psychophysical scales (Grant et. al, 2004; Koppelaar & Wells, 2005; Marshall et. al, 2004). However, the use of EMG to provide objective data on exertion intensity relies on several factors, such as the distance between the muscle and the recording electrodes, which are practitioner dependent (Rau et. al, 2004). Similarly, surface electrodes are susceptible to changes in posture since the skin they are located on can shift above the underlying muscle they are supposedly monitoring (Duque et. al, 1995). Thus, the same experiment can lead to different conclusions based only on the location of the EMG sensors (Mercer, Bezodis, DeLion, Zachry, & Rubley, 2006). Although surface electromyography allows researchers to map muscle activity to force produced, the process is still complicated and can lead to practitioners examining simpler methods.
2.2.3 Psychophysical Magnitude Estimation
Psychophysical magnitude estimation is another indirect method of forceful exertion evaluation used both in laboratory settings and in the field. This is mainly due to the ease and simplicity with which it can be performed. With psychophysical magnitude estimation, the subject is asked to evaluate, often as a percentage of their maximum strength, the amount of force needed to perform a given task or job. The obvious drawback to this indirect method is the subjectivity associated with having the subject estimate based on their personal strength, leading to a loss of accuracy in the estimation.
simpler, requiring less investment (both time and money) in order to obtain results (Sinclair, 1995). No elaborate (expensive) equipment is needed. The subject only needs to perform their task as they normally would, with the possibility of some training beforehand, and provide an estimate of the magnitude of an exertion in terms of their maximum capability.
Subjectivity is a major weakness of psychophysical magnitude evaluation since a common perception is that it may lead to a loss of accuracy in the force estimate. This however may not be as large a problem as first thought, especially for complex tasks, where psychophysical estimates have been shown to be more accurate than EMG (Grant, Habes, & Putz-Anderson, 1994). Laboratory settings generally attempt to isolate factors such as fatigue, experience, or exertion type to determine what effect they alone have. This approach often overlooks the interactions between these effects, which can be even more significant than the effects of the individual conditions. One of the key benefits of psychophysical magnitude estimation is that it incorporates a great deal of information from various sources within the body (muscles, joints, and nerves) and integrates them together (Borg, 1990). Even though the information is coming from multiple sources, the accuracy of the estimate has been found not to depend on the specific muscle group used to create the exertion (Chin, Bishu, & Hallbeck, 1995). Likewise, Marshall et. al (2004) found that the error in estimation did not significantly differ over different tasks as long as the tasks utilized the same general muscle groups.
the previous research has found that subjects tend to overestimate forces at low levels (Boa & Silverstein, 2005; De Serres & Fang, 2004; Spielholz, 2006). Other research has found that subjects tend to overestimate across all force levels, although not significantly at high levels (Marshall et. al, 2004). Meanwhile, Wiktorin, Selin, Ekenvall, Kilbom, & Alfredsson (1996) found that subjects overestimated the force needed to reproduce low force levels and underestimated the force required to match high force levels.
Additionally, some research has pointed in the opposite direction. Chin (1995) found that subjects tended to underestimate the magnitude of the force across all force levels. Fairfax, Balnave, & Adams (1995) found no pattern in the error of the estimates, but that the variability was much greater for midrange submaximal exertions than for other exertions. Even with the slight error in estimation, the literature suggests that
psychophysical magnitude estimation can be used in laboratory settings as well as the field since it provides reasonably valid data for a fraction of the cost and effort of other force measurement techniques.
could be guided to specific values other than their maximum without specific (expensive) equipment. Marshall et. al (2004) found that one maximal exertion produced before estimating force significantly improved the accuracy of the estimation. Training is one factor that has been found to significantly affect the accuracy of a subject to estimate their exertion, while other factors, such as muscular fatigue, have yet to be fully examined.
2.3 Muscular Fatigue and Endurance
Muscular fatigue can be defined as “a loss of maximal force-generating capacity that develops during muscular activity” (Lewis & Haller, 1991, p. S98) Reduced blood flow to the muscles and lactic acid buildup are the most widely accepted physiological causes for fatigue, although some research has disputed this for low level isometric contractions (Sjogaard, Savard, & Juel, 1988). Because fatigue is so common, it needs to be considered as a factor affecting the accuracy with which a subject can estimate their exertion since the subject may be fatigued when they are producing their exertion
estimate. Previous research on verbal estimation (Marshal et. al, etc.) has used time delay or randomization to control or minimize the presence of fatigue.
2.3.1 Fatigue as a factor in Psychophysical Magnitude Estimation
A reduction in the ability of a muscle (or muscle group) to produce force should conceivably affect an estimate of an exertion. Under ideal settings, a decrease in
the subject was asked to estimate the force needed to perform a different task which required 60% of their un-fatigued maximum strength. When estimating the exertion required for this different task based on their current strength, the subject would theoretically estimate 75% since their current strength is less than their un-fatigued strength. This would assume that the subject was aware of the amount of their fatigue and that they were accurate in their exertion estimation. However, muscular fatigue can be intertwined with mental fatigue, amplifying the effects of the muscular fatigue, as shown by Chalder, Berelowitz, Pawlikowska, Watts, Wessley, Wright, and Wallace (1993) during subject scoring on a fatigue scale.
No research has been performed on the specifics of how aware a subject is of their level of fatigue (other than a binary assessment of “fatigued” or “not”). If a subject was not aware of their fatigue, then their psychophysical estimate of forceful exertion would become less accurate as the subject becomes more fatigued. At the same time, if it can be quantitatively proven that subjects are indeed aware of their fatigue level, then it is
possible to go forward and evaluate the accuracy of psychophysical magnitude estimation when the subject is fatigued by treating the subjects’ fatigue as just another factor. This ambiguity in fatigue awareness could potentially distort exertion estimates and thus it needs to be examined further. Although no research has examined awareness of fatigue level, this study hypothesizes that subjects are not accurate in their awareness of their level of fatigue. This was supported in initial pilot studies.
However, this research did not look at any different levels of fatigue, only before the muscles were fatigued and after fatigue, where “fatigue” was defined as when a subject could no longer hold a predefined force. This study could have been improved by
evaluating different levels of fatigue and observing the weight estimates at these different fatigue levels.
Other research has noted the effects of varying levels of fatigue on perceived exertion through long term tasks. Bystrom and Fransson-Hall(1994) noted an almost linear increase in perceived exertion over time with a constant force in intermittent hand grip tasks. This study did not evaluate the accuracy of the psychophysical ratings, however, only noting that they increased over time. But the increase in perceived exertion over time suggests that subjects were aware of their fatigue. This phenomenon of subjects’ awareness of their fatigue has been observed in previous research through increases in exertion intensity over time with constant force in psychophysical estimation (Sjogaard, 1986; Bystrom & Fransson-Hall, 1994; Bystrom & Kilbom, 1990), but has not been thoroughly examined.
It is important to understand in practical terms just how fatigue can influence a subject’s psychophysical magnitude estimation. For example, in an industrial
understanding of their fatigue level. If subjects are aware of their fatigue level, as shown by Bystrom & Fransson-Hall (1994), then they should be able to estimate their exertion as either a percentage of the total strength or as a percentage of their strength at whatever time they are performing the estimate (fatigued strength) with similar degrees of
accuracy. If they are not aware of their fatigue level, their psychophysical magnitude estimation may not be appropriate for situations where subjects are fatigued before providing an exertion estimate. Based on the research cited above, it is hypothesized that this experiment will show that the accuracy of psychophysical magnitude estimation
decreases when the estimations are made from a fatigued state.
2.3.2 Inducing Muscle Group Specific Fatigue
In order to study the effects of fatigue on a muscle group, it is important to first know the strength and endurance limits of the muscle group. Muscular endurance, also known as stamina, is the ability of a muscle to continue producing force over time despite fatigue. The length of the endurance time is dependent on the intensity of the effort (West, Hicks, Clements, & Dowling, 1995; Iridiastadi & Nussbaum, 2006), while sustained static tasks tend to induce fatigue much quicker than intermittent isometric static tasks (El ahrache, Imbeau, & Farbos, 2006). Bjorksten and Jonsson (1977) found that for intermittent static contraction, a mean force of contraction of 14.0% MVC was the endurance limit for arm strength over a 60 minute period. Additionally, the mean force for a continuous static contraction was found to be 7.9% MVC, again for arm strength over a 60 minute period.
ranged from a mean contraction intensity of 17% MVC (Bystrom & Fransson-Hall, 1994) to 7.7% (Eksioglu, 2006) for intermittent handgrip tasks. This variability is in part due to the duration of the intended task, as the Bystrom and Fransson-Hall study examined 60 minute endurance while the Eksioglu study looked at endurance for an 8 hour shift. However, a majority of the research for intermittent handgrip tasks like the ones performed in this study found contraction intensities similar to those of Bystrom and Fransson-Hall(1994). Hagberg (1981) found that in both sustained isometric and intermittent isometric exercise, exertions above 15-20% MVC resulted in a rapid decrease in endurance time, although endurance time was elongated in intermittent isometric exercises. This was further backed up by research performed by Bystrom and Kilbom (1990), which found that local fatigue was not present during intermittent isometric handgrip tasks at 10% MVC. This study also found that in certain contraction-relaxation cycles, fatigue was not present for 25% MVC.
2.4 Repeatability of psychophysical magnitude estimation
Another key to the practical implementation of psychophysical magnitude estimation in the workplace is establishing its repeatability. An assessment method which gives highly accurate results one time and faulty results the next is of limited value since it’s so unreliable.
Minimal research has been performed to determine the repeatability of
Additionally, Kumar, Simmonds, and Lechelt (1994) found no significant difference in estimation accuracy between three trials of constant hand grip force estimation within young female subjects. The rather sparse research into the repeatability of
psychophysical magnitude estimation makes it a prime area to be investigated further. Some limited research has been performed on the ability of subjects to reproduce static forces without any feedback. Carlsoo (1986) found that subjects had a degree of precision of approximately 10% when repeating static forces several times in a row over a short duration, meaning that they were within 10% of the targeted force. Additionally, Wiktorin et. al (1996) found a high reproducibility when subjects performed familiar submaximal forces (tasks with which the subjects were familiar, like a baker simulating lifting a bag of flour). However, this study did not examine the reproducibility of unfamiliar forces, instead focusing only on forces with which the subjects would be familiar from their daily tasks.
Force matching for hand grip forces is another method of observing repeatability. When matching at a known force, force matching has been found to be quite accurate, especially when hand posture and upper arm positions are consistent (Bao & Silverstein, 2005). However, this research by Bao and Silverstein found that the instructions given to the subjects were of paramount importance, citing a reduction in variation due to
Based on the previous research by Kumar et. al (1994) and Wiktorin et. al (1996),
it is hypothesized that this study will find that psychophysical magnitude estimation does
Section 3
Methodology
3.1 Experimental Objective
The objective of this study was to evaluate the effects of force and fatigue on the accuracy of estimations of exertion intensity as well as evaluate the repeatability of psychophysical magnitude estimation. Additionally, this study aimed to quantify the accuracy with which subjects can identify the extent to which they experience fatigue.
3.2 Experiment Design
In this study, a repeated measures experiment was performed. An overview of the experiment is presented graphically in Figure 3.1. Two experiments, A and B, were performed with approximately one week in between the two experiments. Subjects were counterbalanced (approximately half performed experiment A first, while approximately half performed experiment B first) to eliminate any effects of the order of performance on the results.
In both experiments, subjects performed two replications of verbal submaximal exertion estimations. During each of the exertion estimation trials, subjects performed three estimates at each of a low, medium, and high force level. The order of force level presentation was randomized.
Figure 3.1 Overview of the experiment
3.3 Independent Variables
3.3.1 Experiment
The first independent variable was the experiment, which consisted of two levels (A, B). Over the course of this study, subjects participated in two separate experiments separated by approximately one week. The two experiments were counterbalanced to avoid the effects of learning. The two experiments, A and B, consisted of submaximal exertion estimations separated by a 30-minute delay between replications. During this delay, subjects either performed a number of exertions designed to induce fatigue (experiment A) or subjects sat idle (experiment B) (Figure 3.1).
3.3.2 Replication
The second independent variable was replication. For both experiments A and B, subjects performed two replications of submaximal exertion estimates. These
Experiment A
Exertion
Estimations
Replication 1
Exertion
Estimations
Replication 2
Fatigue
Tests
Experiment B
Exertion
Estimations
Replication 1
Exertion
Estimations
Replication 2
replications were separated by 30 minutes consisting of either a number of exertions designed to induce fatigue (experiment A) or idle time (experiment B).
3.3.3 Force Level
The third independent variable was the force level which the subjects were asked to estimate. During each of the submaximal exertion estimation phases, subjects were asked to estimate forces as a percentage of their maximum strength (%MVC). These forces were in percentage of the subject’s maximum strength and broken into three levels: low, medium, and high. The low forces were 10, 15, or 20% MVC while the medium forces were 40, 50, or 60% MVC and the high forces were 75, 85, or 90% MVC. Each force level was estimated three times; once for each value in the level in random order.
3.3.4 Fatiguing Task Force
The fourth independent variable was the force of the fatiguing task. There were three levels of forces used for the fatiguing task: 25% of the subjects MVC, 50% of the subjects MVC, or 75% of the subjects MVC. These levels were selected to induce increasing levels of fatigue, which is described later in further detail. Each subject performed one task at each of the three force levels. The order of the forces was selected randomly for each subject.
3.4 Dependent Variables
3.4.1 Error in Submaximal Exertion Estimation
is defined in Formula 3.1 and is consistent with other research (Marshall et al, 2004). The actual force the machine is set to, as a percentage of the subjects MVC, was known only by the investigator and was recorded with the subject’s estimate of the force required to perform the task. The difference between these two values represents the error in force estimation.
3.1
3.4.2 Error in Fatigue Estimation
Within experiment A, the difference between the perceived strength loss due to fatigue and the actual strength loss was another dependent variable. This is defined in Formula 3.2. A maximum strength (MVC) measurement was performed immediately prior to and following the fatiguing task, with the difference being the actual strength loss. Immediately following the fatiguing task, the subject was asked to estimate their current strength as a percentage of their fully-rested strength, providing the perceived strength loss. The difference between these two values is the error in fatigue estimation.
3.2
3.4.3 Subjective Rating of Perceived Discomfort
Also within experiment A, subjective rating of perceived discomfort served as a dependent variable. Subjects were asked to verbally report their perceived discomfort in
Estimated Force -
Actual Force =
Exertion Estimation Error
Estimated Strength
Loss
- Strength Actual Loss
subjects were shown the rating scale and instructed how to use it. Perceived discomfort was included as a dependent variable in order to ascertain the relationship between perceived discomfort and fatigued strength estimation error.
3.5 Subjects
A total of 15 subjects (9 male, 6 female) participated in this study. All subjects were full-time college students at either the undergraduate or graduate level. No subjects reported having any hand or wrist injuries to their dominant hand in the year prior to their participation. Two subjects classified themselves as ambidextrous. These subjects performed the tasks using the hand which felt the most natural in performing the task. Subjects had a mean age of 22.3 years (21-25) and a standard deviation of 1.03 years. Subjects had a mean height of 68.53 inches (61-74) with a standard deviation of 3.29 inches.
3.6 Experimental Procedure
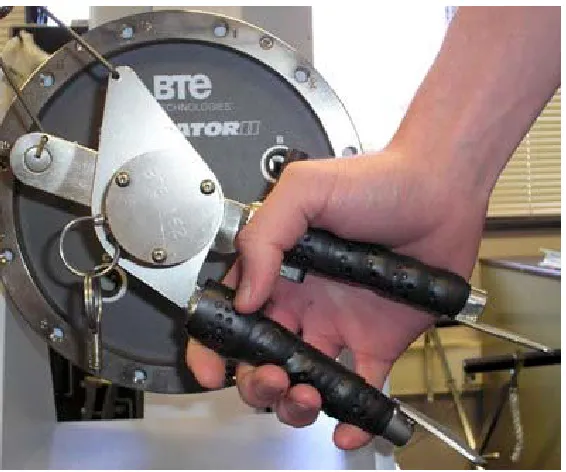
The machine was then adjusted to the subject’s height so that their wrist was at a neutral posture with minimal radal/ulnar deviation or flexion/extension (see Figure 3.2). At this point, subjects were also instructed on how to grip the apparatus, having the hand
[image:32.612.166.449.262.498.2]positioned so that it comfortably grasped the upper portion of the apparatus. The forefinger was at the tip of the lower handle and the inside of the base of the thumb pressed against the protruding metal perpendicular to the axis of the handle with the heel of the palm resting on the upper handle (see Figure 3.2).
Figure 3.2 – Hand position on apparatus
Subjects were also informed to use only their hand grip strength when squeezing the handle, not their body weight or the contribution created by using other segments in their upper body. This was monitored by watching the subject closely throughout the
experiment to ensure subjects were consistently using only their hand grip strength.
3.6.1 Experiment A – Fatigue Trials Between Submaximal Estimation Trials
their maximum grip strength, subjects estimated their exertion as they squeezed the apparatus at nine different submaximal forces. A fatiguing task (described in section 3.6.1.3) followed the exertion estimates, and was designed to fatigue the muscles of the hand and forearm. After the fatiguing task, another MVC test was performed to
determine the subject’s actual strength at that point, which they were then asked to estimate as a percentage of their original strength before the fatiguing task. This cycle (MVC test, fatiguing exertion, MVC test and estimates) was repeated two more times using different fatiguing force levels. After the third fatiguing exertion, subjects performed the second replication of submaximal exertion estimates. A timeline of the procedure can be seen in Figure 3.3.
1 2 3 1 4 5 3 1 4 5 3 1 4 5 2
1: MVC Measurement
2: Submaximal Exertion Estimations 3: Five Minute Recovery Period 4: Fatiguing Exertion
5: MVC Measurement / Fatigue Strength Estimate / Rating of Perceived Discomfort
[image:33.612.96.507.413.456.2]0 min. 45 min.
Figure 3.3 - Timeline for experiment A
3.6.1.1 MVC Measurement
maximum at each test, since previous research has found grip strength to be more consistent in measurement sets of three consecutive measurements than in single measurements (Ertem, Harma, Cetin, Elmali, Yologlu, Bostan, and Sakarya, 2005; Mathiowitz, Kashman, Volland, Weber, Dowe, and Rogers, 1985). Participants were allowed 20 seconds rest between exertions during each phase as a method of preventing their fatigue level from changing during the phase. For each of the trials, subjects were informed to slowly ramp up to their maximum force over a 2-4 second period and then hold their maximum for a 1-3 second steady state period (Chaffin, 1975).
3.6.1.2 Submaximal Exertion Estimation
3.6.1.3 Fatiguing Exertions
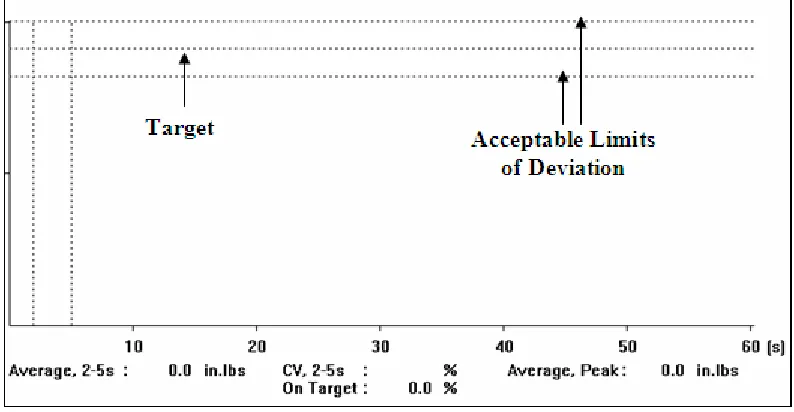
[image:35.612.106.503.270.476.2]Each participant performed three fatiguing tasks between estimation periods during experiment A. These fatiguing tasks consisted of a 60 second sustained static exertion at a low force (25% MVC), medium force (50% MVC), or high force (75% MVC) submaximal target exertion level. Before beginning the task, the subject was instructed to hold their force as best they could for 60 seconds to the center dashed target line shown on the screen (Figure 3.4).
Figure 3.4 - Fatiguing task display
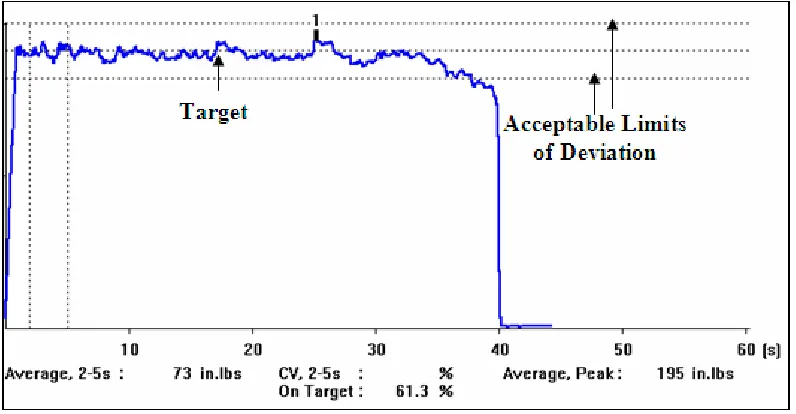
short of the sixty second duration. The subjects were able to follow their progress and adjust the applied force as needed via the line on the display (Figure 3.5). The exertion required in all three fatiguing tasks is significantly above the guidelines set to avoid fatigue for sustained static contractions by Bjorksten and Jonsson (1977), even though their period of time was one hour compared to this experiment’s sixty seconds.
Figure 3.5 - Fatiguing task display while subject performs fatiguing task
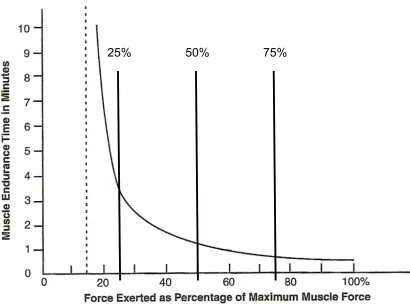
Additionally, the high force fatiguing task falls above the endurance line for one minute tasks on the Rohmert curve (Rohmert, 1960) (Figure 3.6), suggesting that if maintained for one minute, it should significantly fatigue the hand and forearm muscles. Based on the Rohmert curve, the high force task at 75% MVC should only be performable for approximately 45 seconds, while the medium force task at 50% MVC should be
the conclusion of each fatiguing task, subjects used the Borg CR-10 (Borg, 1990) scale to estimate their discomfort while performing the fatiguing task.
[image:37.612.99.509.128.434.2]25% 50% 75%
Figure 3.6 Rohmert curve (Rohmert, 1960).
3.6.1.4 Fatigued Strength Estimation
At the end of each fatiguing exercise, an estimate of the subject’s fatigue was acquired. Immediately after finishing the MVC test, subjects were asked “Please estimate, as a percentage of your initial maximum prior to the fatigue task, your current maximum ability.” Again, the participant was not aware of the actual strength
measurement and could not, therefore, calculate what the strength decrement was.
3.6.2 Experiment B
maximum grip strength, subjects estimated their exertion as they squeezed the apparatus at nine different forces as described previously for experiment A. Once the exertion estimates were completed, the subjects were asked to sit and relax for a 30 minute period. This rest period was for the same duration as the fatiguing task and strength measurement portion of experiment A. Following the 30 minute rest period, the subject’s were again asked to estimate their exertion intensity 9 times for different submaximal exertions. A timeline for experiment B can be seen in Figure 3.7.
1 2 3 1 2
1: MVC Measurement
2: Submaximal Exertion Estimations 3: Rest Period
0 min. 45 min.
Figure 3.7 - Timeline for experiment B
3.6.2.1 MVC Measurement
The MVC measurements in experiment B were performed as they were in experiment A. However, experiment B contained just two MVC measurements: one to begin the experiment and one following the rest period. Please see section 3.6.1.1 for details about how the MVC measurements were conducted.
3.6.2.2 Submaximal Exertion Estimations
3.7 Data Analysis
A repeated measure analysis of variance was performed on the dependent variable error in force estimation (formula 3.1) using the independent variables experiment (A, B), replication (1st, 2nd), and force level (low, medium, high). Post-hoc comparison of the
means was performed using the Tukey method.
From the fatigue tasks performed within experiment A, a single factor repeated measure analysis of variance was performed on both dependent variables error in fatigue estimation (formula 3.2) and perceived discomfort using the independent variable
Section 4
Results
4.1 Accuracy of Exertion Estimation
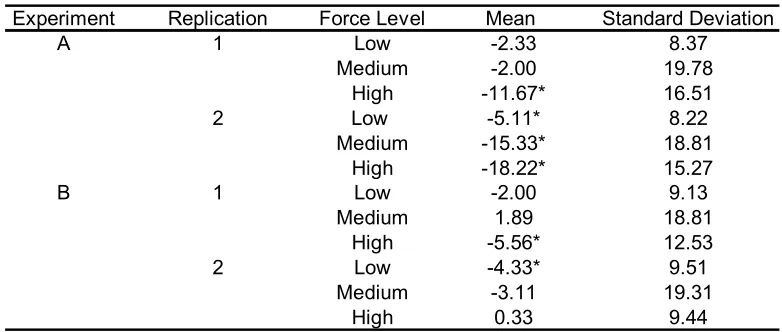
[image:40.612.110.501.316.482.2]Exertion estimation error was calculated by subtracting the actual force from the estimated force (formula 3.1) and the descriptive statistics are shown in Table 4.1. The negative mean indicates an underestimation of exertion by the subject.
Table 4.1 Means and standard deviations of submaximal exertion estimate error (estimated force – actual force). * denotes mean is statistically different from zero.
Experiment Replication Force Level Mean Standard Deviation
A 1 Low -2.33 8.37
Medium -2.00 19.78
High -11.67* 16.51
2 Low -5.11* 8.22
Medium -15.33* 18.81
High -18.22* 15.27
B 1 Low -2.00 9.13
Medium 1.89 18.81
High -5.56* 12.53
2 Low -4.33* 9.51
Medium -3.11 19.31
High 0.33 9.44
Six conditions were significantly different than zero (p < 0.05). These conditions were: experiment A, replication 1, high force level; experiment A, replication 2, low force level, medium force level, and high force level; experiment B, replication 1, high force level; experiment B, replication 2, low force level.
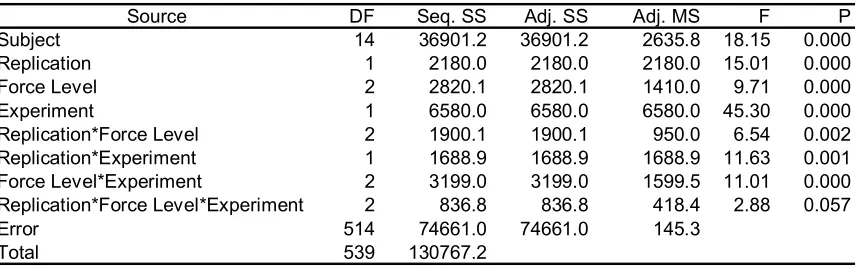
– actual % MVC). The analysis of variance is summarized in Table 4.2 and can be seen in its entirety in Appendix C.
Table 4.2 Three-factor analysis of variance of submaximal exertion estimation error.
Source DF Seq. SS Adj. SS Adj. MS F P
Subject 14 36901.2 36901.2 2635.8 18.15 0.000
Replication 1 2180.0 2180.0 2180.0 15.01 0.000
Force Level 2 2820.1 2820.1 1410.0 9.71 0.000
Experiment 1 6580.0 6580.0 6580.0 45.30 0.000
Replication*Force Level 2 1900.1 1900.1 950.0 6.54 0.002
Replication*Experiment 1 1688.9 1688.9 1688.9 11.63 0.001
Force Level*Experiment 2 3199.0 3199.0 1599.5 11.01 0.000 Replication*Force Level*Experiment 2 836.8 836.8 418.4 2.88 0.057
Error 514 74661.0 74661.0 145.3
Total 539 130767.2
4.1.1 Effect of Replication
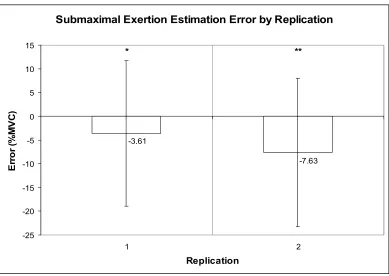
The replication * force level interaction effect (F(2,514) = 6.54, p = 0.002) and the replication * experiment interaction effect (F(1,514) = 11.63, p = 0.001) were
significant along with the main effect of replication (F(1,514) = 15.01, p < 0.001). These interaction and main effects are summarized in Figures 4.1, 4.2, and 4.3. Though the main effect of replication was statistically significant (Figure 4.1), with the second replication significantly greater than the first (p < 0.0001), the replication * experiment interaction effect was also statistically significant and is of the most importance in evaluating the effect of replication.
fatigued during experiment A, and this was verified by the data. The mean strength loss (fatigue) of subjects prior to performing the replication 2 of experiment A was 13% MVC (standard deviation of 11% MVC), verifying that subjects were fatigued prior to the second replication of exertion estimates in experiment A.
The replication * force level interaction effect, shown in Figure 4.3, was also significant (F(2,514) = 6.54, p = 0.002). The only statistically significant difference between the replications happens at the medium force level (p = 0.0008), where the mean error for replication 1 is -0.04% MVC while the mean error for replication 2 is -9.10% MVC. This increase in error from replication 1 to replication 2 is also seen in both the low and medium force levels, although the difference is not significant. The general increase from replication 1 to replication 2 for all force levels is likely driven by the pronounced effect seen in experiment A (shown in Figure 4.2).
Submaximal Exertion Estimation Error by Replication
-7.63 -3.61
-25 -20 -15 -10 -5 0 5 10 15
1 2
Replication
E
rro
r (
%
MV
C
)
[image:42.612.112.501.401.677.2]Submaximal Exertion Estimation Error by Experiment x Replication
-1.89 -5.33 -12.89 -2.37 -35 -25 -15 -5 5 15
Experiment A Experiment B
E rro r (% M V C )
Replication 1 Replication 2 Replication 1 Replication 2
[image:43.612.112.504.71.343.2]* ** * *
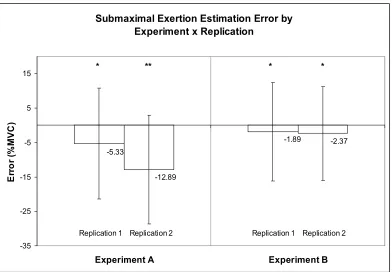
Figure 4.2 Interaction effect of replication and experiment on submaximal exertion estimation error. The number of *’s represent significant differences (p < 0.05) between conditions.
Submaximal Exertion Estimation Error by Replication x Force Level
-0.04 -8.51 -2.13 -8.82 -9.10 -4.65 -35 -25 -15 -5 5 15 25
Low Medium * High
Force Level E rro r ( % M V C )
Replication 1 Replication 2 Replication 1 Replication 2 Replication 1 Replication 2
[image:43.612.110.504.392.666.2]4.1.2 Effect of Experiment
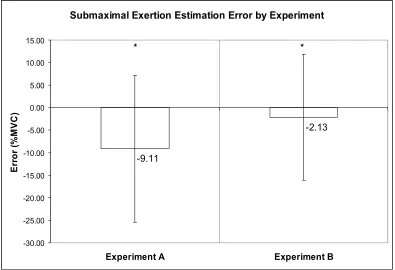
The experiment main effect was statistically significant (F(1,514) = 45.03, p <0.001), but the two-way interaction effects of experiment * replication (F(1,514) = 11.63, p = 0.001) and experiment * force level (F(2,514) = 11.01, p < 0.001) were also statistically significant. Figure 4.4 illustrates the main effect of experiment, with
experiment A being significantly greater that experiment B (p < 0.0001), but this effect is clearly influenced by the experiment * replication interaction effect described in Figure 4.2 previously.
Submaximal Exertion Estimation Error by Experiment
-9.11
-2.13
-30.00 -25.00 -20.00 -15.00 -10.00 -5.00 0.00 5.00 10.00 15.00
Experiment A Experiment B
E
rro
r (%
M
V
C
)
[image:44.612.109.504.295.565.2]* *
Figure 4.4 Main effect of experiment on submaximal exertion estimation error. The number of *’s represent significant differences (p < 0.05) among conditions.
The experiment * force level interaction effect can be seen in Figure 4.5. This interaction effect contains significant differences between experiments at both the
= 0.9999). This interaction preserves the trend from the experiment * replication interaction, as each force level has more error for experiment A than for experiment B.
Submaximal Exertion Estimation Error by Experiment x Force Level
-3.72
-8.67
-14.94
-3.17 -0.61 -2.61
-35 -25 -15 -5 5 15
Low Medium * High *
Force Level
E
rro
r (
%
M
V
C
)
[image:45.612.109.503.129.399.2]Experiment A Experiment B Experiment A Experiment B Experiment A Experiment B
Figure 4.5 Interaction effect of experiment and force level on submaximal exertion estimation error. * denotes a significant difference (p < 0.05) between levels of the experimental factor.
4.1.3 Effect of Force Level
Submaximal Exertion Estimation Error by Force Level
-8.78 -3.44
-4.64
-30.00 -25.00 -20.00 -15.00 -10.00 -5.00 0.00 5.00 10.00 15.00 20.00
Low Medium High
Force Level
E
rro
r (
%
M
V
C
)
[image:46.612.113.502.70.345.2]* * **
Figure 4.6 Main effect of force level on submaximal exertion estimation error. The number of *’s represent significant differences (p < 0.05) among conditions.
The force level * experiment interaction can be seen in Figure 4.5 and was
described previously. Here, replication 2 of experiment A appears to be driving the error for all force levels, as experiment A has greater error than experiment B across force levels, but is only statistically significant for the medium ( p = 0.0038) and high (p < 0.0001) force levels. The large error at the high force condition of experiment A (-14.94 % MVC) also appears to be driving the main effect, as the high force was significantly different from the other levels.
4.2 Fatigue Perception
4.2.1 Effect of Fatiguing Task Force Level and Order on Fatigued Strength Estimate
As described earlier, following the first set of exertion estimates in experiment A, subjects performed a series of three fatiguing tasks after which they were asked to
“Please estimate, as a percentage of your initial maximum prior to the fatigue task, your current maximum ability.” The fatiguing tasks lasted for one minute or until the subject could no longer maintain the force within 10% of the target force. The fatigued strength percentage was then calculated from this estimate following a MVC test immediately after the strength estimation and can be seen in formula 4.1.
MVCAfter / MVCBefore = Fatigued Strength Percentage 4.1
This fatigued strength percentage was then subtracted from the estimate of current strength percentage to get the error in fatigued strength estimate and can be seen in formula 4.2.
4.2
[image:47.612.93.519.617.705.2]A two-factor analysis of variance was then performed on the data to ascertain the significance of the fatiguing task force (25%, 50%, or 75% MVC) and order (1st, 2nd, or 3rd) on the fatigued strength estimation error (estimated strength %MVC – actual strength %MVC). This analysis of variance can be seen in Table 4.3 and in Appendix D.
Table 4.3 Two-factor analysis of variance of fatigued strength estimation error.
Source DF Seq. SS Adj. SS Adj. MS F P
Subject 14 3373.87 2154.64 153.90 2.10 0.057
Order 2 673.73 124.83 62.42 0.85 0.440
Fatiguing Task Force 2 961.14 1092.25 546.13 7.47 0.003
Order*Fatiguing Task Force 4 725.24 725.24 181.31 2.48 0.074
Error 22 1609.23 1609.23 73.15
Fatigued Strength Percentage Estimated Strength
Percentage
- Error in Fatigued
This analysis of variance showed that the main effect of the force level on the accuracy of the fatigued strength estimate was significant (F(2,22) = 7.47, p = .003) The main effect of the variable fatiguing task force level can be seen in Figure 4.7. For the main effect of fatiguing task force, the 75% MVC level was significantly different from the 25% MVC level (p = .0371), as was the 50% MVC level (p = .0039). However, the 75% level and 50% level were not significantly different from each other (p = 0.6409).
The interaction fatiguing task force * order (F(4,22) = 2.48, p = 0.074), as well as the main effect of order, were not significant (F(2,22) = 0.85, p = .440). The main effect of the variable order can be seen in Figure 4.8. No levels were significantly different for the main effect of order at the α = 0.05 level, although an increase in error was observed as order increased.
Fatigued Strength Estimation Error by Fatiguing Task Force Level
-6.44
-16.48 -15.42
-40.00 -35.00 -30.00 -25.00 -20.00 -15.00 -10.00 -5.00 0.00 5.00 10.00
25 50 75
Fatiguing Task Force Level (%MVC)
E
rror (
%
MV
C
)
[image:48.612.109.505.372.649.2]* ** **
Fatigued Strength Estimation Error by Order of Estimation
-7.33
-14.69
-16.32
-35.00 -30.00 -25.00 -20.00 -15.00 -10.00 -5.00 0.00 5.00 10.00
1st 2nd 3rd
Order
E
rro
r (
%
MV
C
)
[image:49.612.111.504.71.345.2]* * *
Figure 4.8 Main effect of order of estimation on fatigued strength estimation error. The number of *’s represent significant differences (p < 0.05) among conditions.
4.2.2 Effects of Fatiguing Task Force and Order on Perceived Discomfort
As described earlier, following the first set of exertion estimates in experiment A, subjects performed a series of three fatiguing tasks where they were asked to estimate their strength after performing a fatiguing task. Along with this strength estimate,
subjects were asked to estimate their discomfort while performing the task using the Borg CR-10 scale (Borg, 1990). The scale used can be seen in Appendix B.
A two-factor analysis of variance was then performed to determine the
Table 4.4 Two-factor analysis of variance of perceived discomfort of fatiguing task.
Source DF Seq. SS Adj. SS Adj. MS F P
Subject 14 101.495 80.629 5.759 7.51 0.000
Order 2 15.024 4.495 2.248 2.93 0.074
Fatiguing Task Force 2 116.258 95.267 47.634 62.14 0.000
Order*Fatiguing Task Force 4 4.947 4.947 1.237 1.61 0.206
Error 22 16.864 16.864 0.767
Total 44 254.588
This analysis of variance showed that the main effect of the variable fatiguing task force on the perceived discomfort value was significant (F(2,22) = 62.14, p < 0.001). The main effect is presented in Figure 4.9. The mean value for perceived discomfort was significantly higher at the 50% level than at the 25% level and significantly higher at the 75% level than at the 50% level and the 25% level. As a trend, perceived discomfort increased almost linearly as the fatiguing task force increased.
Perceived Discomfort of Fatiguing Task by Fatiguing Task Force
2.75 5.47 6.77 0 1 2 3 4 5 6 7 8 9 10
25 50 75
Fatiguing Task Force (%MVC)
[image:51.612.112.503.70.346.2]* ** *** P e rc ei ve d D isco m fo rt
Figure 4.9 Main effect plot of fatiguing task force on perceived discomfort of fatiguing task. The number of *’s represent significant differences (p < 0.05) among conditions.
Perceived Discomfort of Fatiguing Task by Order 5.63 4.23 5.11 0 1 2 3 4 5 6 7 8 9
1st 2nd 3rd
Order P e rc e ive d D isc o m fo rt P e rc e ive d D isc o m fo rt * * *
[image:51.612.111.503.396.666.2]4.2.3 Relationship between Perceived Discomfort, Error, and Strength Loss in Fatigued Strength Estimate
Following the analysis of variance of both the error in the fatigued strength
estimate and the perceived discomfort in the fatiguing task, these two dependent variables were examined along with the strength loss to determine their relationship.
4.2.3.1 Fatigued Strength Estimate and Perceived Discomfort
It would be logical if the fatigued strength estimation error had a directly proportional relationship with perceived discomfort, where the harder the subject perceived the task to be (higher perceived discomfort), the greater their error would be when estimating their fatigued strength. Looking at the graph of perceived discomfort vs. fatigued strength estimation error (Figure 4.11), a weak linear trend is present. This trend suggests a slight increase in underestimation as the task felt more uncomfortable.
Perceived Discomfort of Fatiguing Task vs Fatigued Strength Estimation Error
y = -2.2099x - 1.744 R2 = 0.17
-40 -30 -20 -10 0 10 20
0 2 4 6 8 10 12
Perceived Discomfort
Er
ro
r (
%
M
V
C
[image:52.612.109.502.389.641.2])
4.2.3.2 Fatigued Strength Estimation Error, Perceived Discomfort, and Strength Loss
The actual strength loss of the subjects was monitored as a byproduct of
determining the error in the fatigued strength estimate. However, the actual strength loss is important in knowing exactly how fatigued the subject was when they estimated their strength. Prior to performing the experiment, no expected values for the strength loss were determined. Instead, the generalization that the high force level (75% MVC) would create more strength loss came from the fact that subjects were not expected to be able to maintain that force for a full minute while for the medium (50% MVC) and low (25% MVC) force levels, subjects were. This was based on the Rohmert curve (Rohmert, 1960), which specified maximum endurance times for exertions, where 75% MVC equates to about a 45 second maximum endurance time for sustained static exertion, while 50% MVC equates to approximately 1.25 minutes and 25% MVC to approximately 3.5 minutes, respectively. This is illustrated in Figure 3.6.
Data for the strength loss was plotted against both the fatigued strength estimation error (Figure 4.12) and the perceived discomfort (Figure 4.13). A regression approach was used to analyze the effect of strength loss on both the fatigued strength estimation error and the perceived discomfort and can be seen in Appendix G. Strength Loss was not a significant factor in determining the fatigued strength estimation error (F(1,43) = 2.24, p = 0.142). In Figure 4.12, the randomness of the distribution serves to highlight this lack of significance. However, Strength Loss was a significant factor in determining the perceived discomfort (F(1,43) = 7.48, p = 0.009). This relationship explained
Fatigued Strength Estimation Error vs Strength Loss From Fatiguing Task
y = 0.1851x + 12.142 R2 = 0.0495
-15 -10 -5 0 5 10 15 20 25 30 35
-40 -30 -20 -10 0 10 20
Error (% MVC)
[image:54.612.112.502.73.323.2]S tr en g th Loss ( % M V C )
Figure 4.12 Graph of fatigued strength estimation error vs. strength loss from fatiguing task.
Strength Loss From Fatiguing Task vs Perceived Discomfort of Fatiguing Task
y = 1.7167x + 1.2047 R2 = 0.1482
-15 -10 -5 0 5 10 15 20 25 30 35
0 2 4 6 8 10 12
Perceived Discomfort S tr engt h Lo ss ( % M V C )
[image:54.612.110.502.364.614.2]4.2.3.3 Strength Loss and Fatiguing Task Force
[image:55.612.93.519.261.348.2]Since strength loss was not a significant factor in determining fatigued strength estimation error, yet fatiguing task force level was, it became necessary to examine the relationship between strength loss and fatiguing task force since these factors were expected to be directly related. An analysis of variance was conducted on strength loss and can be seen in Table 4.5 and Appendix F.
Table 4.5 Two-factor analysis of variance of strength loss caused by fatigue task.
Source DF Seq. SS Adj. SS Adj. MS F P
Subject 14 0.021 0.228 0.016 2.71 0.018
Order 2 0.041 0.039 0.020 3.27 0.057
Fatiguing Task Force 2 0.086 0.052 0.026 2.71 0.018
Order*Fatiguing Task Force 4 0.034 0.034 0.008 1.4 0.266
Error 22 0.132 0.132 0.006
Total 44 0.506
The main effect of fatiguing task force level was found to be significant (F(2,22) = 4.32, p = 0.026). Figure 4.15 shows the main effect plot of fatiguing task force on strength loss, where it is apparent that strength loss increased nearly linearly as the level of the fatiguing task force increased. The 75% fatiguing task force level was
Strength Loss From Fatiguing Task by Fatiguing Task Force
16%
10%
4%
-5% 0% 5% 10% 15% 20% 25% 30%
25 50 75
Fatiguing Task Force (% MVC)
S
tr
e
ngt
h Los
s (
%
M
V
C
)
S
tr
e
ngt
h Los
s (
%
M
V
C
)
* * **
[image:56.612.111.502.69.345.2]**
Section 5
Discussion
5.1 Error in Submaximal Exertion Estimation
Because psychophysical magnitude estimation offers workplace ergonomics with a simple method of force estimation, the objectives of this study were to evaluate the effects of force and fatigue on the accuracy of estimations of exertion intensity as well as evaluate the repeatability of psychophysical magnitude estimation. Subjects performed three estimations at each of the three force levels (low, medium, high) in random order for two replications in each of two separate experiments. Replication 1 followed the initial MVC test, while replication 2 was performed at the end of the experiment. The two separate experiments were performed one week apart to assess the repeatability of the estimations. In between replications of experiment A, subjects performed three fatiguing tasks, each at different exertion levels which were assumed to produce different levels of fatigue.
Overall for the experiment, exertion estimation error was on average -5.62 % MVC. So on average, subjects were within approximately 6 % of their maximum strength when estimating forces of unknown magnitudes. It is interesting to note that subjects in this study tended to underestimate their exertion for virtually all conditions, as shown by the negative mean estimation error (the exceptions were experiment B,
contrasts with what was found in other research by Marshall et. al (2004) and Spielholz (2006), who both found that subjects tended to overestimate forces. Based on such mixed results, additional investigation into the issue is needed.
The driving force in the analysis of variance was the interaction between
experiment and replication (Figure 4.2). This interaction demonstrates the importance of the influence of fatigue on the exertion estimates. Although nearly all of the main and interaction effects were significant in evaluating error in submaximal exertion
estimations, this interaction was the most prominent and the most influential effect of them all. The significance of this interaction (experiment * replication) was expected, as one of the initial hypotheses was that fatigue would negatively influence exertion
estimation error.
5.1.1 Repeatability of verbal estimation in submaximal exertion estimations
In order for psychophysical magnitude estimation to be useful in workplace settings, it needs to be reliable. Part of being reliable is the ability to produce the same results under the same conditions. Without an understanding of repeatability, the tool is not as valuable since the results cannot be properly interpreted.
fatigue as a main effect and in the 2-way interactions. Experiment B showed no significant change in estimation error between replication 1 and 2 (Figure 4.2). In fact, the change is actually only -0.48 %MVC; an increase in error from -1.89 %MVC (replication 1) to -2.37 % MVC (replication 2). There is a significant change between replications of experiment A, which is due to fatigue. If fatigue did not have an effect on submaximal exertion estimations, experiment A would have been expected to show very similar results to experiment B. This minimal change suggests short term repeatability with psychophysical magnitude estimation.
Psychophysical magnitude estimation appears to be repeatable over relatively short time periods. These findings are in line with that of Wiktorin et. al (1996), who found push and pull forces to be highly reproducible when performed with one hour between tests and Carlsoo (1986), who found subjects to be within 10% of their targeted force when performing several static forces over a short duration.
Psychophysical magnitude estimation also appears to be repeatable in long term situations since there was no significant difference between the first replication for experiments A and B, which were separated by one week.
Force level was not important to the repeatability analysis since it was not significant in the 3-way interaction experiment * replication * force level (table 4.1) and was clearly driven by fatigue as a main effect and in the 2-way interactions. The
difference between replication 1 of experiment A and replication 1 of experiment B (Figure 4.2). Replication 1 of experiment A did show slightly higher errors than replication 1 of experiment B (-5.33, -1.89), but the difference was not significant. If psychophysical magnitude estimation was not repeatable over a long time, a significant difference between replication 1 of experiment A and B would have been seen. These findings are in line with other research which has found psychophysical magnitude estimation to be repeatable over longer time periods, such as one day (Kumar et. al, 1994). Since there was no significant difference between these conditions, it is fair to conclude psychophysical magnitude estimation has good long term repeatability.
The findings of this study support that psychophysical magnitude estimation was repeatable in both short term (30 minutes) and long term (1 week) settings. This not only confirms the original hypothesis, but also helps to validate psychophysical magnitude estimation as an acceptable tool for industrial applications of workplace ergonomics. Practitioners can trust that there will be no significant difference in psychophysical magnitude estimations due to the time between the estimations. A practitioner can feel safe that when a group of subjects perform psychophysical magnitude estimations, the same group would not give significantly different estimates at another time later in the week assuming the conditions were the same.
5.1.2 Effect of fatigue on psychophysical magnitude estimation
third fatiguing task, subjects were not given a recovery period, instead immediately beginning replication 2 of the exertion estimates. The average fatigue at this point can be taken from the average strength loss which was 13 %MVC (table 4.3), indicating that subjects were somewhat fatigued.
This fatigue caused the exertion estimates seen in replication 2 for experiment A to contain significantly more error than those same estimates in replication 1 of
experiment A (Figure 4.2), which was true across all force levels. In fact, the magnitude of the increase in error was such (-7.56% MVC) that it alone was greater than the error in any other replication.
As noted earlier, subjects underestimated weights under most conditions during this experiment. This is especially true for the estimations made under fatigue. The significant increase in estimation error was actually an increase from a relatively constant underestimate, creating a larger underestimate further from the true force. For example, a 6% MVC underestimate was compounded with another 6% error due to fatigue, creating a 12% MVC underestimate. This is consistent with the findings of Deeb (1999), who found that subjects underestimated forces when fatigued.
The reasons for this increase in estimation error due to fatigue are not
immediately clear. At some point during the information transfer, the presence of fatigue (loss of strength) found in the muscles is lost or distorted, resulting in the subject