Rochester Institute of Technology
RIT Scholar Works
Theses Thesis/Dissertation Collections
5-1-1996
Visual-Based error diffusion for printers
Zhenping Bu
Follow this and additional works at:http://scholarworks.rit.edu/theses
This Thesis is brought to you for free and open access by the Thesis/Dissertation Collections at RIT Scholar Works. It has been accepted for inclusion in Theses by an authorized administrator of RIT Scholar Works. For more information, please [email protected].
Recommended Citation
Visual-Based Error Diffusion for Printers
by
ZhenpingBu
B.S. Chongqing University of Architecture and Technology
(1985)
A thesis submitted in partial fulfillment of
the requirements for the degree of Master of Science
in the Chester F. Carlson Center for Imaging Science
College of Science
at the
ROCHESTER INSTITUTE OF TECHNOLOGY
May, 1996
Signature of the Author ~ _
ZhenpingBu
Accepted by Dana G. Marsh
v1~
/b,
/196
Chester F. Carlson Center for Imaging Science
College of Science
Rochester Institute of Technology
Rochester, New York
CERTIFICATE OF APPROVAL
M.S. DEGREE THESIS
This M. S. Degree Thesis ofZhenping Bu
has been examined and approved by the
thesis committee as satisfactory for the
thesis requirement for the
Master of Science degree
Thesis Advisor: Dr. RogerL. Easton, Jr.
Dr. Jonathan S. Arney
Dr. Mark D. Fairchild
Chester F. Carlson Center for Imaging Science
College of Science
Rochester Institute of Technology
Rochester, New York
THESIS RELEASE PERMISSION FORM
Title of Thesis:
Visual-based Error Diffusion for Printers
I, Zhenping Bu, hereby grant permission to the Wallace Memorial Library of R.I.T. to
reproduce my thesis inwhole or in part. Any reproduction will not be for commercial use
or profit.
Signature of Author: _
Visual-based Error Diffusion for Printers
By ZhenpingBu
Submittedtothe
ChesterF. CarlsonCenterforImaging Science
CollegeofScience
inpartialfulfillment oftherequirements fortheMasterofScience Degree attheRochester InstituteofTechnology
ABSTRACT
Anapproachforhalftoning ispresented thatincorporates a printer model and also
explicitly uses the human visual model. Conventional methods, such as clustered-dot
screening ordispersed-dot screening, do not solvethegray-leveldistortionof printers and just implicitly use the eye as a lowpass filter. Error diffusion accounts for errors when
processing subsequent pixels to minimize the overall mean-square errors. Recently developed "model-based"
halftoningtechnique eliminates the effect of printer luminance
distortion, but this method does not considerthe filtering action ofthe eye, that is, some artifacts of standard error diffusion still exist when the printing resolution and view distance change. Another "visual error diffusion" method incorporates the human visual
filter into errordiffusionand resultsin improvednoise characteristics andbetterresolution
for structured image regions, but gray levels are still distorted. Experiments prove that
humanviewersjudgethe qualityof a halftoning image based mainly onthe region which
exhibits theworst local error, and low-frequency distortions introduced by the halftoning
process are responsible for more visually annoying artifacts in the halftone image than high-frequency distortion. Consequently, we adjustthe correction factors ofthe feedback
filter by local characteristics and adjust the dot patterns for some gray levels to minimize
the visual blurred local error. Based on the human visual model, we obtain the
visual-based error diffusion algorithm, and furtherwe will also incorporate the printer model to
correct the printing distortion. The artifacts connected with standard error diffusion are expected to be eliminated or decreased and therefore better print quality should be achieved. In addition to qualitative analysis, we also introduce a subjective evaluation of
ACKNOWLEDGMENTS
Iwishto acknowledgeDr. Roger L. Easton, Jr. for his guidance and advicewhich made
thisworkpossible.
I would like to thank Dr. Dana Marsh for his administrative help which made life and
studyatCIS easier.
Iwouldliketo thankDr. JonathanArney andDr. Mark Fairchild fortheirparticipation on
mycommitteeandforsuggestionsthat madethis thesisa reality.
Iwould like to thank Mr. ScottDaly, Kodak Imaging Corporation for his talking on the
visual model.
Iwouldliketo thankallvisualobservers whohelp metofinishthepsychophysicaltests.
Finally, I would like to give my sincere appreciation to my lovely wife, Huihui, for her
CONTENTS
1 Introduction 1
2 StandardHalftoning Techniques 5
2.1 ClassificationofHalftoningTechniques 5
2.2 Screening 6
2.2.1 RandomScreening 7
2.2.2 Clustered-dotScreening 7
2.2.3 Dispersed-dot Screening 10
2.3 Error Diffusion 13
2.4 Stochastic Screening 17
2.5 QualitativeAspectsofHalftoningTechniques 20
2.6 Summary 26
3 Eye Modeland Printer Model 28
3.1 Eye Model 28
3.1.1 ConventionalEye Model 28
3. 1.2 Modified Eye Model forHalftoningImages 31
3.1.3 ExtractionofDiscrete Visual Blur Filter 35
3.2Printer Model 38
4 ModifiedError Diffusion 47
4.1 Model-basedHalftoning 49
4.2VisualErrorDiffusion 53
5 Visual-basedError Diffusion 58
5.1 LMS Algorithm 61
5.2LMSApplicationinError Diffusion 63
5.3 CorrectionofOverallGrayLevels 69
6 SubjectiveEvaluation ofHalftoningTechniques 74
6.1 Psychophysical Tests 74
6.2 EvaluationofHalftoningTechniques 81
6.2.1 Resultsfor AlgorithmswithoutPrinter Model 81
6.2.2 ResultsforAlgorithmswithPrinter Model 83
6.3 Summary 84
7 Conclusionand Suggestion 85
List ofFigures
1-1 DigitalHalftoning 1
1-2 ComparisonBetweenStandardError DiffusionandNew Technique(150dpi) 3
2-1 Images HalftonedwithRandom-dot Screen(300dpi) 7
2-2 Clustered-dotMatrix Matrix(Classic-4) 8
2-3 ImagesHalftonedwiththe"Classic-4" Screen(300dpi) 9
2-4 Original andHalftoned(Clustered-dotScreen) Ramp 10
2-5 Dispersed-dot Matrix(Bayer-5) 11
2-6 Images Halftonedwiththe"Bayer-5" Screen(300dpi) 11
2-7 Original andHalftoned(Clustered-dot andDispersed-dotScreens) Ramp 12
2-8 Error DiffusionwithoutDot-overlapCompensation 13
2-9 Floyd and SteinbergError Filter(FL) 15
2-10 Images HalftonedwithFL(300dpi) 15
2-11 RampHalftonedwithFL(300dpi) 15
2-12 Jarvis, JudiceandNinke Error Filter(JA) 15
2-13 Images HalftonedwithJA(300dpi) 16
2-14 RampHalftonedwithJA(300dpi) 16
2-15 Power SpectrumofBlue NoiseandWhite Noise 18
2-16 Images HalftonedwithBlue Noise Mask (300dpi) 19
2-18 Images HalftonedwithDifferentClustered-dot Screens(300dpi) 21
2-19 Partial MagnificationofLena inFigure 2-6(150dpi) 22
2-20 Partial MagnificationofHats in Figure2-3 andFigure 2-10 (100dpi) 23
2-21 EffectsofDotOverlap 24
2-22 EffectsofDotOverlap onClustered-dotandDispersed-dot Patterns 26
3-1 Contrast SensitivityFunction 31
3-2 The Effectsof aPointofLightontheVisual System
(TheVisual Point-spreadFunction) 32
3-3 Modified ContrastSensitivityFunction 34
3-4 TheGeometryforConverting FrequencyUnitfrom
cycles/inchesto cycles/degree 36
3-5 Impulse ResponseofVisual Filter 37
3-6 Measurementfor Dot AreaofPrintedMidgrayPatches 39
3-7 Dots andTheir Radius 42
3-8 DefinitionofOverlapAreas a, P, y for Printer Model 42
3-9 IdealDotwithoutDot-overlap 44
3-10 Actual ConsiderationwithCircularDot-overlap 45
3-11 Practical Available WindowforError Diffusion 45
4-1 RampHalftonedwithFL 47
4-2 LenaHalftonedwithFL 48
4-3 ErrorDiffusionwithPrinter Model(FP) 50
4-5 OriginalandHalftoned(FP)Ramp 52
4-6 Visual ErrorDiffusion(SU) 53
4-7 Images HalftonedwithSU(300dpi) 55
4-8 RampHalftonedwithSU(300dpi) 56
5-1 Midtone Areasof RampwithDifferentPrintingResolution(FL) 59
5-2 AdaptiveLinearCombiner 61
5-3 Visual-basedError Diffusion(FVO) 64
5-4 Images HalftonedwithFVO (300dpi) 66
5-5 Partof Lena Images(150dpi) 67
5-6 ShadowAreasof Ramp (150dpi) 68
5-7 Images HalftonedwithFV1 (300dpi) 68
5-8 Visual-based Error DiffusionwithPrinter Model(FPV0) 69
5-9 ImagesHalftonedwithFPV0(300dpi) 70
5-10 Images HalftonedwithFV1 (300dpi) 70
5-11 RampHalftonedwithFPV0andFPV1 (300dpi) 71
5-12 Comparison between FP andFPV1 (100dpi)with
PrinterParametersfor 150dpi 72
5-13 ComparisonbetweenFP andFPV1 (100dpi)with
PrinterParametersfor300dpi 73
6-1 Meanand Standard Deviation forLena( 150dpi) 77
6-2 MeanandStandard DeviationforHats( 150dpi) 77
6-4 Meanand StandardDeviation for Lena(300dpi) 78
6-5 Meanand StandardDeviation forHats (300dpi) 78
6-6 Meanand StandardDeviation forRamp(300dpi) 78
6-7 MeanandVariation forLena(150dpi) 79
6-8 MeanandVariation forHats( 150dpi) 79
6-9 MeanandVariation forRamp (150dpi) 79
6-10 MeanandVariationforLena(300dpi) 80
6-11 MeanandVariationfor Hats (300dpi) 80
List ofTables
2-1 CategorizationofHalftoningTechniques 5
6-1 AlgorithmsforSubjectiveEvaluation 74
Chapter 1 Introduction
Themajorityofhard-copydevicescurrently inuse arebitonalthepixelsgenerated
are either "on"
or"off". Digitalhalftoningisnecessary fordisplayof gray-scale images on
such media as laser printers, in which the direct rendition ofcontinuous-tone images is
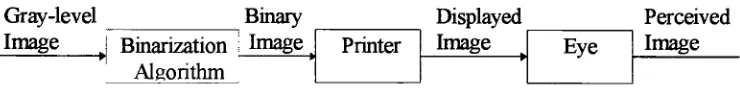
impossible. Digital halftoning is the process ofgenerating such a pattern ofbinary pixels
thatcreatestheillusionof acontinuous-toneimage. Figure 1-1 shows ablock diagramof
thehalftoningprocess.
Binary Gray-level
Image
J Binarization ; Image
Algorithm
Printer
Displayed
Image Eye
Perceived
[image:14.530.76.446.308.353.2]Image
Figure 1-1 DigitalHalftoning
The primary idea in halftoningisto represent acontinuous-tone gray level g (on a
scale from white = 1.0
to black =0.0) by a binary pattern in which the fraction of l's
(white pixels) is approximatelyg. Ifthe 0's are printed asblack spots and the l's areleft
as white spaces and ifthe distance betweentwo adjacent onesis sufficiently small,the eye
blends black dots and white spaces and perceives agray level approximately equal to g.
All halftoning techniques rely on the fact that the eye acts as a lowpass spatial filter.
Essentially, the eye perceives a gray level proportional to the number of white pixels in
printers, including model-based halftoning (Pappas and Neuhoff; 1991) and visual error
diffusion techniques (Sullivan, etal, 1991; Sullivan, etal, 1993). Then, we will develop
an algorithmbasedonthevisual model combinedwitha printer model.
Another important factor affecting the performance ofa halftoningprocess is the
behavior of the display device. Generally, most halftoning techniques assume that the
displayed dot consists ofidenticallyshaped blackorwhitedots, usuallyona rectangular
grid. However, most printers do not producetheidentically shaped rectangular dots, but
rather produce approximately circular dots that cover the rectangular pixel and hence a
dot locatedat one pixelmayaffectitsneighbors. Thisphenomenoniscalled"dotoverlap",
and will introduce significant gray-level distortion. For this reason, many halftoning
techniques are not suitable for printers. In this thesis, we will examine the printer model
(PappasandNeuhoff, 1995 and 1991)tocompensatetheeffect ofdotoverlap.
Mostalgorithmsdonot explicitlyemployan eyemodel ofthehumanvisual system
andthusresultin somewellknownartifactsand asymmetries(PappasandNeuhoff, 1991
and 1995; Ulichney, 1987). Visual error diffusion (Sullivan, etal, 1991; Sullivan, etal,
1993) incorporates an approximate inverse filter for this visual averaging and results in
better performance than standard error diffusion. In this thesis, the proposed technique
usesvisual averagingto filterthedifference between inputand binary output over a small
area and adjusts the correction factors ofthe error filter based on this filtering error. In
this way, the local mean error due to visual averaging is minimized and some unexpected
patterns are changed. The techniques developed here eliminate some artifacts associated
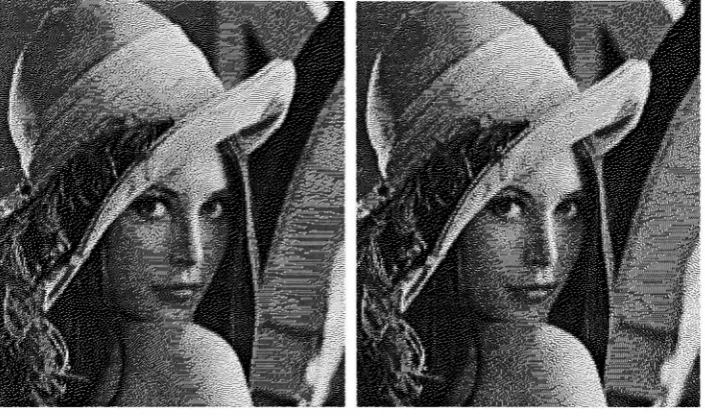
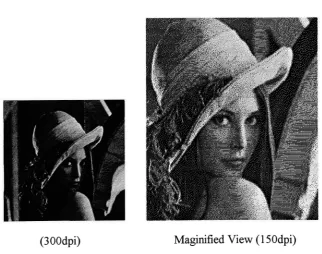
imagein Figure 1-2 (sameasFigure 5-5) andtheirreduction inthe same area inthe right
image.
[image:16.530.87.440.120.330.2]Standard Error Diffusion Visual-based Error Diffusion
Figure 1-2 Comparison Between Standard Error DiffusionandNew Technique (150dpi)
We will examine an eye model based on estimates of the spatial frequency
sensitivityoftheeye constructed byMannosand Sakrison (1974).
Though many quantitative and qualitative criteria can be used to evaluate the
process ofhalftoning images,the subjective criteria cannotbeneglected. Inthisthesis, we
willaskviewersto evaluateseveral algorithms associatedwiththestandard errordiffusion
withtheFloydand Steinbergfilter(1976).
The remainder of this thesis is organized as follows: Chapter 2 discusses the
standardtechniques forhalftoning. Chapter 3 describes two models ofthe eye and printer
model-basedhalftoningandthe application of eye model invisualerror diffusion. Chapter
5 describesthe proposed algorithms, theirimprovement overthe standard error diffusion
and their comparison withthe model-based halftoning. Chapter 6 presents the results of
psychophysical tests that show subjective evaluation for algorithms mentioned above.
Chapter7is asummary,including adiscussionoffuturework.
One special note concerning the images that are included in the thesis should be
mentioned here. These images are original laser printer outputs and cannot be photo
copied with current systems without significant degradation. They illustrate the
characteristics of a particularlaserprinter and demonstratetheperformance ofthevarious
halftoning techniques. Electrophotographic copies ofthese plates may severely spoil the
characteristics ofthe printed images. For example, copied images may exhibit different
tone reproduction, which refers to the relationship between the luminance ofinput and
output, andhencemaycause misunderstandingaboutthe tonereproduction ofhalftoning
for printers. Most ofthe images are printed at resolutions of300dpi or 150dpi. These
printing resolutions are the same as used in many image processing software packages
Chapter 2 Standard
Halftoning
Techniques2.1 Classification of
Halftoning
TechniquesDigital halftoning is the process of transforming a continuous-tone image to a
pattern of black and white pixels which can be printed to produce the illusion of a
continuous-toneimage, dueto the eye'slack ofhigh-frequency resolution. The processis
necessaryto reproduce imagesusinghard-copy devicesthat can produce pixelswith only
two possible brightness values. Table 2-1 shows the classification of conventional and
popularhalftoningtechniques. Thesetechniquesaredescribed below.
HalftoningTechnique Typeof Pattern
Typeof
Operation
Typeof "Dot"
Screening Random-dot aperiodic point dispersed
Clustered-dot periodic point clustered
Dispersed-dot periodic point dispersed
Error Diffusion aperiodic neighborhood dispersed
StochasticScreening periodic point dispersed
Table 2-1 CategorizationofHalftoningTechniques
There is a choice of computational complexity. A point operation in image
processing refers to an algorithm whichproduces output for a given locationbased only
Pointoperations havetheadvantage of simple computation. Screeningis anexample ofa
point process. Aneighborhoodoperation calculatesthevaluebased onthe grayvalues in
a neighborhood, and generally requires more complicated computation, but produce
higherqualityresults.
Section 2. 2 to 2. 4 describe the different halftoning techniques respectively in
moredetail.
2.2
Screening
In screening, the two-dimensional image is compared, pixel by pixel, with an
image-independentthreshold matrix; the result ofthe comparison is abinary output. The
usual convention is that the maximum value (e.g. 1.0) is white and the minimum value
(e.g. 0.0 ) isblack; forpixelswithgrayvalueoftheimage larger thanthe thresholdin the
threshold matrix, the binary output iswhite; otherwise, the binary output is black. There
are manyways to generate the matrix ofthresholds. The randompattern ofthresholds is
called random screening. Whenthe thresholds are periodic, the method is called ordered
screening. The threshold matrix is specified by one period of a grid which is generally
rectangular or hexagonal. Two different types of screens commonly are used. One is the
clustered-dot screen where the thresholds are arranged so that they produce clusters of
black dots. The other is dispersed-dot screen where the thresholds are arranged so that
theyproducedispersed blackandwhitedots.
Screening is a simple but effective technique for reproducing the illusion of
techniques isattributedto theirsimplicityand ease ofimplementation. Inthefollowing, we
usethepractical examplestodescribethedifferentscreeningmethods.
2.2.1 Random Screening
In the random screening, the thresholds are randomly generated. Because all
frequencies arepresent, low-frequencyartifacts are visible andthe
resultingimages appear
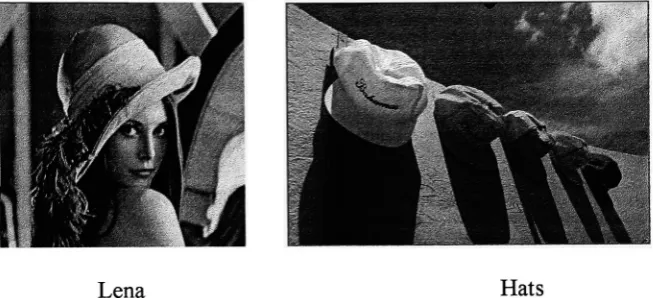
noisy. Figure 2-1 showstwo images halftonedwith the random screening. The quality of
outputfromthismethod makesitoflittlepracticalvalue.
Lena Hats
Figure 2-1 Images HalftonedwithRandom-dotScreen(300dpi)
2.2.2 Clustered-dot Screening
This technique for digital printing is designed to simulate traditional analog
halftoningtechniques used for many years in printing. The main advantage of
clustered-dot screening is that it produces images that are very robust to dot overlap and other
printer distortions. As will be shown, the higher thresholds are centered in the screen
consists of a central black dot that increases in size and forms a macro-dot as the gray
value ofthe neighborhood decreases. Whentheink dots are printedin clusters or
macro-dots, most ofthe black dots overlap other black dots rather than white spaces. Thus
changesin apparent graylevel due to dot overlap areminimized, andtheaccuracy ofthe
gray-scalerendition of theprintedimage ismaintainedinsome extent.
The macro-dots are formed by choosing the elements ofthe threshold matrix so
that they increase towards a fixed point. Figure 2-2 illustrates a such screen. In this
threshold matrix, the thresholds in the upper left and lower right quadrants increase
toward themaximumthreshold0.969andform blackmacro-dots. The spacingofthe dots
is fixed. Darker regions of an image result in even bigger macro-dots. This is precisely
howtraditional analoghalftoningworks.
0.576 0.635 0.608 0.514 0.424 0.365 0.392 0.486
0.847 0.878 0.910 0.698 0.153 0.122 0.090 0.302
0.820 0.969 0.941 0.667 0.180 0.031 0.059 0.333
0.725 0.788 0.757 0.545 0.275 0.212 0.243 0.455
0.424 0.365 0.392 0.486 0.576 0.635 0.608 0.514
0.153 0.122 0.090 0.302 0.847 0.878 0.910 0.698
0.180 0.031 0.059 0.333 0.820 0.969 0.941 0.667
0.275 0.212 0.243 0.455 0.725 0.788 0.757 0.545
Figure 2-2 Clustered-dot Matrix(Classic-4) (Dong, 1992)
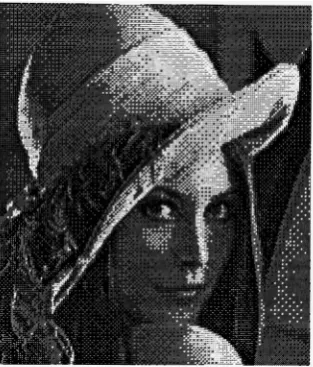
Figure 2-3 illustratesthe robustness of clustered-dottechniques. It showstwo test
printer with afairamount ofdotoverlap. Theclustered-dot screens aregenerallypreferred
for printing inthepresence ofdotoverlap.
IIP
vg&Sm
mm
V
fm8S&tm&&M&hsssm
Lena Hats
Figure 2-3 Images Halftonedwiththe"Classic-4" Screen(300dpi)
Althoughtherendition ofgraylevelsmaybereasonablymaintainedinthe clustered
dot approach, the methodhas serious drawbacks. Theimages inFigure 2-3 appear alittle
blurry in the edges such as in the hat bands in Lena and the letters on the largest hat in
Hats, and the details such as the hair in Lena. Also, the macro-dots ofthe clustered-dot
techniqueare more visibleand unpleasanttotheeye. Weusuallyreferto suchpatterns as
low-frequencyperiodic artifacts. Astheperiod ofthescreenincreasessothat morebitonal
dots are available, the number of gray levels that can be generated increases, but the
perceived spatial resolution decreasesbecausethe macro-dotsbecome more visible. Thus
thereisatradeoffbetweenthegray-scale resolution andthe severityforthe low-frequency
periodicartifacts.
Finally, even though the clustered-dot approach minimizes the effects of dot
halftoned Ramp images. Practically, the original Ramp image is also halftoned. The
original Ramp is halftoned with a clustered-dot screen and printed at a resolution of
600dpi. But, thehalftoned processforthis originalimage may include edge enhancement
andtonalcalibration. It seemsthat thenumber of gray-levels intheRamphalftonedwith
the "Classic-4" screen is reduced becausethe tonal stepping is visiblein Figure 2-4. The
halftonedRampdoes not accurately reflectthe originalgray levels. The effects ofprinter
distortionmay stillbe apparent,though ittypicallyisrelativelysmall and canbe corrected
usingdirectmeasurement of printedimage(Lin andWiseman, 1993; Rosenberg, 1993) or
a printer model(Pappas andNeuhoff, 1991 and 1995).
original
Halftonedwiththe"Classic-4" Screen(300dpi)
Figure 2-4 OriginalandHalftoned (Clustered-dotScreen) Ramp
2.2.3Dispersed-dotScreening
In dispersed-dot screening, the threshold matrix is designed to maximize the
higherthresholdvalues are scatteredthroughoutthe pattern, causing small dispersed dots
toincreaseinnumber asthesignal decreases.Figure 2-6 showstwoimageshalftonedwith
thisdispersed-dotscreen.
0.513 0.272 0.724 0.483 0.543 0.302 0.694 0.453 0.151 0.755 0.091 0.966 0.181 0.785 0.121 0.936 0.634 0.392 0.574 0.667 0.180 0.423 0.604 0.362
0.060 0.875 0.211 0815 0.030 0.906 0.241 0.845
0.543 0.694 0.694 0.453 0.513 0.272 0.724 0.483
0.181 0.785 0.121 0.936 0.151 0.755 0.091 0.966 0.664 0.423 0.604 0.362 0.634 0.392 0.574 0.332
0.030 0.906 0.241 0.845 0.060 0.875 0.211 0.815
Figure 2-5 Dispersed-dot Matrix(Bayer-5) (Dong, 1992)
Lena Hats
Figure 2-6 Images Halftonedwiththe
"Bayer-5"
Screen(300dpi)
The method increases the apparent spatial resolution ofthe printed images and
minimizes the low-frequencyperiodic artifacts. The comparisonbetween Figure 2-6 with
Figure 2-3 shows that the technique suffers major degradation in gray-scale rendition.
objectionable low-frequency periodic artifacts than the
"Classic-4"
screen (Dong, 1992).
From Figure 2-6, the false textural contouring seems to be apparent in the sky in Hats.
Textural contouring is the phenomenon in which a slight variation ofthe gray level in
smooth areas often resultsintheformationof an artificial contour, simply becausethe dot
pattern (texture)has been changedlocally. Thereason is apparentfrom Figure 2-7 which
includestheoriginalRamp and halftonedRamp imageswiththe clustered-dot screen and
the dispersed-dot screen. In the halftoned Ramp with dispersed-dot screen, the textural
patterns for some close gray levels are visibly different. Textural contouring is a very
serious problemforthedispersed-dottechnique.
original
Halftonedwiththe"Classic-4" Screen(300dpi)
Halftonedwiththe"Bayer-5" Screen(300dpi)
2.3 Error Diffusion
In error diffusion, theimage pixels are also comparedwithathreshold. However,
inthiscase, the thresholdis fixedandthegrayvalue of eachimagepixelismodifiedbefore
thresholdingbasedonthepreviousimagepixels.
Thescreeningtechniquesjust considered illustrate"point operations"; that is , the
binary output depends only on the gray value ofthe specific input pixel. Error-diffused
halftoning, first introducedbyFloydand Steinberg (1976), isanadaptive processbasedon
a neighborhood of pixels. In this operation, the threshold is fixed. Error between the
corrected gray-level input and its binary output is passed through a spatial filter to
produce a correction factorwhich is added to the subsequentinput value. It is clear that
theresult ofthe operationdependsonthepixel values inthe neighborhood andtheerrors
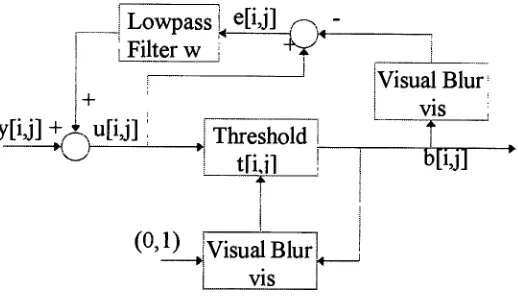
arediffusedovertheentireimage. Aschematicfortheprocessis shownin Figure 2-8.
y[y] +^-, u[U] Threshold
t
b[ij]
Lowpass ^_
Filterw
e[i,j]
We assumethat the image is scanned from left toright andtopto bottom. In this
figure, y[ij] representsthe [ij] pixel ofthe continuoustone gray-scaleimage. The binary
outputb[Lj] producedbyerrordiffusion isobtainedbythefollowing set ofequations.
u[i,j]=y[i,j]-w[i,j]*e[Lj] (2-1)
fLO, if u[i,j] > t
b[i,j]H (2"2>
[0.0, otherwise
e[i,j]=b[i ,j]
-u[i,j] (2-3)
where u[i,j] is the corrected value ofthe gray-scale image. The error e[i,j] at a specific
pixel [ij]is definedasthedifference betweenthe corrected gray-scaleinputandthebinary
output. The previous errors are lowpass filtered with and subtracted from the current
image value y[ij] before thresholding to obtain the binary value b[ij], where w is the
impulseresponseofthelowpass filter.Thus, errors are
"diffused"
overtheimage.
Thethresholdttypicallyis fixed atthemidpoint ofthe gray-scale range, e.g. 0.5.
The lowpass filter w has non-symmetric half-plane support, so that only the already
computed errors are filtered. This is the two-dimensional equivalent of"causality", and
enables the algorithmtomake instantaneousdecisionsat each point. Thus, error diffusion
requiresonlyone passthroughthedata. Thefiltercoefficientsare positive and theirsumis
equalto onetoensurethat themeangrayvalueispreserved.
Various error diffusion filters have been suggested in the literature (Ulichney,
1987). In our experiments we will use the filters proposed by Floyd and Steinberg (FL)
(1976), Jarvis, Judice andNinke (JA) (1976). The impulse response are shownin Figure
, , .
, _
pixelbemgprocessed -*
1 5
16 16
16 3
16
Figure 2-9 FloydandSteinbergError Filter(FL)
Lena Hats
Figure 2-10 Images HalftonedwithFL(300dpi)
Figure 2-1 1RampHalftonedwithFL(300dpi)
pixelbeingprocessed
1_
5_
48 48
J_
JL
1-48 48 48 48 48
J_
J_
J_
_3_J_
48 48 48 48 48
Lena Hats
Figure2-13 Images HalftonedwithJA(300dpi)
Figure 2-14 RampHalftonedwithJA(300dpi)
From Figures2-10, 2-11, 2-13 and 2-14, the effects ofthe errorfilters are visible.
Images are sharpened such as the hair details in Lena and especially the letters on the
largest hat in Hats. Several gray levels are represented by a pleasingly isotropic
structureless distribution. Thetextural contouring connectedwith dispersed-dot screening
is greatly reduced. However, some disadvantages also are apparent; such as correlated
artifacts in many of the gray-level patterns and directional overshoot in highlight and
shadow areas. One more conspicuous artifact for printed images with FL is that the
regions in the midgray suffer from the most serious gray-scale distortion. Actually, the
without "dot-overlap". It is this shortcoming that producesworm-like artifacts in images
such asthefaceonLenain Figure2-10.
The halftoning process with the error filter shown in Figure 2-8 is called the
"Minimum AverageError"
algorithm. The larger filterreduces some ofthe artifacts seen
with the four-element filter shown in Figure 2-9, but directional overshoot in highlight
and shadow regions increases and black pixels are clustered together in the midgray
regions. Of course, theerrordiffusionwithJAalso sharpensthe picture more. For digital
printing with device having a fair amount of dot-overlap, the error diffusion with JA
rendersbetter halftoned imagesthantheerrorfilterofFloydandSteinberg.
The above discussion demonstratesthat error diffusion is very sensitiveto printer
distortions such as dot overlap. Inthe presence ofdot overlap, error diffusion produces
verydark imagesshowninthesefigures. Thishas limited itsapplicationtocaseswhere no
dotoverlap occurs, suchasCRTdisplays.
2.4 StochasticScreening
In stochastic screening, the two-dimensional image is compared, pixel by pixel,
with an image-independent threshold matrix; the result ofthe comparison is a binary
output. Thoughthe halftoneddotpatterns with either stochasticscreening(Ulichney, 1987
and 1993; Yao and Parker, 1994) or random screening all appear to be random, the dot
patterns resulting from random screening have the characteristics of white noise and the
patterns with stochastic screening have the characteristics of blue noise, which is more
frequencies; the power spectrum of blue noise shows that most of its power is
concentrated in the high frequencies. Figure 2-15 illustrates the difference between the
spectraof white noise andblue noiseinthe frequencydomain. The plot was produced in
thefollowingway: a 256 x 256 pixel patchwitha constant graylevel of0.97 (white=1.0
and black=0.0) was halftonedrespectivelywith a random screen and a stochastic screen,
and the power spectra of the two halftoned patterns on a radial line were computed.
Because ofits characteristics in frequency domain, stochastic screening is often called
blue-noisemasking.
1.0
-
0.9-'-. /\ /. I
., ., .... f\
0.8-E = 0.7-Bluenoise OJ S 0.5-o Q. VOA TS
S0.3-
l
Whitenoise
0.2-/>
v ^N
-vy w
0.1-
/
0.0- 1 1 1 1 I 1 1 1 1 1 1
RadialFrequency(1/mm)
Figure 2-15 Power SpectrumofBlue NoiseandWhite Noise
The higher thresholds in the stochastic screen also are scattered throughout the
screen, causing small dispersed dots to increase in number as the signal decreases. This
technique can eliminate the periodic structure often presented in halftoned images
intensive, but the subsequent halftoningprocess is as easyto perform asthe conventional
screening methods. Therefore, stochastic screening has the advantages of simple
halftoning computation and a visually pleasing pattern. Figures 2-16 and 2-17 show the
images halftonedwiththeblue-noisemask.
These halftoned images show that they do not suffer from periodic artifacts or
textural contouring connected with dispersed-dot screening. The halftoned images
producedwith stochastic screening appear to be somewhat noisier thanthose from error
diffusion. Because halftoning with a blue-noise mask also produces dispersed dots, the
images halftonedwith thismask will exhibit the seriousgray-levelartifactswhen printed
withdevicesexhibitingdot overlap.
Lena Hats
Figure 2-16 Images HalftonedwithBlue Noise Mask(300dpi)
2.5 QualitativeAspects of
Halftoning
PerformanceThe halftoning reproduction of a gray-scale image should resemble the original
when viewed under appropriate conditions. When choosing a halftoning technique, we
wish maximizethesimilarity betweenthehalftonedimageanditstarget. Twoquestionsto
be answered are: how to evaluate the quality of halftoned images and compare the
performance of the techniques? Analysis based on traditional root-mean-square error
(Watson, 1993) has been shown to be incapable of explaining all visible differences
between two images. In this thesis, we use two methods to evaluate the quality of
halftoned images. The qualitative measures(PappasandNeuhoff, 1995) are coveredhere.
Thesecond method uses psychophysicaltests.
2.5.1. RegionofConstantGrayLevel
The two most important measures of success of a halftoning method are tone
reproduction,e.g. the accuracy ofgray-levelrendition, andthe severityoflow-frequency
periodic artifacts. A halftoned image is desired to have the same number of"apparent"
graylevelsas presentedintheoriginal. Conventionally,whenusedin imagehalftoning,the
halftoning screen determines how many gray levels can be rendered. Ifthe screen has a
size of MxN, this approachallowsonlyalimitednumberofgraylevels (MxN +1) to
bereproduced.Underthese cases, ifthenumberofMxNisnot adequateto representthe
gray-level range ofthe image (coarse quantization), a false contour may be formed. The
most visible example is that of an image afterthresholding by afixed gray value (lxl
(left) andtheimagealreadyshowninFigure 2-3 (right). Theleft-hand image exhibitsfalse
contoursintheshoulder area andthe area abovethehat becausethe screen usedcanonly
renderthe 19 graylevels; buttheright-hand image doesnot exhibitvisiblefalse contourin
the same areasbecause the "Classic-4" can reproduce more gray levels(33). But, for the
conventionalalgorithms, more seriouslow-frequency periodic artifactswillbe introduced
if thesize of a screenis increasedtoobtain moregraylevels. Thecomparisonbetweenthe
two images in Figure 2-18 shows that the right-hand image exhibits more visible
low-frequencyperiodic artifactsbecausethe size ofthe"Classic-4" screenis largerthanthat of
the screen usedforthe left-hand image. Therefore, for conventional algorithms, there is a
tradeoffbetweengray-scale resolution andlow-frequencyperiodic artifacts. Clustered-dot
screeningproducesthemost seriouslow-frequencyperiodic artifacts.
A Screenwith 19GrayLevels
"Classic-4"
with33 GrayLevels
Figure 2-18 Images HalftonedwithClustered-dotScreens(300dpi)
Error diffusion does not produce periodic patterns. In the absence of printer
distortions, the number ofgray-levels it produces is essentially the same as that in the
halftone an image composed of a constant
gray level, it will render the same gray level
because ofits
property preserving the mean. Stochastic screening , the newly developed
method, also introduces no periodic artifacts because it produces the isotropic
structureless patterns.
[image:35.530.197.354.241.425.2]2.5.2Region ofSlowly ChangingGrayLevel
Figure 2-19 Partial MagnificationofLena in Figure2-6 (150dpi)
When gray level changes smoothlyover alargeregion, theperceivedgrayvalue of
the halftoned output should not change abruptly. Ifthis happens simultaneously along a
contour of constantimagegraylevel, thecontour appears as anedge. As stated in section
2.2.3, the phenomenon is called textural contouring. Normally, digital halftoning
algorithms produce varied textures for different rendered gray levels. Ifthe patterns for
the similargray levels arevisiblydifferent andboth patterns meet in a
area in an image, undesirable
contouring artifacts may be introduced. Figure 2-19 shows
textural contouring on the left part offace and hat ofLena. Dispersed-dot screening
causedthemost serioustexturalcontouring.
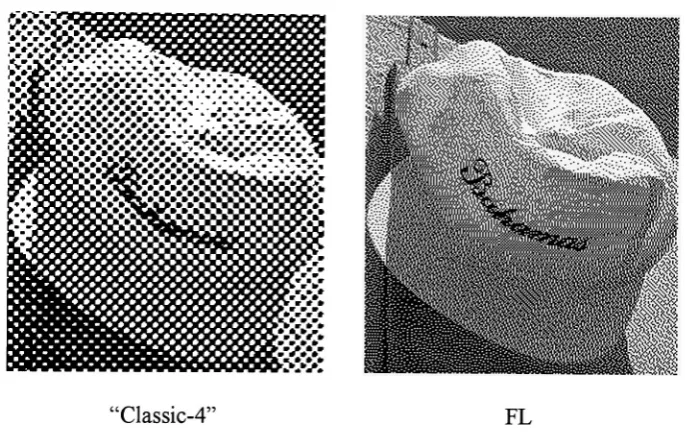
2.5.3 Region of Rapidly ChangingGrayLevel
"Classic-4r
FL
Figure2-20 Partial MagnificationofHats in Figure2-3 andFigure2-10 (100dpi)
The spatial resolution of a halftoned image also is a primary concern. High
resolutionwhichproduces sharpened continuous edges andfinedetails, ishighlydesirable.
Foredgesinahalftonedimage, itwouldbeadvantageous ifthehalftoningalgorithm could
produce a compact set of printed spotsdistributedalongthe edges andboundaries. Thisis
particularly important when the halftoned image includes text characters (not white or
[image:36.530.84.428.210.429.2]alongeitherthe edge ofhatsortheboundariesofletters becausethedotsaretoolargeand
thespacebetweenthedotsarefixed;butthedots in right-hand image can. Forthis reason,
the left-hand image exhibits blurred edges and details and the right-hand image has
sharpened edges and clear letters. In the region of rapidly changing gray level, the
perception of blurred and sharpened edges should be evaluated. One of the main
disadvantages of clustered-dot screening is that it blurs images. But, dispersed-dot
screening, errordiffusionand stochastic screeningrendersharperhalftoned images.
2.5.4 Performance WhentheOutput Device Is aPrinter
Normally, both screening and error diffusion assume that pixels are identically
shaped dots on positioned rectangular grids. However, printers produce approximately
circularblack spots on white paper and exhibit dot overlap. Figure 2-21 showsthe
dot-overlapphenomenon.
windowWl windowW2 Actual Dot
This physical property causes a black pixel to affect its white neighbor(s), and
distorts the linearity and even the monotonicity ofthe perceived gray scale of output
image. In other words, the gray level is not proportional to the number of white pixels
over a small area and small areaswiththesame number ofwhitepixelsmay have different
average gray values. Ifthe dot is so smallthat a single pixel can notbe recognized, the
eye perceives an average gray level over a small area like 3x3 window. Ideally, the
averagegraylevelgof windowWl andW2 inFigure 2-21 shouldbe
Z
(ona scale white= 1
.0 toblack
=
0.0); butactually, gisnot equalto
X
. Thoughboth Wl andW2inFigure2-21 include two black dots, they have different grayvalues because they have different
white-area (orblack-area) percentages. The phenomenon will be discussed quantitatively
in section 3.2. Halftoning methods to be used for printing should be re-examined to
determine whether and to what degree they resist this kind ofdistortion. Clustered-dot
screening can resist the distortion quite well. Figure 2-22 shows simple patterns for
dispersed-dot and clustered-dot patterns. In the clustered-dot pattern, most black dots
overlap other black dots rather than white spaces; On the contrary, in the dispersed-dot
pattern, the black dots overlap white spaces rather than other black dots. Therefore,
dispersed-dot pattern is more sensitive to dot overlap. Dispersed-dot screening, error
diffusion, andstochastic screening producedispersed-dotpatterns andhence cannot resist
the dot-overlap distortion of laser or ink-jet printers. This is why the clustered-dot
windowWl windowW2 Actual Dot
Dispersed dot Clustered dot
Figure 2-22EffectsofDotOverlap onClustered-dot andDispersed-dot Patterns
2.6
Summary
In the absence of significant printer distortions ( i.e. for display on most binary
CRTs), the best ofthe currently used techniques for digital halftoning is error diffusion.
Thoughstochastic screening rendershalftoned imagesofslightlypoorerqualitythanerror
diffusion, itcombinestheadvantage of simple computation of conventionaltechniques and
thevisuallypleasing patterns of error diffusion. Screening is simpler but produces poorer
halftoned imagesthanerror diffusion. However, whenprintedby devices withsubstantial
dot overlap (such as laser printers), the clustered-dot screening schemes have been the
only available choice. As discussed, the clustered-dot approach is successful in reducing
the effects of dot overlap, but sacrifices spatial resolution and generates more
low-frequency periodic artifacts.
Model-based techniques can correct for the effects of dot overlap without
sacrificing spatial resolution or increasing low-frequency periodic artifacts. Actually,
resolution. Thekeytosuchtechniques isanaccurateprintermodel, whose parameters are
adapted to each individual printerby calibration. The introduction of an accurate visual
model can eliminate some worm-like and asymmetric artifacts. Before we deal with the
model-based halftoning and visual error diffusion, we first discuss the eye model and
Chapter 3 Eye Model and Printer Model
Two important factors must be consideredwhen predictingthe quality of printed
images: thehalftoningtechniqueused andthebehaviorofthe printer. Whenhumans view
an image, theyjudge its quality. Itis clear that the performance ofhalftoning algorithms
mustberelatedto theresponse ofthehumanvisualsystem (HVS). Indeed,theprocess of
halftoning requires that the human eye act as a lowpass filter. In this way, conventional
techniques implicitly employ the visual model. In this thesis, we will explicitly use this
HVS to avoid some artifacts to which the human eye is very sensitive. Printed images
exhibit gray-level distortion because ofthe "dot overlap"
and other factors. Traditional
techniques, such as clustered-dot screening, resist spatial degradation at the expense of
spatial and gray-scale resolution. Themethod wewill discusswill correct printerdistortion
depending on printer model, and meanwhile maintain both gray-scale and spatial
resolutions.
Before discussing some recently developed algorithms, we will describe the eye
model andtheprinter model inthe following sections. Both play importantroles in these
algorithmstobe described.
3.1. Eye Model
3.1.1.ConventionalEye Model
The perception ofimages by the HVS is difficult to describe. Many experiments
The simplestvisual modelincludes justa contrast sensitivityfunction(CSF)that is related
to thevariationsin visual sensitivityas afunctionof spatial frequency. The sensitivityS is defined as the inverse ofthe contrast of a square wave grating required to produce a
thresholdresponse:
S=
(3-1)
wherethecontrastC is definedas
c=Lmax-Lmin
^
max
min
and where Lmax and Lmin refer to the maximum and minimum luminance ofthe grating
intensity, respectively. A complex model may be composed of two parts: amplitude
nonlinearity and CSF. The amplitude nonlinearity describes the variations in visual
sensitivity as afunction oflight level; that is, the perception ofthe eye to changes in the intensity of illumination is nonlinear. This nonlinearity account for Weber's law, which says that the smallest noticeable change in intensity is proportional to the intensity.
Commonly, the intensity is represented as a logarithm or power law. A more complex model also includes detection mechanism (Daly, 1992), which describes the variation in visual sensitivity as a function ofsignal content. It is beyond the scope ofthis paper to
review these results in detail. Instead, this thesis focuses on the contrast sensitivity function.
When viewing an image, the resolution limit of human eye ensures that the
"lightness"
of the printed image is averaged over a small angular extent. That is, the
is called the "contrast sensitivity function", which is a function ofthe spatial frequency
measuredincyclesper angular degree. Empiricallymeasured contrast sensitivityfunctions
vary due to different viewing conditions. Various approximations have been used in the
literature to representthe CSFthrough an analytic expression. Inthis thesis, we consider
thefollowingtypicalCSFconstructedbyMannos and Sakrison(1974).
H(fr)=2.6
(0.0192+ 1.1 145 fr) exp(-(1.114
QL1
) (3-3)
where fr istheradialfrequencyincycles per angulardegree.
This curveis shown in Figure 3-1 and peaks at about 8 cycles per degree; other
empiricalCSFs exhibit maxima atfrequencies intheinterval 2-10 cycles per degree (Jain,
1992). The peak valuesvarywithviewers. Equation (3-3) represents a formofbandpass
filter. The decrease in sensitivity at high frequencies is generally ascribed to the optical
characteristics oftheeye(Netravali andHaskell, 1988) such astheresolution limitsofthe
optical processing in the lens. It is the attenuation ofthe high frequencies that is most
critical to halftoning. The decrease in sensitivity at low frequencies accounts for the
"illusionof simultaneous
contrast"
where a region offixedgray level appearsdarkerwhen
surroundedbyalighterregionthanwhen surrounded bya darkerregion. The decrease in
sensitivity at low frequencies also accounts for the Mach-band effect where the eye
perceives alighterbandonthelightside ofthe edge and adarkerbandonthe darkside of
0 24 7 811l3l6l3202i22729 3134363842 454751545B5BeOKa5B7ee
SpatialFrequency(cyde/Uecpee)
Figure 3-1 Contrast SensitivityFunction
3.1.2.Modified Eye Models forHalftoningImages
The conventional contrast sensitivity function describes the detectability of
sinusoidal signals on a uniform background, and can be used to predict the visibility of
signal on a near uniform luminous background. However, for images containing a lot of
visiblenoise(suprathreshold conditions), this assumptionmay notbe completelyaccurate
(Mitsa, 1992; Mitsa, et al, 1993). In threshold conditions, the contrast is defined as
thresholdresponseforasinusoidal pattern. Inthe suprathreshold condition, thecontrastis
defined as subjectively equal contrast for two stimuli such as two spatial sinusoidal
patterns. In halftoning applications, the noisy condition is typical. Halftoning may
introduceaunique combinationofdistortions, suchastextural contouring,resolutionloss,
coarse quantization contouring, and especially graininess. Therefore, the CSF must be
modified forthepresent environment. Thehigh-frequency drop off should notbe affected
by suprathreshold conditions, because it is mainly due to resolution limits ofthe optical
limitsare notaffectedbyluminousconditions. Thefall-offatlowspatialfrequenciesis due
to lateral inhibition in theretina, i.e. lateral connections made
byhorizontal and amacrine
cells (a kind of a unipolar nerve cell) result in a reduction ofthe signal froma cell when
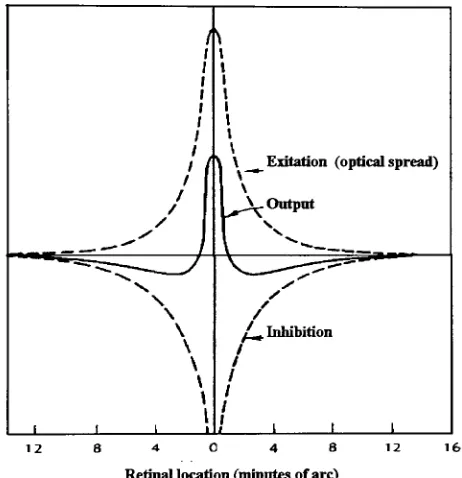
the neighboring cells are illuminated (Netravali and Haskell, 1988). Figure 3-2
(Cornsweet, 1970) represents the retinal state when a subjectlooksat a point of light.
Rotation (optical spread)
[image:45.530.145.376.211.450.2]Retinal location(minutesofarc)
Figure 3-2 The EffectsofaPointofLightontheVisual System
(TheVisual Point-spreadFunction)(Cornsweet, 1970)
The resulting spread of light from aberrations, diffraction, scatter in the retina, etc. ,
results in a light distribution onthe retina represented by the curve labeled "excitation",
whiletheresulting inhibition (which depends uponthedistribution oflight) contributes
Therefore this kind of decrease may be affected by noisy viewing conditions. The
increased excitationdue tonoise canleadto a reduction oftheeffect of cell inhibition for
low frequency signals, which suggests that the CSF is a lowpass filter rather than a
bandpass one (Mitsa, etal, 1993). Limb's experiments(1979)to evaluateimagequality
supportthisidea.
Further, wecan also address this issue from another viewpoint. Ifthe HVS has a
bandpassnature, thevisual model exhibits a reduced response to low spatial frequencies.
As a result, thelow-frequencyerror could bemoreeasilyintroducedto halftoning images
thanwiththemodelderived from lowpass filter. However,what appears aslow-frequency
error at one viewing distance is higher-frequency error at a larger viewing distance,
possibly occurringwheretheluminanceresponseofthehumanvieweris largest. Thus, the
use ofthe bandpass model causes halftoning to be sensitive to viewing distance. Ifthe
nature oftheHVSisconsideredto belowpass, thespectralenergyofperceived signal will
tend todecreasemonotonicallywithincreasingfrequency. Therefore, theperceivedquality
of the halftoned image will increase steadily with increased viewing distance, which
conformswith practical situations. Hence,thefactthat theeyeisnot sensitivetovery low
frequencies does not have to beused. From this discussion, we could conclude that it is
thelowpasscharacteristicoftheeyethatallowshalftoningtowork.
Based onthisdiscussion, equation(3-3)maybemodified asthefollowing:
J2.6(0.0192+1.145fr)exp( -( 1.114fr)1]), fr2>f
^
wheref^isthefrequencythatcorrespondsthemaximum value ofH(Q.
\
E
<05- 1"-e
OS
03-\.
e.*79 111316tt20222527293l3<362e4245474S5<55S5B6063E66rEB
SpatialFrequency(cydeMegree)
Fig3-3 Modified ContrastSensitivityFunction
Another important fact is that the human eye is more sensitive to horizontal or
vertical sinusoidal patterns than to diagonal ones. Specifically, it is least sensitive to
sinusoids oriented at 45, with the difference in sensitivity being about 0.6 dB at 10
cycles/degree and about3 dB at30cycles/degree. Itisclearthat the two-dimensional CSF
is a function ofthe viewing angle. By Daly (Sullivan, etal, 1993), the radial frequency
willbenormalizedbyanangulardependentfunction, s(9[Lj]) , suchthat
fliJ]=
^T^
(3"5)s(Q[i,jD
where: s(0[i,jTj=
ii^cos(40[i,j])
+^^-
(3-6)e[i,j]=arctan(
-) (3-7)
3.1.3. Extraction ofDiscrete Visual Blur Filter
In practical digital modeling applications, a finite impulse response (FIR) visual
filter is employed. Infact, the response ofhumaneyeto one imagemay connectwith the
perception to the former images. But, FIR is inherently stable; in addition, the finite
wordlength ofinfinite impulseresponse(IIR) is complicated. The finitewordlength refers
to thefiniterepresentationofthecoefficients and componentsforaIIR. Forthehalftoning
techniques discussedin thelater chapters, a discrete-spacemodel ofthe folowingform is
required:
p[i,j]=WIN(d[k,l]) (3-8)
whered[k,l] are samples oftheinputimage, thep[i,j] isthe set ofvisualfilter outputs, and
WIN(.) is some sliding-windowfunctionk= i
-m, ..., i + m and1 =
j
-m, ...,j+m (m is a
non-negative integer). Fromequation(3-8),wehave,
p[ij] =
vis[i,j]*d[i,j] (3-9)
where vis[i,j] is an eye filter in spatial domain and * denotes convolution. Clearly, our
purpose is to obtain an expression for the impulse filter ofhuman eye which has finite
support.
The CSF can be represented inthe space domainby a linear shift-invariant filter.
kindof error excitesthisfilter. TheCSFitselfspecifies onlytheamplitude spectrumofthe
filter; to uniquely determine the filter we assume that it introduces no spatial phase
variation. The spacing betweenthe adjacentdiscrete frequencycomponents is determined
by the sampling frequency in the spatial domain. The sampling in the spatial domain is
already determinedby the printingresolution R (dpi) (not the printer resolution) and the
viewdistance. Figure3-4 shows the geometry for converting frequencyunits. Assume
Figure 3-4 TheGeometryforConvertingFrequencyUnit from
cycles/inchestocycles/degree(Lin, 1993)
that thesamplenumberisN, andthat thefrequencyinterval space ofCSFis Af = R/N.
Whentheviewing distanceis dmm, ,thespatialfrequency f[i,j] incycles/mmisrelatedto
theangularfrequency fr[i,j] incycles/degree:
fr[i,j] =
2dtan(0.5)fli,j] (3-10)
Thefrequencyintheverticaldirectionis
fr[i,j] =kAf
x 2dtan(0.5)=2kdR/N
Thefrequencyinthehorizontal direction is
fr[i,j] =1 Af
x2dtan(0.5)=2
1 dR/Ntan(0.5) (3-12)
where k and1referto the[k,l]-thcomponentinthefrequencydomain.
From the transformed human visual model in the spatial domain, we can extract
the desired filter. Fora practicalcalculation, weconstruct afilterof size of5 x 5 or 7 x 7 that will capture the central character ofthe CSF filter in spatial domain. Figure 3-5 is typicalimpulseresponse ofthe CSF of
Mannos'
model(Mannos and Sakrison, 1974)for theprintingresolution of300dpi.
* 1
<L1
f* o
VerticalDistance (1/18 mm)
HorizontalDistance (1/18 mm)
The CSF filter can be applied to the error diffusioncalculation to minimize some
artifacts. Two such methods are the visual error diffusion (Sullivan, et al, 1993) and
visual-basederror diffusion developed inthis thesis. Thesealgorithms are discussedinthe
laterchapters.
3.2. Printer Model
Printers have manyeffects on theresultingimages. Themost visibleeffect maybe
the distortion ofthe output gray levels. The purpose of a printer model is to predict the
gray levels (luminance) produced by a printerto compensatefor suchdistortion. Agood
printer model requires that some important factors affectingthe behavior of printers be
understood.
The function of a printeris to lay down black ink dots at designated locations on
paper; the locations usually are specified by a Cartesian grid. There exist two types of
printers: write-black and write-white. This thesis deals
only withthe write-black printer.
Therearemanyreasons connectedwiththedistortionofgraylevels, suchasthespreading
ofthelaserbeam, interaction ofthe laserandthe charge applied to the drum, thetype of
toner particlesused, andthe heat finishing. Some otherfactors that affect a printed image
arethequalityandthe typeof paperused, theinteraction between inkand paper etc. The
discussionaboutthesefactors isbeyondthe scopeofthethesis.
"Dot overlap"
is an important cause ofthe distortion in gray levels. Figure 3-6
showsmeasurementsofthedotarea ofprinter output vs. theprintingresolutionfortheTI
resolution used in image processing software packages such as Adobe Photoshop. The
target imagesarecheckerboard patternpatches(50% black area and50%white area). The
dot areas of printed patches with different printing resolution were measured with a
PlateMaster made by Beta Industries. The PlateMaster is a black and white reflection
densitometerwith uniquecapabilities. Itnot onlymeasures alltypes oflithographic plates,
with either conventional or stochastic halftone images, but also measures conventional
photographic and print materials. The simple instrument first measuresthe reflectance of
the printed patches andthen automatically converts itto dot area percentage. This graph
reflects the gray-level distortion exhibited by printed images. The ideal dot-area
percentage should remainunchanged at 50%. The gray-leveldistortion isthecombination
of dot overlap, interaction among light, ink, and paper etc. The graph illustrates that
different printers mayhave different degree of
"dot-overlap"
andthe dot-area percentage
increaseswiththeincreaseoftheprintingresolution.
o
o
Q
-+ TIMICO 600dpi Printer
HP LJ IV600dpiPrinter
1 50 200
PrintingResolution
Now, we face the issue ofconstructing a proper model ofthe printer. For the
specific printer,theperfect model should completelyoffsettheeffect ofprinterdistortion.
However, this result cannot be easily achieved because of various practical limitations.
Generally, two kinds oftechniques are usedto build a printer model. The first one relies
on the mathematical formulation of the physical behavior of printers. The second is
through practical measurement for printed images and construction ofthe look-up table.
Two methods forusing a printer modelin the halftone process: one approach is the
so-called precompensation method for modifying the input level through look-up tables
before halftoning. This method is computationally efficient. However, for different
algorithms, the look-up tables built from the practical measurement are different. For
example, the dispersed-dot screening and error diffusion exhibit the different degrees of
gray-level distortionandhencerequiredifferentlook-uptables. Theselook-up tablesmust
be pre-stored in printers and require a lot of memory. The other is to incorporate the
printermodelintothe available algorithmthatcan be formedanintegrated algorithm. The
method causes the computation tobe more complicated, but is easier to implementwith
simple printer parameters. In this thesis, we will employ the first technique to build a
printermodel andthesecondapproachtousethemodel.
3.2.1 CircularDot-OverlapModel
This kind of model was developed by Pappas and Neuhoff(1991), who modeled
that affect them. In this model, each ink spot is assumed to be circular with a uniform
distributionof ink.
Inthefollowing description, we introduce some notation. Abinary image b[i,j] is
printed, ifb[i,j]=
0.0 (black);no spot isprintedifb[i,j] = 1.0 (white). As
a result ofprinter
distortions, thegray levelp[i,j] produced inthevicinity depends insome complicated way
onb[i,j] andtheneighboringpixel values. Theprinter modeltakes theform:
p[i,j]=P(WIN[i,j]) (3-13)
whereWIN[i,j] isthefiniteneighborhood of values ofb[i,j] anditsneighbors(Figure 3-7).
Thisisthemost generalformoftheprintermodel of PappasandNeuhoff.
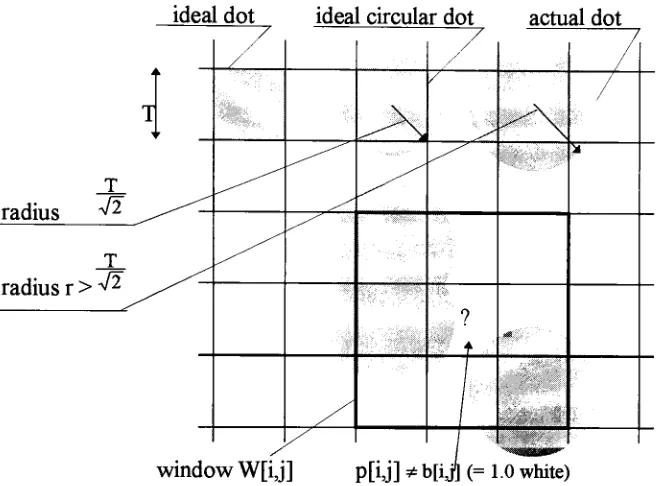
As illustrated in Figure 3-7, printers produce ink spots on a Cartesian grid with
horizontal and vertical spacing T. The reciprocal of T is referred to as the printer
resolutionandusuallyis measuredin dotsperinch. Idealrectangulardots produced by a
printerareT x T. Theradius ofideal circularinkspots produced byrealistic printers is at
least -j=, so theycover an area ofsize = n r
= T (Figure 3-7). The
circular spot of
V2 2
radius with -j= is 57% larger than a T x T square. Neighboring black dots overlap V2
horizontallyandvertically, butnot diagonally andwhite dotsare darkened byneighboring
black dots. We will use pto denotethe ratio ofthe actual dot radius to the ideal circular
dot radius -j= ofthe printer. The effectivegray level of a printed pixel is assumedto be V2
then theeffective graylevel of all 2-D patterns canbepredictedbycalculatingthe area of
each pixelthatiscoveredbyink.
ideal dot idealcirculardot actualdot
windowW[i,j] p[i,j]*b[ij\(=1
.0white)
Figure3-7 DotsandTheir Radius
[image:55.530.51.381.117.360.2]The amount of ink spreading at each pixel can be expressed in terms of the
parametersa, P, and y, showninFigure 3-8. Theseparameters arethe ratios ofthe areas
oftheshaded regionstoT2, the area ofthepixel. Theycaneasilybeexpressedinterms of
theradius ratiop andtheradius r(PappasandNeuhoff, 1991 and 1995):
P[ij]=p(wiN[i,j]
)={1-(p>a+
p>p-P3*)> lfb^J] =
10(whlte)'
[0.0, ifb[i,j] = 0.0
(black);
(3-10)
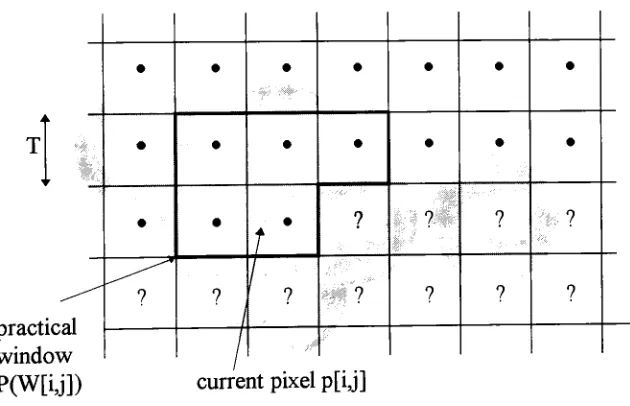
where r is the radius of an actual circular dot and pi-p3 are the number ofblack pixels
within a3 x 3 window(Figure3-7)bygeometricdistribution. p[i,j] isthe current pixel, pi
is the number of horizontally and vertically neighboring dots that are black, p2 is the
number ofdiagonallyneighboringdotsthat areblackand not adjacent to any horizontally
orverticallyneighboringblackdot, andp3isthenumber of pairs ofneighboringblack dots
inwhich oneis ahorizontal neighborandtheotherisaverticalneighbor. Forthe situation
inFigure3-7,pi is 1, p2is 1 andp3is0. Theparametersa, P,andy aredeterminedfrom:
a^V^+
^sin-^-i
(3-11)3=^_^sin-i(
1
)-IV27^T+
-(3-12)
8 2
\[2r
^ 4-2 J2.
Figure 3-9 shows a specific ideal dot pattern. Figure 3-10 illustrates the practical
gray levelafter we considerdot overlapwiththecirculardot-overlap model.
s
'pixel
Figure 3-9 Ideal DotwithoutDot-overlap
Now, the practical gray level of each pixel is no longer binary, but rather one of
nine values. For a checkerboard patterns,the gray valueof each white pixel actuallyis
(l-(4a-4y)), rather than 0. This