Frequency dependence of the dielectric and electro-optic response in suspensions of charged rod-like colloidal particles
A.V. Delgadoa, , F. Carriqueb, F.J. Arroyoa, T. Bellinic, d, F. Mantegazzac, e, M.E. Giardinic, d, V.
Degiorgioc, d
a Department of Applied Physics, University of Granada, 18071 Granada, Spain b Department of Applied Physics, University of Malaga, 29071 Malaga, Spain
c Istituto Nazionale per la Fisica della Materia, 27100 Pavia, Italy d Dipartimento di Elettronica, Università di Pavia, 27100 Pavia, Italy e Istituto di Scienze Farmacologiche, Università di Milano, 20133 Milano, Italy
Abstract
We have performed an experimental investigation on the electrokinetic properties of charged rod-like fluorinated latex colloids. Systematic measurements of electrophoretic mobility, dielectric constant and electric birefringence have been performed as a function of the concentration of added nonionic surfactant and salt. In the investigated range of
parameters, the zeta potential is a strongly decreasing function of the concentration of nonionic surfactant, while it is basically independent from ionic strength. We have obtained the frequency dependence of dielectric constant and Kerr constant as a function of zeta-potential and ionic strength. We observe the transition from a low frequency behavior, where both the dielectric constant and the Kerr constant are enhanced by the presence of the double layer, to a high frequency behavior, where both quantities take the value expected for unchanged particles in an insulating medium. The shape of the frequency dispersion of the Kerr constant coincides with that of the dielectric constant, but the cut-off frequencies are the same only when the zeta-potential of the particles is low.
Keywords
Introduction
A suspension of anisotropic colloidal particles may become birefringent in the presence of an external electric field. The birefringence is due to the fact that the electric field exerts a torque which tends to orient the particles. As a consequence of the partial orientation of the particles, the suspension presents a refractive index which depends on the polarization of the incident light beam. We call Δn=n‖−n⊥ the induced birefringence, where n‖(n⊥) is the
index of refraction for a linear polarization parallel (perpendicular) to the applied field. For the lowest order in the electric field, the induced birefringence is proportional to the square of the applied field. The Kerr constant is defined as:
equation(1)
where λ is the light wavelength and E0 is the applied electric field.
Electric birefringence (EB) is a technique which has been extensively used to characterize colloids for more than two decades 1, 2 and 3. In particular several authors have presented EB measurements on aqueous dispersions of rigid polyclectrolytes 4 and 5 but, even for the simple case of non-interacting polyelectrolytes, it is still an open theoretical problem to give an expression of the Kerr constant. Recent experiments performed with dilute dispersions of model polyelectrolytes of slightly elongated shape have shown that a close connection exists between the Kerr constant and the electrokinetic properties of the particles in
suspension [6]. Indeed, the frequency dispersion of B has strong similarities with that found for the real part of the dielectric constant εd′ in dielectric spectroscopy (DS) experiments
with charged spherical particles [6]: both dispersions have a non-Debye behavior which is well described by an expression derived by Fixman within the frame of the standard electrokinetic model [7]. The qualitative reason for this similarity is probably that in both cases the significant relaxation time is the time taken to polarize the double layer (this corresponds to the time taken by the small ions to diffuse over a distance comparable to the particle size). Furthermore, it is known that both the Kerr constant and the real part of the dielectric constant of polyelectrolyte dispersions take at low frequency a value much larger than the high-frequency one [8].
We recall that the standard electrokinetic model, as applied to dilute suspensions of
spherical polyelectrolytes, allows the calculation of the complex dielectric constant εd of the
suspension which is proportional to the polarizability of the spherical particles 9 and 10. It should be noted that DS applied to suspensions of non-spherical particles gives the particle polarizability averaged on all possible orientations. On the other hand, EB is a differential technique which intrinsically measures the anisotropy of the particle polarizability. As suggested by the discussion presented in the following paper in this issue [11], the
calculation of the Kerr constant involves the solution of the electrokinetic equations for the case of non-spherical particles.
zeta-potential ζ of the particles and the ionic strength I can be independently controlled. We have performed the experiment with aqueous dispersions of rodlike
polytetrafluoroethylene (PTFE) particles. These particles represent a good model system for a systematic comparison between EB and DS because they are reasonably monodisperse and have a surface electric charge that can be modified by a competitive adsorption mechanism between a ionic and a nonionic surfactant [12]. The results described in this paper, together with the theoretical considerations developed in the accompanying paper [11], should constitute a useful starting point for the development of a satisfactory theory of the Kerr effect in polyelectrolyte solutions.
Experimental
The PTFE particles used in our work have been kindly provided by Ausimont, Milano, Italy. A detailed description of the particle properties can be found in [12], here we briefly recall some important characteristics. The particles are rodlike in shape, with average height of 0.53 μm and diameter of 0.16 μm. As prepared by emulsion polymerization [13], the latex particles bear a negative surface charge which is due in part to the adsorbed anionic surfactant (fluorinated carboxylate) and in part to the end groups of the polymer chains (fluorinated carboxyl ions) generated by the decomposition of the initiator. As discussed in detail in previous articles 13 and 14, these particles have a crystalline internal structure which makes them birefringent, with the fast axis directed as the symmetry axis of the particle. The internal birefringence of the particles is about 0.04 and the average refractive index is 1.37. The zeta-potential of the particles can be modified by adding to the
suspension a controlled amount of nonionic surfactant. In our experiments we have used a commercial product, Triton X-100 (Rohm and Haas, USA). The addition of Triton X-100 gives rise to a competition for adsorption between the two surfactant species. The resulting number of adsorbed ionic surfactant molecules per particle, which corresponds to the electric charge per particle, is a function of the ratio between the volume fraction φ of the particles and the concentration cT of the nonionic surfactant in solution [12].
All the measurements reported in this paper were performed at the temperature of
25.0±0.5°C. The particle volume fraction was 5×10⁻³ for the EB measurements and 1.5×10⁻²
for the DS measurements.
The EB experiment consists in applying a voltage pulse to the electrodes of the Kerr cell with a pulse duration long enough to reach a stationary value of the induced anisotropy, and in observing the induced birefringence pulse using a laser beam and two almost crossed polarizers. A general description of the technique can be found in 1, 2 and 3.
Fig. 1. - Scheme of the electric birefringence set-up. P1 and P2 are polarizers, λ/4 is the quarter wave plate, D is the detector. In our set-up, the angle of the polarizer P2, the shape
and amplitude of the sine-wave pulse produced by the function generator, and the averaging process performed by the transient digitizer are all computer-controlled.
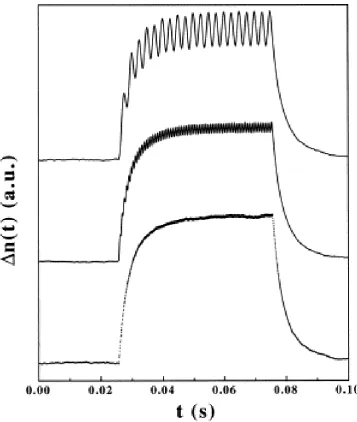
We have applied to the Kerr cell sine-wave pulses of zero average and frequency between 0.3 kHz and 3 MHz, with pulse duration between 20 and 50 ms. Fig. 2 shows a set of typical pulses of induced birefringence Δn(t) measured at three different frequencies of the applied electric field. Each curve is the result of an averaging process over about 200 pulses. The curves present the following features:
1.
A transient behavior after the field is turned on or off. The decay time (and also the
risetime, in our case) is given by: τR=(6DR)−1, where DR is the rotational diffusion coefficient
of the particles 1, 2 and 3.
2.
An oscillatory component of the steady state response which becomes smaller and smaller as the frequency increases. The cut-off frequency of this oscillatory component is τ−1
R
17 and 18.
3.
A dc component of the steady state response. Such a component is also frequency-dependent, and will be called hereafter Δndc(ω). Consistently, we define the dc steady
component of Kerr constant B(ω) as
equation(2)
where (E2
Fig. 2. - Electric birefringence response to a sine-wave electric field pulse having the duration of 50 ms, for different frequencies of the sine-wave field (from top to bottom:
200 Hz; 700 Hz; 3000 Hz). The data was obtained with a PTFE suspension at φ=0.5% containing 0.2 mM NaCl and no Triton X-100.
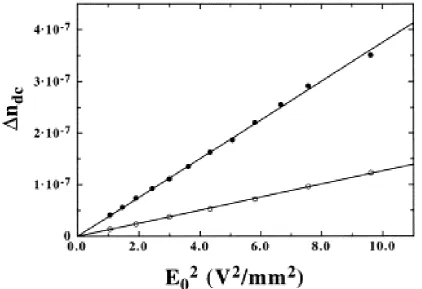
In Fig. 3 we show the dependence of Δndc on the amplitude of the applied electric field for
two different frequencies. The plots clearly show that, in the investigated range of field amplitudes, Δndc is proportional to the square of the applied field, that is, the experiment is
performed in the Kerr regime where the coupling energy between particle and field is smaller than the thermal energy kBT 1, 2 and 3, where kB is the Boltzmann constant and T is
Fig. 3.- Electric birefringence Δndc measured as a function of the square of the applied field
E0 for a PTFE suspension with φ=0.5% containing 0.2 mM NaCl and cT/φ=0.2 g/cm3 Triton
X-100. The data was obtained at two different frequencies of the sine-wave pulse: ν=1 kHz (filled circles), ν=100 kHz (open circles).
The DS apparatus used a cell with variable distance between the platinized platinum electrodes 19 and 20, connected to a HP 4284A impedance analyzer. The measurement gives a complex admittance Y which contains also an instrumental contribution. In order to extract the complex dielectric constant of the suspension, Y was measured for several electrode separations in the desired frequency interval (1 kHz–1 MHz). According to Springer's method [21], the following linear relationships must hold:
equation(3)
where Y′ and Y″ are the real and imaginary parts of the measured admittance, ω is the angular frequency, L is the cell constant which is proportional to the electrode separation, and the quantities B1 and B2 are related to the real and imaginary part of εd(ω) by the
following expressions: equation(4)
where B10 is the low frequency value of B1.
Straight lines like those shown in Fig. 4 were obtained. From the slopes of such lines, εd′(ω)
Fig. 4. - Typical plots obtained in the dielectric spectroscopy experiment. The data correspond to a PTFE suspension with φ=1.5% containing 1 mM NaCl and cT/φ=0.02 g/cm3
Triton X-100. The data was obtained at three different frequencies of the sine-wave electric field: ν=1 kHz (squares), ν=10 kHz (circles), ν=100 kHz (triangles).
It should be recalled that, as always happens in this kind of measurement, the
low-frequency part of the experimental data contains a rather large spurious contribution due to electrode polarization effects. Such a contribution has to be measured separately in the absence of suspended particles, and subtracted from the data referring to the suspension.
Electrophoretic mobility measurements were performed with a Coulter DELSA 440 (Coulter Co.) as described in detail in [12]. The instrument relies on the Doppler velocimetry
technique: the electrophoretic mobility is obtained from the measured frequency shift between incident and scattered light 22 and 23. Because of the geometry of the cell, the electro-osmosis produces a compensating back flow in the centre of the cell, the resulting effect is a position-dependent parabolic velocity profile of the solvent across the cell. We have measured the apparent mobility at several different positions across the cell and we have fitted the Komagata equation to the results [24] to take into account the effects due to electro-osmosis.
We have verified that the obtained mobilities were, within the experimental uncertainties, independent of the amplitude and duration of the electric field pulse. No effects due to joule heating were observed. No appreciable sedimentation was observed during the time taken to perform one measurement.
Results and discussion
Electrokinetic characterization of the particles
zeta potential ζ and the surface charge density σ by modeling the particles as spherical, with an equivalent radius R=0.135 μm [12]. More precisely, in order to derive ζ and σ from the electrophoretic mobility we have used the numerical solution of the electrokinetic
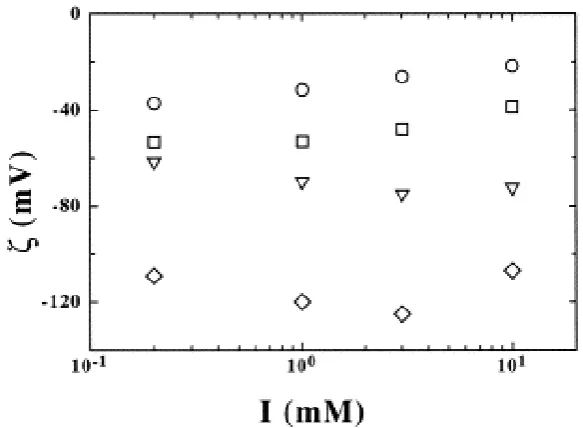
equations proposed by O'Brien and White [25]. Such a numerical treatment, in fact, allows the calculation of the zeta potential as a function of the electrophoretic mobility once the particle radius and the ionic strength are fixed. Some results are shown in Fig. 5. As previously shown [12], at given ionic strength, the charge of the particles is mainly
determined by the amount of Triton X-100 adsorbed on the particle surface, which in turn depends on the surfactant concentration only via the ratio cT/φ (concentration of Triton
[image:8.595.151.443.230.444.2]X-100 per unit volume fraction of suspension).
Fig. 5. - Zeta potential ζ of PTFE particles measured as a function of ionic strength I for different amounts of Triton added. cT/φ=0 g/cm3 (diamonds), cT/φ=0.02 g/cm3 (triangles),
cT/φ=0.2 g/cm3 (squares), cT/φ=2 g/cm3 (circles).
Fig. 5 shows the following facts:
1.
|ζ| decreases significantly when the Triton X-100 concentration is increased between 0 and 0.2 g/cm3. This is a consequence of the competition for adsorption between the two
surfactant species: the anionic emulsifier initially adsorbed on the particles is progressively removed from the surface when the concentration of Triton X-100 is increased.
2.
Kerr constant of the suspensions
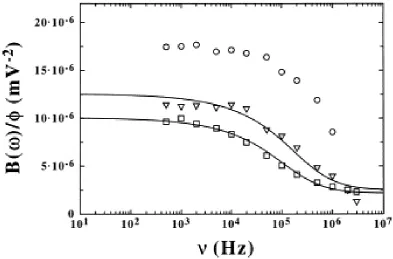
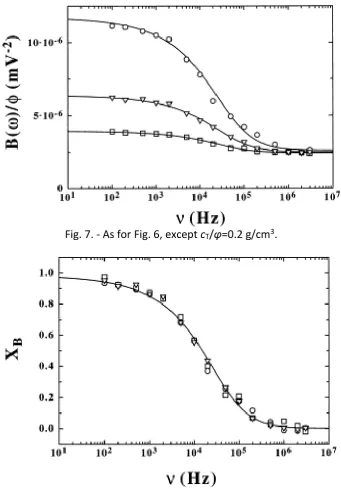
The frequency dispersion of the specific Kerr constant B(ω)/φ is shown in Fig. 6Fig. 7 for different values of the ionic strength and Triton X-100 concentration. It is useful to define the normalized enhancement of the Kerr constant as follows:
equation(5)
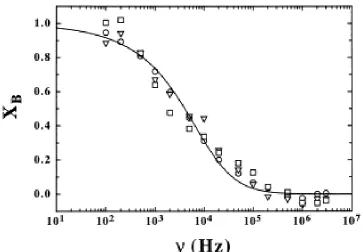
where B0=B(ω→0) and B∞=B(ω→∞). The quantity XB is plotted in Fig. 8Fig. 9 as a function of
[image:9.595.100.494.245.504.2]frequency for high Triton X-100 concentrations (cT/φ=0.2 and 2 g/cm3).
Fig. 6.- Specific Kerr constant B(ω)/φ of PTFE suspensions measured as a function of the frequency of the applied electric field for different NaCl concentrations. The data correspond to a PTFE suspension with φ=0.5%, cT/φ=0 g/cm3 Triton and three different
Fig. 7. - As for Fig. 6, except cT/φ=0.2 g/cm3.
Fig. 8. - Normalized enhancement of the Kerr constant XB measured as a function of the
frequency of the applied electric field for different NaCl concentrations. The data correspond to a PTFE suspension with 0.5%, cT/φ=0.2 g/cm3 Triton and three different
values of ionic strenaths I: I=0.2 mM NaCl (circles), I=1 mM NaCl (triangles), I=3 mM NaCl (squares). The data presented correspond to the data presented in Fig. 7. The full line
Fig. 9. - Normalized enhancement of the Kerr constant XB measured as a function of the
frequency of the applied electric field for different NaCl concentrations. The data correspond to a PTFE suspension with φ=0.5%, cT/φ=2 g/cm3 Triton and three different
values of ionic strengths I: I=0.2 mM NaCl (circles), I=1 mM NaCl (triangles), I=3 mM NaCl (squares). The full line correspond to a fit of the Fixman function F(ω).
The data presented in Fig. 6, Fig. 7, Fig. 8 and Fig. 9 indicates that:
The Kerr constant strongly depends on the frequency of the applied electric field, decreasing from an enhanced value at low frequency to a non-zero high frequency value.
The asymptotic value B∞ of the Kerr constant is the one expected for a purely dielectric
elongated particle in a dielectric medium 1, 2 and 3. In order to perform the calculation, it is necessary to know the intrinsic birefringence of the particles, which can indeed be
independently measured by light scattering [13].
The frequency dispersion of the Kerr constant is strongly non-Debye (non-Lorentzian) and can be very well represented by the following expression [7]
equation(6)
model 9 and 10. According to Fixman theory [7], the time constant τs which appears in the
expression of F(ω) is given by the following expression
equation(7)
where Di is the diffusion coefficient of the free counterions and R is the radius of the
spherical polyelectrolyte.
The fact that the frequency dispersion of the Kerr constant is well described by the function F(ω) may not be surprising, since it is clear that both the dielectric enhancement and the enhancement of the Kerr constant are related to the polarizability of the electric double layer surrounding the particle. For particles having non-spherical shape, both the intrinsic and the double-layer polarizabilities are tensorial and contribute to the electric torque on the particles. The frequency dispersion of the enhancements of both the Kerr constant and of the dielectric constant is connected to the finite time taken by the electric double layer to become polarized under the action of the field or to relax toward its equilibrium
configuration after the field is switched off. Although such a qualitative picture can be easily accepted, a quantitative description of the electrokinetic properties of non-spherical
particles is a complicated matter. Some of the problems involved in such a treatment are discussed in the following article in this issue [11].
We are not claiming that the behavior of XB follows F(ω) in the whole range of investigated
parameters. Indeed, when both the ionic strength and the concentration of the added nonionic surfactant are small, the frequency response is shifted toward the high frequency limit of the experimentally accessible frequency interval, as shown in Fig. 6, so that an accurate fitting is impossible. However, it actually seems unlikely that F(ω) could reproduce the data in those cases.
It is clear by comparing Fig. 6 and Fig. 7 that the cut-off frequency of B(ω) depends on the concentration of Triton X-100: upon increasing the concentration of nonionic surfactant, the cut-off frequency decreases. This phenomenon cannot be solely explained in terms of the increase in viscosity due to the presence of the non-ionic surfactant. In fact the viscosity of a solution of water and Triton at 1% is only 10% larger than the viscosity of pure water.
At high concentrations of non-ionic surfactant, i.e. at low |ζ|, the shape of the frequency dispersion is independent of the ionic strength, as shown by the plots in Fig. 8 and Fig. 9.
The value of the Kerr constant of the suspension decreases both upon increasing ionic strength at fixed concentration of Triton X-100 and upon increasing the concentration of Triton X-100 at fixed ionic strength.
Dielectric dispersion of the suspensions
We call Δε=Δε′+iΔε″=εd−εe the dielectric enhancement, where εe is the complex dielectric
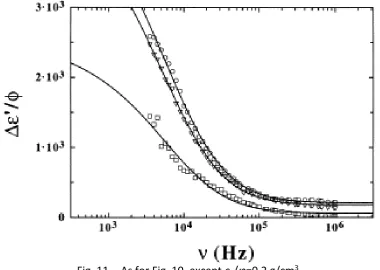
In Fig. 10Fig. 11 we show the behavior of the specific quantity Δε′/φ, as a function of the frequency of the applied field, at different ionic strengths and concentrations of Triton X-100. The full lines in Fig. 10 and Fig. 11 represent the fit with F(ω).
Fig. 10. - Real part of the specific dielectric (Δε′)/φ enhancement of the suspensions measured as a function of the frequency of the applied electric field for different NaCl concentrations. The data correspond to a PTFE suspension with φ=1.5%, cT/φ=0 g/cm3
Triton and three different values of ionic strength I: I=0.2 mM NaCl (circles), I=1 mM NaCl (triangles), I=3 mM NaCl (squares). The full lines correspond to a fit of the Fixman function
F(ω).
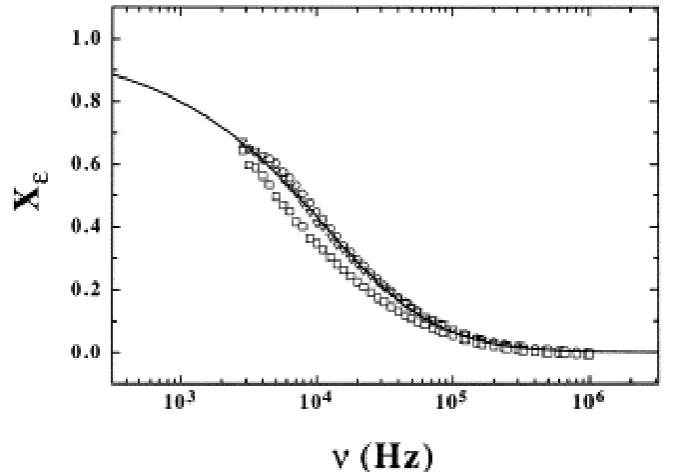
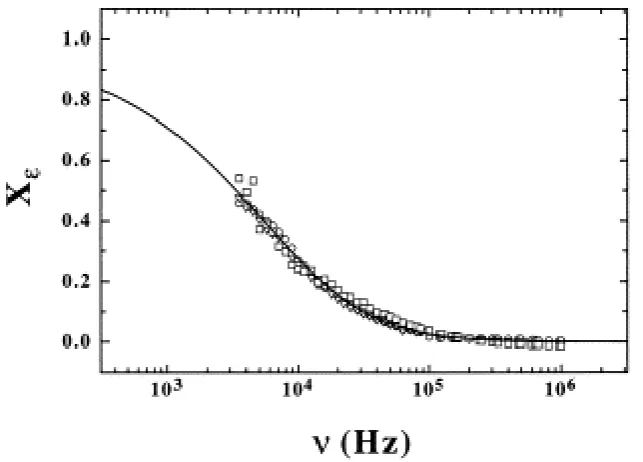
[image:13.595.108.489.474.744.2]In order to check whether the shape of the frequency dispersion depends on the ionic strength, we have plotted in Fig. 12Fig. 13Fig. 14 the normalized real part of the dielectric enhancement Xε, defined as follows:
equation(8)
[image:14.595.129.468.216.452.2]where Δε′(ω→0) is the low frequency value of the real part of the dielectric enhancement of the solution.
Fig. 12. - Normalized real part of the dielectric enhancement Xε measured as a function of
the frequency of the applied electric field for different NaCl concentrations. The data correspond to a PTFE suspension with φ=1.5%, cT/φ=0 g/cm3 Triton and three different
values of ionic strength I: I=0.2 mM NaCl (circles), I=1 mM NaCl (triangles), I=3 mM NaCl (squares). The data presented corresponds to the data presented in Fig. 10. The full lines
Fig. 13. - Normalized real part of the dielectric constant Xε measured as a function of the
frequency of the applied electric field for different NaCl concentrations. The data correspond to a PTFE suspension with 1.5%, cT/φ=0.02 g/cm3 Triton and three different
values of ionic strength I: I=0.2 mM NaCl (circles), I=1 mM NaCl (triangles), I=3 mM NaCl (squares). The full lines correspond to a fit of the Fixman function F(ω).
Fig. 14. - Scaled real part of the dielectric constant (Xε) measured as a function of the
frequency of the applied electric field for different NaCl concentrations. The data correspond to a PTFE suspension with φ=1.5%, cT/φ=0.2 g/cm3 Triton and three different
values of ionic strength I: I=0.2 mM NaCl (circles), I=1 mM NaCl (triangles), I=3 mM NaCl (squares). The data presented correspond to the data presented in Fig. 11. The full lines
[image:15.595.139.461.421.652.2]The following facts are worth noting:
1.
At high frequency, all the curves tend to the dielectric constant of the solvent.
2.
All the dielectric dispersions of the real part of the dielectric enhancement can be fitted satisfactorily with the function F(ω), except for the 3 mM data at low concentration of nonionic surfactant. However this data presents large experimental uncertainties because of electrode polarization problems; the experimental conditions at 3 mM seem to be rather extreme for our apparatus of DS.
3.
The effect of the ionic strength is significant. At low cT both Δε′/φ and Δε″/φ increase with
ionic strength, in agreement with experimental findings reported on a large variety of systems [9]. It must be mentioned, however, that such a behavior is opposite to that shown by the Kerr constant which decreases with ionic strength. As shown in Fig. 11, for
cT/φ=0.2 g/cm3, an inversion seems to occur: Δε′/φ decreases when the ionic strength is
increased.
4.
Similarly to that observed for the Kerr constant, at fixed frequency Δε′ is a decreasing function of the concentration of Triton X-100, i.e. decreasing with the charge of the particles.
Comparison between Kerr constant and dielectric constant data
The main goal of this work is to compare the frequency dependence of Kerr constant and real part of the dielectric enhancement. As shown above, the Fixman function describes well both B(ω) and Δε′(ω). The obtained best-fit relaxation times τs are different for the two
quantities. We call τsB and τsε, respectively, the relaxation time for the Kerr constant and for
the real part of the dielectric enhancement. In Fig. 15 we show the two times, as obtained by a fit to the data of Fig. 6, Fig. 7, Fig. 8 and Fig. 9 and Fig. 10, Fig. 11, Fig. 12, Fig.
13 and Fig. 14, plotted as function of the zeta-potential obtained from the electrophoretic mobility. We see that τsB is systematically smaller than τsε. Although the experimental
uncertainty appears to be large, there is, in any case, a clear trend: while τsε only slightly
increases upon decreasing the |ζ|, τsB strongly depends on the zeta-potential. and, at low
|ζ|, becomes close to τsε. We also show in Fig. 15 the characteristic time obtained by using
Eq. (7)and a radius R=135 nm (the “average” radius of our particles). Similarly, we also plot τs computed in the same way, for spheres having radius equal to the short and to the long
Fig. 15. - Characteristic relaxation times obtained by fitting the data presented in Fig. 6, Fig. 7, Fig. 8 and Fig. 9 and Fig. 10, Fig. 11, Fig. 12, Fig. 13 and Fig. 14 with the function F(ω), plotted as a function of the zeta potential ζ of the dispersion. Squares and circles: τsB and τsε
respectively. Dotted, continuous, and dashed lines: characteristic times obtained by using Eq. (7)and assuming R=80, 135, 265 nm respectively.
The strong dependence of the cut-off frequency of B(ω) on the zeta-potential is a new effect which is probably related to the marked non-sphericity of the particles, since no similar effect was found in our previous EB study of nearly-spherical particles. Indeed, for nearly spherical particles it is reasonable to expect that the diagonal components of the particle-polarizability tensor have a very similar frequency behavior, so that the dielectric constant (proportional to the average polarizability) and the Kerr constant (proportional to the anisotropy of the polarizability) should present the same cut-off frequency. Contrary to this, if the particle has a strongly anisotropic shape the different diagonal components of the polarizability tensor will have different cut-off frequencies, so that one should not expect the same behavior for both Δε′(ω) and B(ω).
In the limit of low |ζ|, B(ω) and Δε′(ω) behave very similarly. In Fig. 16 we show the normalized results for the lowest |ζ| conditions which have been studied in the two
Fig. 16. - Normalized enhancement of the Kerr constant XB and normalized real part of the
dielectric enhancement Xε measured as a function of the frequency of the applied electric
field for different NaCl concentrations and different Triton concentrations. The data presented correspond to the data presented in Fig. 9 and Fig. 14. Small and big symbols: dielectric constant and Kerr constant data respectively. Continuous and dashed line: plot of the normalized frequency dispersion of the real part of the dielectric enhancement obtained
with the numerical solution proposed by DeLacey and White assuming R=135 nm and 210 nm respectively.
Conclusions
We have presented a set of experimental results concerning the dielectric dispersion and the electric birefringence of aqueous suspensions of charged rod-like PTFE particles. Both the Kerr constant B(ω) and the dielectric constant of the suspension show an enhancement at low frequency. The frequency dispersion of the two quantities is similar, and is well described by the Fixman function F(ω). The cut-off frequency is different in the two experiments, being equal only in the low |ζ| limit. The cut-off frequency for the dielectric constant is almost independent on ionic strength and zeta potential, whereas the cut-off frequency of the Kerr constant is independent on ionic strength for fixed zeta-potential, but considerably dependent on the zeta-potential. The origin of this dependence may be the non-spherical shape of the particles.
Acknowledgements
Financial support from the Spanish-Italian Integrated Research Action (Azioni Integrate Italia Spagna) HI94-175-A, and DGICYT, Spain (Proj. PB94-0812-CO2-1) is gratefully acknowledged.
References
1) E. Fredericq, C. Houssier, Electric dichroism and electric birefringence, Clarendon Press, Oxford, 1973.
2) C.T. O'Konski, Molecular electro-optics, Marcel Dekker, New York, 1976.
3) S.P. Stoylov, Colloid Electro-Optics, Theory, Techniques and Applications, Academic Press, London, 1991.
4) H. Kramer, C. Graf, M. Hagenbüchle, C. Johner, C. Martin, P. Schwind, R. Weber, J. Phys. II France, 4 (1994), p. 1061
5) V. Peikov, T. Radeva, S.P. Stoylov, H. Hoffmann, Progr. Colloid Polym. Sci., 100 (1996), p. 64
6) V. Degiorgio, F. Mantegazza, M. Giardini, R. Piazza, T. Bellini, J. Physique IV, 3 (1993), p. 129
7) M. Fixman, J. Chem. Phys., 72 (1980), p. 5177
8) F. Mantegazza, M. Giardini, R. Piazza, V. Degiorgio, J. Phys.: Condens. Matter, 4 (1992), p. 8683
9) W.B. Russel, D.A. Saville, W.R. Schowalter, Colloidal dispersions, University Press, Cambridge, 1989
10) R.J. Hunter, Foundations of Colloid Science, vol. II Clarendon Press, Oxford, 1989.
11) T. Bellini, V. Degiorgio, F. Mantegazza, this issue, next paper.
12) T. Bellini, V. Degiorgio, F. Mantegazza, F. Ajmone Marsan, C. Scarnecchia, J. Chem. Phys., 103 (1995), p. 8228
14) T. Bellini, R. Piazza, C. Sozzi, V. Degiorgio, Europhys. Lett., 7 (1988), p. 561
15) R. Piazza, V. Degiorgio, T. Bellini, J. Opt. Soc. Amer. B, 3 (1986), p. 1642
16) R. Piazza, V. Degiorgio, T. Bellini, Opt. Comm., 58 (1986), p. 400
18) G.B. Thurston, D.I. Bowling, J. Colloid Interface Sci., 30 (1969), p. 34
19) F. Carrique, L. Zurita, A.V. Delgado, Acta Polymer., 45 (1994), p. 115
20) F. Carrique, L. Zurita, A.V. Delgado, Coll. Surf. A: Physicochem. Eng. Aspects, 92 (1994), p. 9
21) M.M. Springer, Ph.D. Thesis, University of Wageningen, Netherlands, 1979.
22) B.R. Ware, Adv. Colloid Interface Sci., 4 (1974), p. 1
23) E.E. Uzgiris, Rev. Sci. Instrum., 45 (1974), p. 117
24) R.J. Hunter, Zeta potential in colloid science, Academic Press, London, 1981.
25) R.W. O'Brien, L.R. White, J. Chem. Soc. Faraday Trans. 2, 74 (1978), p. 1607
26) R. Hidalgo-Alvarez, Adv. Coll. Interface Sci., 34 (1991), p. 217
27) R.R. Midmore, R.J. Hunter, J. Colloid Interface Sci., 122 (1988), p. 521
28) R.S. Chow, K. Takamura, J. Colloid Interface Sci., 125 (1988), p. 226
29) C.F. Zukovski IV, D.A. Saville, J. Colloid Interface Sci., 114 (1986), p. 32