Complexes o f Ruthenium and Osmium
A thesis submitted for the degree of Doctor of Philosophy of The Australian National University
by
Brett Darren Yeomans
Except where specific reference is made to other sources, the work presented in this thesis is the work of the author. It has not been submitted, in whole or in part, for any other degree.
I would firstly like to thank my supervisor, Dr. Graham Heath, for his seemingly endless enthusiasm and encouragement over the past three and a half years. I would also like to thank Dr. Lucjan Dubicki for many helpful discussions and Dr. David Hockless for solving the X-ray structures. Thanks also to Dr. Richard Bramley, Dr. Paul Prenzler and Dr. Sue Boyd for recording EPR spectra, Dr. Ray Colton for the electrospray mass spectra and Stefan Lee for his help with some of the synthesis.
I am extremely grateful to Angela, John, Lynne, Paul, Rowena and Stuart for the proof reading, to Nick for keeping the computers going, and Angela and Rowena deserve special mention for all their help with bringing this thesis together in the past few days. Thanks also to everyone in the Heath group and in the RSC who have helped to make this time enjoyable, and thanks to all the members of the Total Vacuum indoor cricket team for keeping me amused on Monday nights.
This thesis is devoted to the synthesis, electrochem ical and spectroelectrochem ical characterisation of confacial bioctahedral complexes of ruthenium and osmium. The systems under study are of the form [M2(p-X)3L6]Z (z = 1+, 2+, 3+), where M2 = Ru2, Os2 or RuOs, while X = Cl, Br and L = PR3 or ASR3. Particular emphasis is placed on characterisation of the mixed-valence state (M211’111), where in principle it is possible for the unpaired electron to be shared equally between the two metal centres (delocalised) or reside preferentially on one metal (localised).
A brief introduction to mixed-valency is given in Chapter 1. Attention is then focussed on four mixed-valence systems based on this {M(p-X)3M}2+ (d5d6) core (M = Ru, Os). In particular, the confacial ruthenium "blues", [Ru2(|i-X)3L6]2+ (L = H2O, NH3) are valence-delocalised systems where the visible region contains an intense g—>G* band (the source of the intense blue colour) together with a weaker, near-infrared 87,;—»G* band, where the degree of metal-metal interaction may be monitored by vG_>G*. The unusual spectroscopic properties of phosphine-capped diruthenium and diosmium complexes compared with their delocalised ammine-capped diruthenium "blue" analogues are highlighted.
Chapter 2 details the preparation of starting materials and the instrumental methods used to characterise products. Electrochemical and spectro-electrochemcial techniques, which are used extensively throughout this thesis, are emphasised.
Ru2II,n (d6d6 = 12-e) resting state with the d5d6 (11 -e) and d5d5 (10-e) levels. The mixed-valence [Ru2(p-X)3L6]2+ species may be characterised by electrogeneration in CH2CI2 at -60 °C. Unexpectedly, the AsR3-capped complexes are found to be in the same electronic and optical mould as classical ruthenium "blues", where L = NH3 or H2O. The distinctly different spectral appearance of the familiar PR3-capped mixed-valence compounds has been a long-standing puzzle, but the present investigation reveals that the entire family of binuclear systems with various PR3 or ASR3 terminal ligands are delocalised and belong within a continuum of electronic behaviour, with the metal-metal interaction decreasing progressively (va-Kj* varies from 18 000 cm-1 to 5000 cm*1) in the
{Ru(p-X)3Ru}2+ series.
Chapter 4 describes the properties of the 12-e, 11-e and 10-e states of the analogous PR3-capped diosmium complexes, [Os2(|i-X )3(PR3)6]z. In addition, a series of mixed-metal [RuOs(p-X)3(PR3)6]+ compounds have been prepared, which can be oxidised to the valence-trapped {RunOsm }2+ state. The spectroscopic properties of the mixed-valence {Os2 }2+ complexes resemble those of the {RuIIOsIII}2+ complexes and are in sharp contrast to their diruthenium analogues, leading us to assign the diosmium complexes as electronically trapped {OsnOsm }2+ systems.
Table of Contents
Declaration... i
Acknowledgments... ii
A b s tr a c t... iii
Table of C ontents... v
List of Tables... ix
List of Figures... xi
Chapter 1 Introduction. 1.1 G eneral... 1
1.2 Mixed-Valency... 2
1.3 Ruthenium "Blues", [Ru2(|i-X)3L6]2+ (L = H2O, N R 3 )... 6
1.4 Mixed-Valence Nonahalides, [Ru2(U-X)3X6]4‘ ... 10
1.5 Mixed-Valence [Ru2(p-X)3(PR3)6]2+Complexes... 12
1.6 D iosm ium Com plexes, [O s2(p-X )3(PR 3)6]2+... 16
1.7 Purpose of This W ork... 18
1.8 R eferences... : ... 19
Chapter 2 General Experimental Procedures. 2.1 Introduction... 24
2.2 Preparation of Starting Materials 2.2.1 Basic Materials... 24
2.2.2 Arsine and Phosphine Ligands... 25
2.2.3 Ruthenium Com plexes... 25
2.2.4 Osmium Complexes... 26
2.3 Instrumental Techniques 2.3.1 Elemental Analyses... 27
2.3.2 !H and 31P - { l H } N M R ... 27
2.3.3 Mass Spectra... 27
2.4 Electrochemical T echniques 2.4.1 Experimental Conditions... 29
2.4.2 Cy clic V oltammetry (C V )... 30
2.4.3 Alternating Current Voltammetry (acV )... 33
2.4.4 Stirred V oltam m etry ( S V ) ... 35
2.5.1 U V/Vis/Near-Infrared Spectro-Electrochem istry... 36
2.5.2 Electron Paramagnetic Resonance Spectra... 39
2.6 References... 40
C h a p te r 3 D iru th e n iu m C o m p lex es, [R u2( p - X )3L6]+/2+/3+: S y n th e sis, E le c tro c h e m istry a n d S p e c tro -e le c tro c h e m is try . 3.1 Synthesis... 42
3.2 E le c tro c h e m is tr y ... 49
3.3 Spectro-Electrochemistry-UV/Vis/Near-Infrared 3.3.1 General Features of the Optical Spectra... 54
3.3.2 { R u 2n ’n }+ S p e c tra ... 56
3.3.3 {RU211’111}2+ S p e c tra ... 58
3.3.4 {Ru2m ’r a }3+ Spectra... 67
3.4 EPR Spectra of {Ru2II>ni}2+ Complexes 3.4.1 I n tr o d u c tio n ... 70
3.4.2 EPR Spectra of [Ru2(|i-X )3L6]2+ C om plexes... 74
3.4.3 C onclusions... 78
3.5 Structural Data 3.5.1 Ru2(H,II) C om plexes... 79
3.5.2 Ru2(II,IE) C om plexes... 81
3.6 Overall Trends in Structure, Bonding and Spectroscopy... 82
3.7 Comproportionation Energy, A G ... 83
3.8 Concluding R em arks... 87
3.9 Experimental... 88
3.10 R eferences... 92
Appendix 3.1 X-Ray Structure of [Ru2(fl-C l)3(A sM e3)6]C F3S0 3... 95
Appendix 3.2 X-Ray Structure of [Ru2(p-Cl)3(AsMe2Ph)6]CF3S0 3... 97
Appendix 3.3 X-Ray Structure of [Ru2(|l-C l)3(PMe3)6]CF3S0 3... 99
Appendix 3.4 X-Ray Structure of [Ru2(p-Br)3(AsMe3)6]CF3S0 3... 101
Appendix 3.5 X-Ray Structure of [Ru2(|i-B r)3(PMe3)6]CF3S0 3... 103
C h a p te r 4 D iosm ium a n d R u th e n iu m -O sm iu m B in u c le a r C om plexes: S y n th esis, E le c tro c h e m is try a n d S p e c tro -E le c tro c h e m is try .
4.2 Diosmium Complexes, [Os2(p.-X)3(PR3)6]+/2+/3+
4.2.1 S y n th e s is ... 105
4.2.2 Electrochemistry... 107
4.2.3 UV/Vis/Near-Infrared Spectra of [Os2(p.-X)3(PR.3)6]+ Complexes... 108
4.2.4 UV/Vis/Near-Infrared Spectra of [Os2(p.-X)3(PR.3)6]2+ Complexes... 109
4.2.5 UV/Vis/Near-Infrared Spectra of [Os2(p-X)3(PR3)6]3+ Complexes... I l l 4.3 Mixed-Metal Complexes, [(PR3)3Ru(ji-X)3 0s(PR3)3]+/2+ 4.3.1 I n tr o d u c tio n ... 114
4.3.2 Synthesis and Characterisation... 114
4.3.3 Electrochemistry... 120
4.3.4 Near-IR Spectra... 123
4.4 EPR Spectra of {Os2}2+ and {RuOs}2+ Com plexes... 127
4.5 Solvent Dependency of Mixed-Valence Spectra... 130
4.6 Interpretation of Mixed-Valence Spectra... 133
4.7 Missing [Os2(|i-X )3L6]+ (L = PMe3, ASR3) C om plexes... 136
4.8 Experimental 4.8.1 Diosmium Complexes, [0 s2(JlI-X)3(PR3)6]CF3S0 3... 138
4.8.2 Mixed-Metal Complexes, [(PR3)3Ru(|i-X )3 0s(PR3)3]CF3S0 3. .. 139
4.9 References... 141
Chapter 5 Monomeric [MX6-nLn]z Complexes (M = Ru, Os; X = Cl, Br; L = PR3, ASR3): Synthesis, Electrochemistry and Spectro-electrochemistry. 5.1 Introduction... 143
5.2 Synthesis and Characterisation 5.2.1 General... 144
5.2.2 [M X4L2] and [MX4L2]" C om plexes... 144
5.2.3 [MX2L4] and [MX2L4]+ Complexes... 146
5.2.4 [MXL5]+ Complexes (X = Cl, L = AsMe3) ... 151
5.4 UV/Vis/Near-IR Spectra
5.4.1 G eneral-M11 (d6) Systems... 160
5.4.2 General-Mm (d5) Systems... 163
5.4.3 Spectra of rrarts-[MX4L2]_ Complexes... 164
5.4.4 Spectra of trans- [MX2L4]+ Complexes... 167
5.4.5 Spectra of Other Complexes... 171
5.4.6 Trends in Charge-Transfer Spectra of Mm (d5) Systems... 173
5.4.7 Comparisons with Optical Spectra of Binuclear Complexes... 175
5.5 Ligand A dditivity... 176
5.6 Future Work on Monomers... 181
5.7 Experimental 5.7.1 General... 182
5.7.2 trans- [MinX4L2]' ... 182
5.7.3 trans-{M^X4L 2\ ... 182
5.7.4 mer-[MmX3L3] ... 182
5.7.5 trans-[ MnX2L4] ... 183
5.7.6 frfl«s-[M in X2L 4] +... 185
5.7.7 ds-[MnX2L4] ... 187
5.7.8 [MnXL5]+ ... 188
5.8 References... ... 190
List of Tables
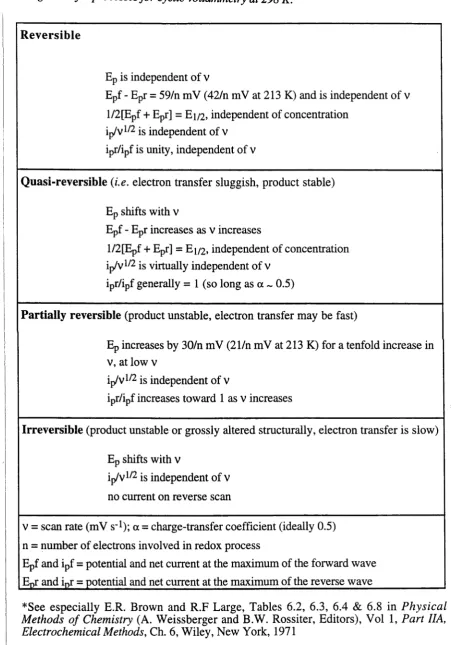
2.1 Criteria for reversible, quasi-reversible, partially-reversible and irreversible
charge transfer processes for cyclic voltammetry at 298K... 32
3.1 Electrochemical data for [Ru2(|i-X)3L6]+ complexes... 51
3.2 UVA^is/near-IR spectral data for [Ru2(ft-X)3L6]+ complexes... 57
3.3 UV/Vis/near-IR spectral data for [Ru2(p-X )3L6]2+ com plexes... 60
3.4 UV/Vis/near-IR spectral data for [Ru2(fi-X)3L6]3+ com plexes... 67
3.5 EPR data for [Ru2( |i- X )3L6]2+ com plexes... 75
3.6 Structural parameters for triple halide-bridged diruthenium complexes... 80
3.7 Experimental details for preparation of [Ru2(|i-X )3L6]CF3S0 3 complexes .. 90
3.8 Analytical and mass spectral data... 91
A3.1 Selected bond lengths and angles for [Ru2(|i-C l)3(AsM e3)6]CF3S0 3... 96
A3.2 Selected bond lengths and angles for [Ru2(|i-Cl)3(AsMe2Ph)6]CF3S0 3... 98
A3.3 Selected bond lengths and angles for [Ru2(p-Cl)3(PMe3)6]CF3S0 3... 100
A3.4 Selected bond lengths and angles for [Ru2(p-Br)3(AsMe3)6]CF3S0 3 ... 102
A3.5 Selected bond lengths and angles for [Ru2((i-Br)3(PMe3)6]CF3S0 3... 104
4.1 Electrochemical data for [Os2(ji-X)3L6]+ com plexes... 107
4.2 UV/Vis/near-IR data for [Os2(|i-X )3(PR3)6]+ com plexes... 108
4.3 UV/Vis/near-IR data for [Os2(p.-X)3CPR3)6l2+com plexes... 110
4.4 UV/Vis/near-IR data for [Os2(ft-X)3(PR3)6]3+ com plexes... 113
4.5 ES mass spectral data for products from reactions of [R u C l2(P P h 3)3] and [OsCl2(P P h 3)3] ... 118
4.6 Electrochemical data for [RuOs(p-X)3L6]+ complexes... 123
4.7 Energy of IVCT band for [RuOs(p-X)3(PR3)6]3+ com plexes... 126
4.8 EPR data for/ac-[O sC l3(PR3)3], [RuOs(p-Cl)3(PR3)^]2+ and [Os2(|t-C 1)3(PR3)6]2+ co m p lex es... 129
4.9 NMR and mass spectral data for [RuOs(|i-X)3(PR3)6]+ com plexes... 140
5.1 ESMS data for frans-[RuX2(AsR3)4]+ com plexes... 151
5.2 ESMS data for trans-[MX(AsMQ^)5]+ com plexes... 153
5.3 Electrochemical data for monomeric ruthenium com plexes... 158
5.4 Electrochemical data for monomeric osmium complexes... 159
5.5 UV/Vis spectral data for M11 complexes... 161
5.6 Energies of in-plane ligand-field transitions in the Ru/Cl/AsMe3 series... 163
5.7 UV/Vis spectral data for trans-[Mm X4L2]~ com plexes... 166
5.8 Position of XMCT bands in frarcs-tR u^C U L L ']2 com plexes... 167
5.9 UV/Vis spectral data for trans-[MX2L4]+ complexes... 169
5.11 Comparison of a(L) and 7i(X) to metal CT in [MX6-nLn]z com plexes... 174
5.12 Predicted E 1/2 values for a series of MX6-nLn com pounds... 178
5.13 Electrochemical data for [MClö-nLn]272' com plexes... 178
List of Figures
1.1 General structure of a confacial bioctahedral complex, [M2(|i-X )3L6]Z.... 1
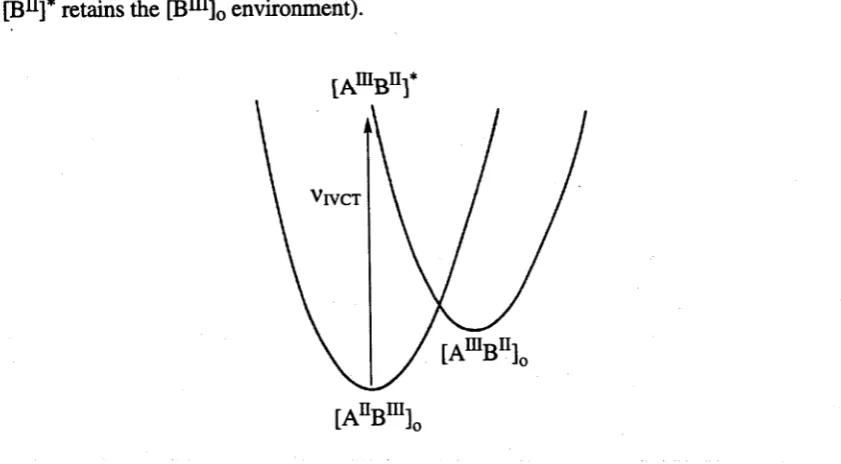
1.2 Potential energy curves for an asymmetric mixed-valence com plex... 4
1.3 Structure of the simplest of three "blue" ruthenium-aquo complexes (x = 0)... 7
1.4 Structure of "blue" ruthenium-ammine complexes, [Ru2(p-X )3(NH3)6]2+.... 8
1.5 MO scheme and expected transitions for a Ü3h confacial bioctahedral complex 9 1.6 Visible/near-IR spectrum of [Ru2(p-Cl)3(Me3tacn)2]2 + ... 10
1.7 Structure of the ruthenium nonahalides, [Ru2(|l-X)3X6]3" ... 10
1.8 Visible/near-IR spectrum of [Ru2(ft-Cl)3Cl6]4" ... 11
1.9 Structure of [Ru2(fi-X)3(PR3)6]+ com plexes... 12
1.10 Literature routes to [Ru2(p-C1)3(PR3)6]+ com plexes... 13
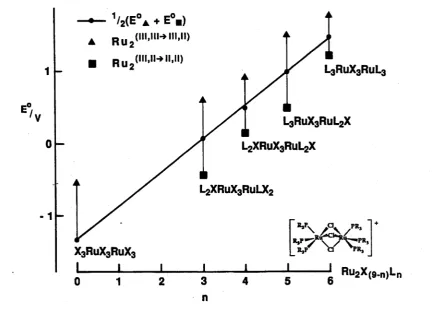
1.11 A plot of the mean of the d5d5—>d5d6 and d5d6—»d6d6 redox processes vs n, in [Ru2(|i-Cl)3Cl6-nLn]z com plexes... 14
1.12 Visible/near-IR spectrum of [Ru2(|i-Cl)3(PMePh2)6]2+... 15
1.13 Preparative routes to [Os2(|i-X )3(P R3)6]X com plexes... 16
1.14 V isible/near-IR spectrum of [Os2(|H-Cl)3(P E t2P h)6]2+... 17
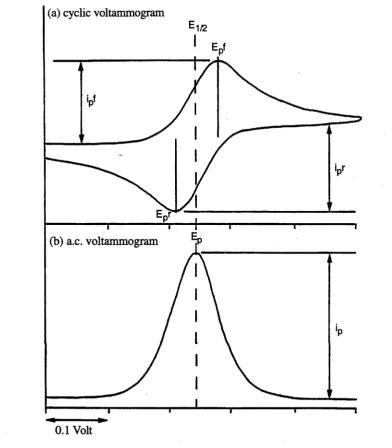
2.1 Form of cyclic voltammogram and a.c. voltammogram for a reversible process... 33
2.2 Linear stirred voltammograms for oxidised and reduced forms o f a given co m p lex ... 35
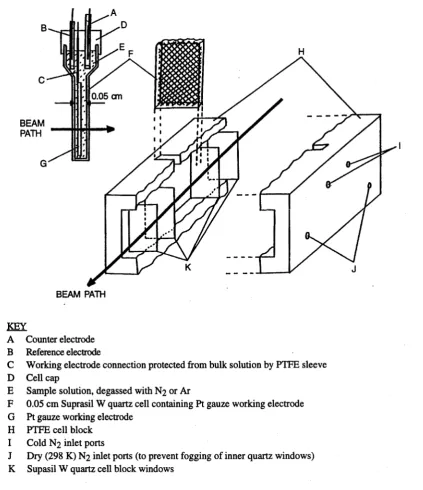
2.3 Components of the Optical Semi-Thin Layer Electrochemical (OSTLE) c e ll... 38
3.1 Literature methods for the preparation of [Ru2(|I-C1)3(AsR3)6]C1 complexes . 42 3.2 Synthesis of [Ru2(p -X )3(A sR3)6]C F3S0 3 com plexes... 44
3.3 Preparation of [Ru2(p.-Cl)3(AsMe3)6]CF3S0 3 from "RUCI3.XH2O"... 44
3.4 Preparation o f [Ru2((i-Cl)3(AsMe2Ph)6]CF3S0 3 from c /5- [ R u C l2( A s M e2P h ) 4] ... 45
3.5 Structure of the mixed-ligand complex [Ru2(p-Cl)3(AsMe3)4(PPh3)2]+ ... 46
3.6 Synthesis o f [Ru2(fi-C1)3(P R3)6]C F3S0 3 com plexes... 46
3.7 Preparation o f [Ru2(|i-Br)3(PR3)6]CF3S0 3 com plexes... 48
3.8 Cyclic and alternating current voltammograms of [R u2(!i-C1)3L6]C F3S0 3 (L = PMe2Ph, AsM e2P h )... 49
3.9 Electron counting scheme for [Ru2(p-X)3L6]Z+ com plexes... 50
3.10 Correlation o f AEj/2 with Eav for [Ru2(|i-X)3L6]+ com plexes... 53
3.11 Spectral progressions upon oxidation of [Ru2(|l-Cl)3(AsMe2Ph)6]+ and [Ru2(^-Cl)3(AsMe2Ph)6]2+ in the OSTLE c e ll... 55
3.13 Comparison of the visible/near-IR band envelopes of
[Ru2(|X-C1)3L6]z complexes... 61
3.14 Visible/near-IR spectra of [Ru2(p.-X)3(AsR3)6]2+ complexes... 62
3.15 Visible/near-IR spectra of [Ru2(|i-Cl)3( AsMe3)4(PPh3)2]2+... 63
3.16 Comparison of the visible/near-IR spectra of [Ru2(|i-Cl)3(EMePh2)6]2+ (E = P, A s)... 63
3.17 Visible/near-IR spectra of [Ru2(p.-C1)3L6]2+ complexes... 64
3.18 Visible/near-IR spectra of [Ru2(M--Br)3L6]2+ complexes... 65
3.19 UV/Vis/near-IR spectra of [Ru2(|i-C1)3L6]3+ complexes... 69
3.20 Splitting of the spin states of an electron in a magnetic field... 70
3.21 Splitting of octahedral t2 orbitals with axial distortion... 72
3.22 Sphtting of the 2T2 term in a trigonally distorted t25 octahedral complex... 72
3.23 General form of the plot of g-values vs A/X... 73
3.24 EPR spectra of [Ru2(p.-C1)3L6]2+ complexes... 76
3.25 Plot of g-values vs v o —»G*... 77
3.26 Molecular structure of [Ru2(|i-B r)3(AsMe3)6]+... 79
3.27 Plot of Eav and AE1/2 vs va—»a*... 83
3.28 Comproportionation energy for Ru2(H,III) systems... 85
A3.1 View of the binuclear cation [Ru2(|i-Cl)3(AsMe3)6]+... 95
A3.2 View of the binuclear cation [Ru2(|i-Cl)3(AsMe2Ph)6]+... 97
A3.3 View of the binuclear cation [Ru2(|X-Cl)3(PMe3)6]+ ... 99
A3.4 View of the binuclear cation [Ru2(M--Br)3(AsMe3)6]+... 101
A3.5 View of the binuclear cation [Ru2(|X-Br)3(PMe3)6]+ ... 103
4.1 General synthetic route to [M2(|I-X)3(PR3)6]CF3S0 3 complexes... 107
4.2 Visible/near-IR spectrum of [Os2(|i-Cl)3(PEt2Ph)6]2+... I l l 4.3 Spectral progressions upon oxidation of [Os2Br3(PEt2Ph)6]+ to [Os2Br3(PEt2Ph)6]2+ in an OSTLE at 213K... 112
4.4 Reaction of equal quantities of [RuCl2(PPh3)3] and [OsCl2(PPh3)3] with triphos... 115
4.5 31P-{ 1H} NMR spectrum of a 1:2:1 mixture of [Ru2(ji-Br)3(triphos)2]+, [RuOs(|i-Br)3(triphos)2]+ and [Os2(|i-Br)3(triphos)2]+... 115
4.6 General synthesis of mixtures containing {Ru2}+ and {RuOs}+ complexes... 116
4.7 31P-{1H} NMR spectrum of a 2:1 mixture of [Ru2(|X-Br)3(triphos)2]+ and [RuOs(|i-Br)3(triphos)2]+... 116
4.9 Stirred voltammogram (S-V) and alternating current voltammogram(acV)
of a 1:2:1 mixture of [Ru2(p-Cl)3(PEt2Ph)6]+,
[RuOs(|J.-Cl)3(PEt2Ph)6]+, and [Os2((i-Cl)3(PEt2Ph)6]+... 121
4.10 Stirred voltammogram of a 2:1 mixture of [Ru2(|i-Cl)3(PEt2Ph)6]+ and [RuOs()J.-Cl)3(PEt2Ph)6]+ ... 122
4.11 Visible/near-IR spectrum of [(PEt2Ph)3Ru(|i-Cl)3 0s(PEt2Ph3)]2+... 124
4.12 Potential energy curve for the asymmetric {RuOs}2+ systems... 125
4.13 Estimation of redox potentials for the electrochemically inaccessible [RuIIIOsII((Li-Cl)3(PEt2Ph)6]2+ complexes... 125
4.14 EPR spectra of [RuOs(ji-C1)3(PR3)6]2+ complexes... 128
4.15 EPR spectra of [Os2(|I-C1)3(PR3)6]2+ complexes... 130
4.16 Potential energy curves for a symmetric class II mixed-valence system... 135
5.1 Solvolysis of frans-[RUX4L2]' complexes... 145
5.2 Synthetic routes to frans-[RUCI2L4] complexes... 147
5.3 Synthesis of frans-[RUCI2L4] complexes... 147
5.4 Synthesis of ds-[RuX2L4] complexes... 148
5.5 Oxidation of frans-[RuX2L4] complexes... 149
5.6 Molecular structure of [RuCl(AsMe3)5]+... 152
5.7 Preparation of [MCl(AsMe3)5]+ complexes... 152
5.8 ESMS of [RuCl(AsMe3)5]+ ... 154
5.9 Voltammetry of trans-[OsBr2(AsM e3)4]+... 157
5.10 UV/Vis spectra of frans-[RuCl2(AsMe3)4] and [RuCl(AsMe3)5]+ ... 162
5.11 UV/Vis spectra of frans-[RuCl4(AsMe3)2]' and frans-[RuCl4(MeCN)2]‘... 165
5.12 Spectral progressions upon regeneration of frans-[OsBr2(AsMe3)4]+ ... 168
5.13 UV/Vis spectrum of frans-[RuCl2(AsMe3)4]+... 170
5.14 UV/Vis spectrum of frans-[OsCl2(AsMe2Ph)4]+ ... 170
5.15 UV/Vis spectrum of frans-[RuCl(AsMe3)5]2+... 171
5.16 UV/Vis spectrum of trans-[OsCl(AsMe3)5]2+... 172
5.17 PlotofE i/2 vsnfor [RuCl6-n(AsMe3)n]z/z- ... 180
CHAPTER ONE
Introduction
1.1 GENERAL
This study involves the synthesis, and the electrochemical and spectro-
electrochemical characterisation of confacial bioctahedral complexes of ruthenium and
osmium. Binuclear complexes of the type [M2(jU-X)3(PR-3)6]+X‘ (M = Ru, Os; X = Cl,
Br) (Fig. 1.1) were first recognised and reported in 1961 by Chatt and Hayter.1 A
variety of complexes of the same basic structure have since been prepared.2 These
complexes consist of two octahedra sharing one face, hence the metal centres are bridged
by three groups. For ruthenium in particular, a wide family of compounds with this basic
structure exists. These bridging groups are usually small anionic moieties such as halide
(X-), OH* or OR-. Complexes with terminal ligands (L) such as X', NH3, H2O, PR3 and
ASR3 have been prepared, as well as complexes with a mixed set of six terminal ligands,
with one or more CO, CS or halide ligands replacing PR3, e.g.
[M2(jU-X)3X6-n(PR3)n]z-Figure 1.1 General structure of a confacial bioctahedral complex, [M2(ß-X)^L^]Z.
Complexes where the terminal ligands are X', NH3 and H2O tend to stabilise the
CS and arenes stabilise the c o re in the closed-shell (d6d6) bis-divalent {M(p-X)3M} + state. The systems under study in this thesis are of the form [M2(/x-X)3L6]z (z = 1+, 2+, 3+), where M2 = Ru2, Os2 or RuOs, while X = Cl, Br and L = PR3 or ASR3.
These confacial bioctahedral systems are one o f many diverse types of binuclear complexes. Some examples o f the range of binuclear coordination include: complexes with unsupported metal-metal bonds, such as [Re2Cl8]2",3 metal-metal bonded complexes held together by bidentate "strapping ligands", such as [Cr2(C>2CCH3)4],4 complexes linked by a single bridging ligand, such as the pyrazine-bridged Creutz-Taube ion, [(NH3)5Ru(p-pz)Ru(NH3)5]5+ (pz = pyrazine),5 and complexes with two metal centres linked by two or three monatomic ligands, such as edge-sharing [Os2Xio]2‘ 6,7 and face sharing M2X9 complexes.8
Many binuclear complexes display rich redox chemistry and unusual optical and magnetic properties, much o f which can be attributed to the interaction of the metal centres. Some b in u clear com plexes have found uses as catalysts (such as [Ru2(fi-Cl)3Cl2(PP)2] complexes, where PP is a bidentate phosphine ligand, which have been investigated as hydrogenation catalysts)9 and as models for active sites of enzymes (such as manganese, iron, iron-sulfur and copper proteins).10' 15 Im portantly, their bimetallic constitution is at least partially responsible for the chemistry of these different systems and in many cases, the interesting electronic properties arise in the mixed-valence state.
1 .2 MIXED-VALENCY
in distinct, different oxidation states and complexes where ions have an averaged valency due to electron delocalisation. The properties of mixed-valence compounds include those o f the individual constituents and those emanating from the interaction o f the metal centres. The most obvious effect of metal-metal interaction is the intense colour of many mixed-valence compounds, a phenomenon which cannot be attributed to a combination of the individual absorption spectra o f the mononuclear species. An example of this, and one o f the first man-made m ixed-valence compounds, is "Prussian Blue", K[FemFen (CN)6], which was used in pigments and inks since its synthesis early in the 18th Century.16 Prussian Blue is formed by mixing aqueous solutions o f ferric and ferrocyanide ions17 and contains the Fe^-NC-Fe11 linkage.18 Its intense blue colour is a property which cannot be attributed to the individual Fe11 or Fe111 complexes.
In 1967 separate articles by Allen and Hush19 and Robin and Day20 reviewed the physical properties of mixed-valence compounds, and mixed-valency has been the subject o f several subsequent reviews.21*23 Robin and Day developed a classification scheme based upon the symmetry and strength of the ligand fields about the metal ions.20 This scheme divides mixed-valence compounds into three classes depending on the degree of mixing of the states:
• Class I systems have trapped valencies, e.g. AnBm . Sites A and B experience different symmetries and ligand field environments, and conversion from one state to the other requires substantial reorganisation of the structure about both ions. Compounds of this kind have properties which are essentially a superposition of those o f A 11 and B111 taken separately. One example of a class I material is GaCl2, which contains a mixture of
non-interacting Ga1 and Gam centres 24
class m system, has ultimately proved to be an example of a delocalised mixed-valence
complex.23
• Class II is an intermediate classification. Delocalisation does occur to some
extent, but the two types of site (A and B) are still physically distinguishable on some
specified experimental timescale. An example of a class II complex is Prussian Blue.25
The most conspicuous property of many mixed-valence compounds is the low
energy optical absorption bands responsible for their colour. These transitions are not
observed in the spectra of individual monomer units, and in electronically trapped
systems they are attributed to an electron transfer from one metal site to another in an
intervalence charge-transfer (IVCT) process, as shown in Fig. 1.2:
e.g. [AEBin]0—>[AmBn]*
where the photogenerated [A111]* centre is in the environment of [An]0 (and similarly
[Bn]* retains the [Bm]0 environment).
[AmBnr
Figure 1.2 Potential energy curves fo r an asymmetric mixed-valence complex showing the intervalence
charge-transfer transition ( vjyct) which transfers an electron from A to B. The horizontal axis represents
the reaction coordinate connecting [A^B111] and [AIlIB11] states.
For class I species, this process is likely to be high in energy as each coordination
site is distinctly unsuited to the metal ion of altered valency (i.e. [AEIBE]0lies at higher
[image:18.521.56.477.387.619.2]curves means that the vertical transition is strongly augmented by the "reorganisation
energy" that will be released thermally as [AniBn]* relaxes to [AniBn]0. In other words,
the IVCT transition leads to a strongly vibronically excited [AmBn]* state.
Class II species have two metal ions in similar environments, which in the
limiting case of identical ligand sets for sites A and B may be differentiated only by the
valency of the metal ion (e.g. A11or Bin) and by the associated difference in coordination geometry for these sites. This leads to a smaller or zero energy difference between
[AnBin]o and [AinBn]0, hence a lower energy IVCT band results, generally in the
visible/near-IR range, which gives the colour to many mixed-valence complexes.
For class III compounds, where the two metal sites are indistinguishable and
strongly interacting, a molecular orbital approach is appropriate. The characteristic
spectral features now arise from transitions within the binuclear molecular orbital
manifold. Each of these orbitals is distributed symmetrically over A and B so the optical
transitions no longer involve literal charge-transfer from site A to site B. Nevertheless, in
many descriptions the term "IVCT" persists.
The IVCT absorption process for class II systems was discussed in a qualitative
model proposed by Hush,26’27 in which the Marcus theory of intermolecular electron
transfer28-30 was applied to intervalence transitions. Subsequent models for mixed-
valence systems have also been developed by Piepho, Krausz and Schatz.31’32 por weakly interacting systems these models are able to account for characteristic features of
IVCT bands, such as their shift in energy depending upon solvent properties and their
broad, low-intensity Gaussian profile.
As noted at the outset, the binuclear ruthenium and osmium compounds studied in
this thesis have two octahedra fused by a face (the triple-halide bridge) and bearing six
in four distinct families of complexes based on this 11-e (d5d6) {M(p-X)^M}2+ structural core.
1 .3 RUTHENIUM "BLUES", [Ru2(|i-X )3L6]2+ (L = H20 , NR3)
Blue solutions o f ruthenium have been observed since 1804,33»34 when de Fourcroy and Vaquelin observed that a blue solution formed when certain solutions of known platinum metals were treated with zinc, although the metal "ruthenium” was not known at the time. In 1846, Claus, after discovering ruthenium metal earlier the same decade, demonstrated that the blue colour observed in 1804 was characteristic of ruthenium chemistry.35
The blue solutions have since been formed by the reduction of aqueous or ethanolic solutions of Rum or RuIV halides.36-39 In 1959, Russian workers suggested that the blue colours obtained upon reduction of solutions of RuIV were due to Ru111 in the presence of lower oxidation states of ruthenium,40 but later Ru11 chloride complexes were implicated 41’42 Rose and Wilkinson obtained a precipitate formulated as [RU5CI12]2' from blue ruthenium solutions,43 however the authors were unable to account for the paramagnetism and EPR signal observed for this complex, and stated the formulation was not consistent with a complex containing only Run .
centres. On the basis of their experimental data, and comparisons with known
{Ru(|i-Cl)3Ru}2+ complexes such as [Ru2Cl5(PR3)4],45’46 Mercer and Dumas correctly
formulated the blue complexes as triply-chloro bridged mixed-valence (2 x Ru2-5+)
complexes, with H2O ligands completing the octahedral coordination about each metal
(Fig. 1.3).+
r n 2 +
H 2Ov y O H 2
\
ä
/
H20""""fU\ / Ru^ ""'O H 2
h2o x o h2
Figure 1.3 Structure of the simplest of three "blue" ruthenium-aquo complexes (x = 0).
Blue solutions have also been formed by the action of concentrated acid on Ru11
complexes containing nitrogen donor ligands. Lever and Powell isolated a blue solid
from the reaction of [Run (NH3)6][ZnCl4] with HC1, which they formulated as a
monomeric species, [Rum Cl2(NH3)3(H2 0)]Cl,47 but suggested that a polynuclear
species was responsible for the blue colour. Bottomley and Tong isolated the same
compound by this procedure and showed evidence of halide-bridging and mixed
oxidation states.48 They suggested a binuclear complex with a single halide bridge,
[(NH3)3Cl2Ru(p-Cl)RuCl(NH3)3(H20)]Cl.
However, recognising the relationship with [Ru2(ft-C1)3(H20)6]2+, Mercer and
Gray formulated the blue solid as [Ru2(fi-C1)3(NH3)6]2+,49 in accord with
comprehensive analytical, electrochemical, magnetic and spectroscopic data. Supporting
evidence for the postulated structure included the observation that the chloride complex
decomposed to/ac-[RuCl3(NH3)3],49’50 identification of the 2+ charge by ion-exchange,
isolation of salts with anions 2I-,50 [ZnCl4]2' 50 and [ZnBr4]2-,51 and analysis of
vibrational spectra based on Ö3h symmetry.51 The X-ray structures of the chloro52 and
brom o53 bridged complexes have since been determined, confirming the triply-bridged confacial bioctahedral structure (Fig. 1.4).
Figure 1.4 Structure o f "blue" ruthenium-ammine complexes, [Ru2(p-X)3(NH3) ^ +.
The electrochemical properties of these complexes were first investigated using polarography,49 where an oxidation wave was found for [Ru2Cl3(NH3)6]Cl2 in aqueous solution. The preparation o f an organo-soluble salt of the dication has since permitted voltammetry in thf and CH3CN.54 Two redox processes were observed, these being a one-electron oxidation to {Rum (|i-Cl)3Rui n }3+, reversible at low temperatures, and a one-electron reduction to the {Ru ii(|X-C1)3Rui i }+ state, which was not fully reversible, even at reduced temperatures. The separation between these two couples was relatively large (see below) at 1.23 V.
The spectroscopic properties of [Ru2X3(NH3)6]2+ have been extensively studied, including U V /V is/near-IR,55 magnetic circular dichroism,56 EPR56 and Resonance Raman57-58 measurements. The most striking feature of the complexes is the presence of a strong electronic band in the visible region, the source of their intense blue colour. A less intense band has also been detected in the near-infrared region. These two bands have been assigned to transitions between binuclear molecular orbitals resulting from the interaction of the t2g-derived orbitals of the two ruthenium centres. The appropriate molecular orbital scheme for a confacial bioctahedral structure of Ö3h symmetry is shown in Fig. I.5.59' 62 The two allowed optical features have been assigned as an intense z- polarised a —k j* transition occurring near 18 000 c m '1, and a less intense xy-polarised
2+
8JC*->o* transition near 7000 cm-1.55-58 The significance of the bn,8^* terminology8 is that the orbitals have 2/3 8 bonding character and 1/3 7C character (Fig. 1.5).
Figure 1.5 MO scheme and expected transitions for a D$h confacial bioctahedral complex.
Similar complexes have been prepared by Wieghardt et al, using the cyclic
tri-amines 1,4,7-triazacyclononane (tacn)63 and l,4,7-trimethyl-l,4,7-triazacyclononane (Me3tacn)64 as facial tridentate ligands (e.g. [Ru2(p.-Cl)3(Me3tacn)2]2+). These mixed valence systems are electronically delocalised with very similar properties to their NH3 analogues. These highly characteristic bands for a typical "blue" complex are shown in
Fig. 1.6.
In addition, Armstrong and Clucas have recently undertaken a systematic
•0*~C<3
Rul Ru2
structural study of a series of tacn and Me3tacn complexes, recording the electronic and Resonance Raman spectra, and obtaining X-ray crystal structures of
6000-2 0 0 0
-10 000 20000
Wavenumber /c m"1
Figure 1.6 Visible/near-IR spectrum of [Ru2(p-Cl)s(Mestacn)2p +, with and 5n* bands.
1 .4 MIXED-VALENCE NONAHALIDES, [Ru24i
-X)3X6]4-Unlike the ruthenium blues described above, the diruthenium nonahalides, [Ru2(|I-X)3X6]3' (X = Cl, Br; Fig. 1.7),66'70 are naturally found in the Ru2n i’ni state and initially isolated as acid-soluble potassium salts. Their chemical development commenced with conversion to alkyl ammonium and phosphonium salts which are soluble in organic solvents.
X y X
\ ** X /
[image:24.521.92.463.71.342.2]
In 1983 Coombe et al investigated the electrochemistry of the nonahalides,
observing two oxidations and one reduction, and electrogenerated the oxidised
{Ru2III,iv }2~ and }' states.67 Since then, Kennedy, Heath and Khoo69, using in situ spectro-electrochemical techniques, have reduced [RU2CI9]3' and [Ru2Br9]3‘ at low temperatures in CH2CI2, leading to the formation of intense blue solutions of the [RU2X9]4- ions, whose UV/Vis/near-IR spectra could be recorded. These electronic spectra of the mixed-valence (d5d6) species are dominated by two strong bands in the visible region ~15 000 c n r1 (containing the G—KJ* transition) and a much weaker near-IR absorption near 5000 c n r1 (6^*—>g*), as seen in Fig. 1.8. The second feature, near
15 000 cm-1, was assigned as a d-d type (G*->7t*) transition. The resemblance to the
ammine "blues" (Fig. 1.6) is evident.
6000-w
2000-20 000 10 000
Wavenumber /c m"1
[image:25.521.74.482.252.638.2]1 .5 MIXED-VALENCE [Ru2(^-X)3(PR3)6]2+ COMPLEXES
Well before there was any knowledge of the existence of the [Ru2X9]3' (Ru2m ’in) or "blue" [Ru2(|i-X)3(NH3)6]2+ (Ru2n ’m ) complexes, triply-chloride bridged phosphine- capped complexes of the form [Ru2(|i-C1)3(PR3)6]+ (Fig. 1.9) were recognised by Chatt and H ayter.1
Figure 1.9 Structure o f [Ru2(p X)^(PR^)q]+ complexes.
W hen isolated initially as chloride salts, the com pounds had stoichiom etry RuC 12(PR3)3, but the confacial bioctahedral structure was deduced unerringly from molecular weight and conductivity measurements. It was also found that only 1/4 of the chlorides in these diamagnetic complexes could be readily exchanged for BPtuf or CIO4-. These observations were not consistent with possible alternative structures for the binuclear stoichiometry, such as edge-sharing [Ru2Cl4(PR3)6] itself, [Ru(PR3)6][RuCl4] or [R u(PR3)4][RuCl4(PR3)2]. There have since been numerous preparations of complexes of this type with terminal phosphine or phosphite-type ligands (Fig. 1.10).
+
R3P '" " 'y ! 'U\ / -KU^ '" « P R 3
R11CI3 .xH 20 [RuCl2(PPh3)3]
[RuC12(DMSO)4]
[RuH(cod)(NH2NMe2)3]PF6
Figure 1.10 Literature Routes to [R u2(p-C l)j(P R s)6]+ Complexes: (i) Boiling MeOH; PR3 =
PMe2PK PEt2Ph, PMePh2, PEtPh27 (ii) Boiling 2-MeOEtOH; PR3 = PEt3, PPr2Ph, PBu2Ph.71 (iii) Boiling EtOH; PR3 = P(OEt)3, P(OEt)2Ph77 (iv) Boiling hexane to prepare [RuCl2(PR3)4], then dissolved in polar solvent; PR3 = P(OMe)2Ph, P(OMe)Ph2, P(OEt)Ph27 3 (v) Boiling benzene; (PR3)3
= ETP (bis(2-(diphenylphosphino)ethyl)phenylphosphine)7 4 (vi) Boiling EtOH; PR3 = PMe2Ph, PEt3,
PEt2Ph, PEtPh2, P(OMe)Ph2; (PR3)3 = triphos (1,1,1 -tris((diphenylphosphino)methyl)ethane).77> (vii) Boiling EtOH or CH2Cl2; PR3 = PMe2Ph, PEt2Ph, PEtPh276 (viii) +AgBF4 in thf; PR3 = PMe377 (ix) CHCI3 or EtOH; PR3 = PMe2Ph78 (x) Boiling MeOH; PR3 = P(OMe)2Ph, P(OEt)2Ph, P(OMe)Ph2, P(OEt)Ph27^ (xi) Boiling toluene; (PR3)3 = triphos8^ ETP.7^
oxidations for [Ru2(|i-X )3(PEt2Ph)6]+ (on the extreme right of Fig. 1.11) is less than half the 1.2 V observed for the ruthenium "blues".
( l i l . l l - » l l , l l )
■ Ru
Figure 1.11 A plot of the mean of the and d^d^—>d^d^ redox processes vs n, in
[Ru2(p-Cl)^Cl^.nLn]z complexes. The indicated "mean"for the nonahalide arises only by extrapolation,
as the second reduction has not been detected.
[image:28.521.51.484.128.440.2]and a second band at higher energy whose position appeared to parallel the degree of interaction between the metal centres.
A large num ber of [Ru2( |i - X )3( P R3)6] 2+ com plexes have since been electrochem ically generated and their near-IR spectra recorded.75’86 In all of these com plexes two bands (Vi and V2 in Fig. 1.12) have been observed at low energy, typically in the region 4000 - 8000 cm-1.
[Ru2Cl3(PMePh2)6
]2-30 000 25 000 20000 15 000 10 000
Wavenumber / cm-1
Figure 1.12 Visible/near-IR spectrum of [Ru2(p-Cl)3(PM ePh2)6p+, recorded in CH2CI2 containing
[Bun4N][BF4] (0.5 mol dm'3) at 213 K.
[image:29.521.70.473.215.488.2]1. 6 DIOSMIUM COMPLEXES, [Os2(^i-X)3(PR3)6]2+
Analogous diosmium complexes were also first prepared by Chatt and Hay ter1 by
reaction of [OsClö]2' with PR3 in aqueous ethanol. Several synthetic routes have since
been established, as shown in Fig. 1.13.
[OsXJ2- [OsX2(PPh3)3]
ctHOsX2(PR3)4]
Figure 1.13 Preparative Routes to [Os2(p~X)3(PR3)^]X Complexes: (i) Boiling aqueous EtOH; X =
Cl, PR3 = PMe2Ph, PMePh2, PEt2Ph, PEtPh2.] (ii) Boiling EtOH; X = Cl, PR3 = PEt3, PEt2Ph, (PR3)3 = triphos.75 (iii) Treatment with Zn/Hg under Ar at room temperature in thf; X = Cl, PR3 = PMe2Ph, PEt2Ph, PEtPh2;87 X = Cl, PR3 = PMe2Ph, via electrochemical reduction in CH2Cl2;88 Boiling 2-MeOEtOH; X = Br, PR3 = PMe2Ph.75 (iv) Refluxing Bu'OH; X = Cl,PR3zPMe2Ph.88 (v) Boiling EtOH; X = Cl, Br, PR3 = PMePh2, PEt3 89
Several of these complexes have been electrochemically oxidised to the
[Os2(|i-X)3(PR.3)6]2+ state75’86 and the X-ray structure of [Os2(|i-Cl)3(PEt3)6]2+,
prepared by chemical oxidation of [Os2(|i-Cl)3(PEt3)6]+, has been reported.86 The near-
IR spectra of the mixed-valence complexes show several bands at low energy (Fig.
1.14), but are seemingly more complicated than the spectra of the corresponding
[image:30.521.97.460.180.407.2][Os2Cl3(PEt2Ph)6]2+
10 000
20 000 15 000
Wavenumber / cm-1
Figure 1.14 Visible/near-IR spectrum of [Os2(p-Cl)3(PEt2Ph)(j]2+, recorded in CH2CI2 containing
[Bun4N][BF4] (0.5 mol dm'3) at 213 K.
[image:31.521.111.464.69.359.2]1 .7 PURPOSE OF THIS WORK
The work described in this thesis involves the synthesis, and the electrochemical and spectro-electrochemical characterisation of a wide range o f triply halide-bridged bioctahedral complexes of ruthenium and osmium. These compounds are of interest because of their range of accessible oxidation states and their intriguing electronic spectra. A central objective in this work was to characterise in detail the mixed-valence state of the phosphine- and arsine-capped complexes, where it is possible for the unpaired electron to be shared equally between the two metal centres (delocalised) or reside preferentially on one metal (localised). Near-IR and EPR spectra, voltammetry and structural data are all probes to the nature of the mixed-valence state and the degree of metal-metal interaction, and these techniques were employed extensively in this work.
1 .8 REFERENCES
1. J. Chatt and R.G. Hayter, J. Chem. Soc. (A), 1961, 896.
2. E.A. Seddon and K.R. Seddon, The Chemistry of Ruthenium, Elsevier,
Amsterdam, 1984.
3. F.A. Cotton and C.B. Harris, Inorg. Chem., 1965, 4, 330.
4. F.A. Cotton, Chem. Soc. Rev., 1975, 4, 27.
5. C. Creutz and H. Taube, J. Am. Chem. Soc., 1973, 95, 1086.
6. F.A. Cotton, S.A. Duraj, C.C. Hinckley, M. Matusz and W.J. Roth, Inorg.
Chem., 1984, 23, 3080.
7. B. Krebs, M. Bruns, M. Dartmann, G. Henkel, and W. Preetz, Z. Naturforsch.,
1984, 39b, 843.
8. S.F. Gheller, G.A. Heath, D.C.R. Hockless, D.G. Humphrey and J.E. McGrady,
Inorg. Chem., 1994, 33, 3986.
9. D.E. Fogg, B.R. James and M. Kilner, Inorg. Chim. Acta, 1994, 222, 85, and
references therein.
10. S.J. Lippard, Angew. Chem., Int. Ed. Engl., 1988, 27, 344.
11. L. Que, Jr. and A.E. True, Prog. Inorg. Chem., 1990, 38, 97.
12. K. Wieghardt, Angew. Chem., Int. Ed. Engl., 1989, 28, 1153.
13. G. Christou, Acc. Chem. Res., 1989, 22, 328.
14. R.H. Holm, S. Ciurli, and J.A. Weigel, Prog. Inorg. Chem., 1990, 38, 1.
15. T.D. Westmoreland, D.E. Wilcox, M.J. Baldwin, W.B. Mims and E.I. Solomon,
J. Am. Chem. Soc., 1989, 111, 6106.
16. H.M. Powell, Proc. Chem. Soc., 1959, 73.
17. M.B. Robin, Inorg. Chem., 1962, 1, 337.
18. H.J. Buser, D. Schwarzenbach, W. Petter and A. Ludi, Inorg. Chem., 1977, 16,
2704.
19. G.C. Allen and N.S. Hush, Prog. Inorg. Chem., 1967, 8, 357.
21. C. Creutz, Prog. Inorg. Chem., 1983, 30, 1.
22. D.E. Richardson and H. Taube, Coord. Chem. Rev., 1984, 60, 107.
23. R.J. Crutchley, Adv. Inorg. Chem., 1994, 41, 273.
24. G. Garton and H.M. Powell, J. Inorg. Nucl. Chem., 1957, 4, 84.
25. A. Ludi, in Mixed-Valence Compounds, ed. D.B. Brown, Reidel Publishing Co.,
Dordrecht, 1980, pp. 25-47.
26. N.S. Hush, Prog. Inorg. Chem., 1967, 8, 391.
27. N.S. Hush, Electrochim. Acta, 1968, 13, 1005.
28. R.A. Marcus, J. Chem. Phys., 1956, 24, 966.
29. R.A. Marcus, J. Chem. Phys., 1957, 26, 867.
30. R.A. Marcus, J. Chem. Phys., 1957, 26, 872.
31. S.B. Piepho, E.R. Krausz and P.N. Schatz, J. Am. Chem. Soc., 1978, 100,
2996.
32. K.Y. Wong and P.N. Schatz, Prog. Inorg. Chem., 1981, 28, 369.
33. A.F. de Fourcroy and N.L. Vaquelin, Ann. Chim. (Paris), 1804, 49, 188.
34. A.F. de Fourcroy and N.L. Vaquelin, Ann. Chim. (Paris), 1804, 50, 5.
35. C. Claus, Justus Liebigs Ann. Chem., 1846, 59, 283.
36. J.L. Howe, J. Am. Chem. Soc., 1901, 23, 775.
37. J.L. Howe, J.L. Howe, Jr. and S.C. Ogbum, Jr., J. Am. Chem. Soc., 1924, 46,
335.
38. L.W.N. Godward and W. Wardlaw, J. Chem. Soc., 1938, 1422.
39. G.A. Rechnitz, Inorg. Chem., 1962, 1, 953.
40. I.E. Starlik and Yu. A. Barbanel', Russ. J. Inorg. Chem., 1961, 6, 109.
41. M.G. Adamson, Aust. J. Chem., 1967, 20, 2517.
42. M.G. Adamson, J. Chem. Soc. (A), 1968, 1370.
43. D. Rose and G. Wilkinson, J. Chem. Soc. (A), 1970, 1791.
44. E.E. Mercer and P.E. Dumas, Inorg. Chem., 1971, 10, 2755.
45. J.K. Nicholson, Angew. Chem., Int. Ed. Engl., 1967, 6, 264.
47. F.M. Lever and A.R. Powell, J. Chem. Soc. (A), 1969, 1477.
48. F. Bottomley and S.B. Tong, Can. J. Chem., 1971, 49, 3739.
49. E.E. Mercer and L.W. Gray, J. Am. Chem. Soc., 1972, 94, 6426.
50. F. Bottomley, Can. J. Chem., 1977, 55, 2788.
51. J.R. Durig, Y. Omura and E.E. Mercer, J. Mol. Struct., 1975, 29, 53.
52. M.N. Hughes, D. O'Reardon, R.K. Poole, M.B. Hursthouse and M. Thomton-
Pett, Polyhedron, 1987, 6, 1711.
53. J.K. Beattie, P. Del Favero, T.W. Hambley and N.S. Hush, Inorg. Chem., 1988,
27, 2000.
54. V.T. Coombe, Ph.D. Thesis, University of Edinburgh, 1985.
55. N.S. Hush, J.K. Beattie and V.M. Ellis, Inorg. Chem., 1984, 23, 3339.
56. L. Dubicki and E.R. Krausz, Inorg. Chem., 1985, 24, 4461.
57. R.S. Armstrong, J.K. Beattie, P. Del Favero, V.M. Ellis and N.S. Hush, Inorg.
Chim. Acta, 1984, 89, L33.
58. R.S. Armstrong, W.A. Horsfield and K.W. Nugent, Inorg. Chem., 1990, 29,
4551.
59. R. Saillant and R.A.D. Wentworth, J. Am. Chem. Soc., 1969, 91, 2174.
60. J.L. Templeton, W.C. Dorman, J.C. McClardy and R.E. McCarley, Inorg.
Chem., 1978, 17, 1263.
61. R.H. Summerville and R. Hoffmann, J. Am. Chem. Soc., 1979, 101, 3821.
62. W.C. Trogler, Inorg. Chem., 1980, 19, 697.
63. K. Wieghardt, W. Herrmann, M. Koppen, I. Jibril and G. Hüttner, Z.
Naturforsch., 1984, 39b, 1335.
64. P. Neubold, B.S.P.C. Della Vedova, K. Wieghardt, B. Nuber and J. Weiss,
Inorg. Chem., 1990, 29, 3355.
65. R.S. Armstrong and W.A. Clucas, personal communication;
see also W. A. Clucas, Ph.D. Thesis, University of Sydney, 1994.
66. J.E. Fergusson and A.M. Greenaway, Aust. J. Chem., 1978, 31, 497.
67. V.T. Coombe, G.A. Heath, T.A. Stephenson and D.K. Vattis, J. Chem. Soc.,
68. D. Appleby, P.B. Hitchcock, C.L. Hussey, T.A. Ryan, J.R. Sanders, K.R.
Seddon, J.E. Turp and J.A. Zora, J. Chem. Soc., Dalton Trans., 1990, 1879.
69. B.J. Kennedy, G.A. Heath and T.J. Khoo, lnorg. Chim. Acta, 1991, 190, 265.
70. G.A. Heath and J.E. McGrady, J. Chem. Soc., Dalton Trans., 1994, 3759.
71. M.S. Lupin and B.L. Shaw, J. Chem. Soc. (A), 1968, 741.
72. G. Albertin, S. Antoniutti and E. Bordignon, J. Chem. Soc., Dalton Trans., 1987,
1813.
73. W.J. Sime and T.A. Stephenson, J. Organomet. Chem., 1977, 124, C23.
74. A. Albinati, Q. Jiang, H. Riiegger and L.M. Venanzi, lnorg. Chem., 1993, 32,
4940.
75. D.G. Humphrey, Ph.D. Thesis, Australian National University, 1992.
76. P.W. Armit, A.S.F. Boyd and T.A. Stephenson, J. Chem. Soc., Dalton Trans.,
1975, 1663.
77. J.A. Statler, G. Wilkinson, M. Thomton-Pett and M.B. Hursthouse, J. Chem.
Soc., Dalton Trans., 1984, 1731.
78. M. Laing and L. Pope, Acta Crystallogr., Sect. B, 1976, 32, 1547.
79. D.A. Couch and S.D. Robinson, lnorg. Chem., 1974, 13, 456.
80. L.F. Rhodes, C. Sorato, L.M. Venanzi and F. Bachechi, lnorg. Chem., 1988, 27,
604.
81. G.A. Heath, G. Hefter, D.R. Robertson, W.J. Sime and T.A. Stephenson, J.
Organomet. Chem., 1978, 152, Cl.
82. T. Arthur, R. Contreras, G.A. Heath, G. Hefter, A.J. Lindsay, J.A. Riach and
T.A. Stephenson, J. Organomet. Chem., 1979, 179, C49.
83. G.A. Heath, A.J. Lindsay, T.A. Stephenson and D.K. Vattis, J. Organomet.
Chem., 1982, 233, 353.
84. T. Easton, G.A. Heath, T.A. Stephenson and M. Bochmann, J. Chem. Soc.,
Chem. Commun., 1985, 154.
85. R.M. Christie, G.A. Heath, S.A. Macgregor, M.A. Schröder and L.J. Yellowlees,
86. S.A. Macgregor, E. Mclnnes, R.J. Sorbie and L.J. Yellowlees, in Molecular
Electrochemistry of Inorganic, Bioinorganic and Organometallic Compounds, eds.
A.J.L. Pombeiro and J.A. McCleverty, Kluwer Academic Publishers, Dordrecht,
1993, pp. 503-507.
87. J. Chatt, D.P. Melville and R.L. Richards, J. Chem. Soc. (A), 1971, 1169.
88. V.T. Coombe, G.A. Heath, T.A. Stephenson, J.D. Whitelock and L.J.
Yellowlees, J. Chem. Soc., Dalton Trans., 1985, 947.
89. P.E. Fanwick, I.F. Fraser, S.M. Tetrick and R.A. Walton, Inorg. Chem., 1987,
CHAPTER TWO
General Experimental Procedures
2 .1 INTRODUCTION
A number of common starting materials and experimental techniques have been employed in the course of this work. This chapter groups the details of preparation of starting materials and the instrumental methods used to characterise products. Most attention is given to electrochemical and spectro-electrochemical techniques, which are relied on throughout this thesis.
2 .2 PREPARATION OF STARTING MATERIALS
2.2.1 Basic Materials
2.2.2 Arsine and Phosphine Ligands
AsMePh2,1 PMe3 2 and PMePh2 3 were prepared according to literature methods.
Other monodentate arsine and phosphine ligands were purchased from Aldrich Chemical
Co. and Organometallics Inc. Tridentate l,l,l-tris(diphenylphosphinomethyl)ethane
(triphos) was obtained from Strem Chemicals Inc.
2.2.3 Ruthenium Complexes
K3[ Ru2 Clg ].KCl
Prepared by the method of Coombe,4 heating K2[RuCl5(H20)] (prepared by the
method of Buckley and Mercer5) in an evacuated tube at 260 °C for one week. Typical
yield: 98%.
K3[Ru2Brg]
Prepared by the method of Coombe et al£ heating "RUCI3.XH2O" in a 1:1 mixture of EtOH and HBr (48 %) followed by addition of KBr. The black microcrystalline product precipitated upon concentrating and cooling the solution. The solid K3[Ru2Br9]
was washed with ethanol, diethyl ether and dried in vacuo. Typical yield: 60%.
[Bun4N]3[Ru2X9] (X = Cl, Br)
Prepared in quantitative yield by addition of excess [Bun4N]X to aqueous
solutions of K3[Ru2Cl9].KCl or K3[Ru2Br9]. The [Bun4N]3[Ru2X9] salts precipitated
and were washed with distilled water and dried in vacuo.
[RuCl2(PPh3)3]
Prepared by the method of Stephenson and W ilkinson,7 by heating
"RUCI3.XH2O" and excess PPI13 in methanol for 6 h. The red-brown microcrystalline
precipitate was collected and washed with methanol and diethyl ether. Typical yield:
[RuBr2(PPh3)3]
Prepared according to the method described by Lindsay, 8 using
[B u n4N ]3[R u2B r9] in place of [P(CH2P h )P h3]3[R u2B r9]. For example,
[Bun4N]3[Ru2Br9] (3.13 g, 1.9 mmol) was dissolved in methanol (150 cm3) and heated
at reflux for 0.5 h. The solution was filtered through celite into a flask containing PPh3
(6.0 g, 22.9 mmol). The mixture was heated at reflux for 1 h. The red-brown precipitate
was collected and washed with methanol and diethyl ether. Yield of [RuBr2(PPh3)3]: 1.7
g (43 %).
2.2.4 Osmium Complexes
[Bun4N]2[OsX6] (X = Cl, Br)
[Bun4N]2[OsCl6] was prepared in quantitative yield by the addition of a solution
containing an excess of [Bun4N]Cl in dilute HC1 (0.5 mol dm'3) to [NFLiktOsClö] in 0.5
mol dm-3 HC1. The yellow [Bun4N]2[OsCl6] precipitate was collected, washed with
water and dried in vacuo at 100 °C for 8h. The red coloured [Bun4N]2[OsBr6] was
prepared in a similar manner.
[OsX2(PPh3)3] (X = Cl, Br)
Prepared by the method of Goeden and Haymore,9 by heating [Bu^N^tOsXöl^
and an excess of PPI13 in a mixture of BulOH and H2O (1:3) for 48 h. The green
[OsX2(PPh3)3] precipitates were collected, washed with n-hexane and dried. Typical
yields: 90% (X = Cl), 85% (X = Br).
2 .3 INSTRUMENTAL TECHNIQUES
2.3.1 Elemental Analyses
Analyses for C, H, N, Cl and Br were performed by the Microanalytical Unit,
Research School of Chemistry, Australian National University.
2.3.2 *H and 3 lp .{H l} NMR
!H and 31P-{ NMR spectra were recorded using a Varian Gemini 300 MHz
(BB) instrument, with chemical shifts in ppm referred to internal SiMe4 (^H) or external
H3PO4 (85% in D2O) for 31P-{1H} spectra. Chemical shifts quoted are positive to
higher frequency (lower shielding) than the reference.
2.3.3 Mass Spectra
Electrospray mass spectrometry (ESMS) is a technique which allows pre-existing
ions to be very gently transferred to the gas phase and then examined by conventional
mass spectrometric techniques. The widest application of ESMS has been in the field of
biological chemistry, 10 where the observation of ions usually depends upon protonation
of the substrate by the mobile phase used in the spectrometer (typically
H2 0/Me0H/H0Ac = 50:50:1%). This technique has since been applied to inorganic and
organometallic systems which are usually already ionic and for which observation of ions
does not depend upon reaction with the mobile phase. In studies with solutions
containing single species, 11' 16 the intact ion is almost invariably observed, often as the
only significant peak in the mass spectrum. It has also been discovered that if solutions
containing several rapidly exchanging species are examined using ESMS, then individual
species are observed.17-20
The electrospray mass spectra were recorded by Dr Ray Colton at La Trobe
University, with a VG Bio-Q triple quadrupole mass spectrometer using a
water/methanol/acetic acid (50:50:1%) mobile phase. Solutions of the compounds (2 x
solutions of the compounds -were injected directly into the spectrometer via a Rheodyne
model 7125 injector using a Phoenix 20 micro LC syringe pump to deliver the solution to
the vaporisation nozzle of the electrospray ion source. The compounds described in this
thesis gave strong signals in their ES mass spectra and typically 4-8 averaged spectra
were required to give a good signal to noise ratio. Measurements were made at an ion-
source energy (B1) voltage of 40 V unless stated otherwise.
Positive-ion Fast Atom Bombardment (FAB) mass spectra of compounds
dissolved in dichloromethane were obtained on a ZAB2-SEQ mass spectrometer, using
4-nitrobenzylalcohol (NBA) as the liquid matrix.
The ES and FAB mass spectra of complexes showed a range of m/z values
corresponding to the isotopic mass distribution for the particular complex. In all cases
there was good agreement between the experimental and calculated isotopic mass
2 .4 ELECTROCHEMICAL TECHNIQUES
2.4.1 Experimental Conditions
Electrochemical measurements and electrosyntheses were carried out in CH2CI2
containing 0.5 mol dm-3 [Bun4N ][B F4] or CH3CN containing 0.1 mol dm-3
[Bun4N ][B F4]. The electrolyte, [Bun4N ][B F4], was prepared by neutralising
[Bun4N]OH (40 % in water) with HBF4 to pH 6. The precipitate was collected by
filtration, washed with large amounts of distilled water, recrystallised twice from
methanol/water (4:1) and dried in vacuo at 100 °C for 8 h or until an acceptable
electrochemical background was attained. Dichloromethane was pre-dried over KOH
pellets before distilling from CaH2 just before use. Acetonitrile was purified by the
method described by Walter and Ramaley:21 in succession, analytical grade acetonitrile
was heated at reflux over, then distilled from (i) anhydrous AICI3, (ii) alkaline KMnC>4,
(iii) KHSO4 and (iv) finally distilled from CaH2 just before use.
Cyclic voltammetry (CV) and alternating current voltammetry (acV) measurements
were carried out using a PAR model 170 electrochemical system, linked where
appropriate to a Macintosh LC630 computer via an AD Instruments MacLab interface
system. A standard three-electrode configuration was used. The working electrode was
a platinum disc (1 mm diameter) and a platinum rod was used as the counter electrode.
The reference electrode was a Ag/AgCl electrode (Metrohm), separated from the solution
by two porous glass frits. The internal compartment of the reference electrode was filled
with 0.05 mol dm"3 [Bun4N]Cl / 0.45 mol dm' 3 [Bun4N][BF4] in CH2C12 (or with both
Bun4N+ salts 0.05 mol dm' 3 for CH3CN). The external compartment was filled with
the standard electrolyte solution, 0.50 mol dm' 3 [Bun4N][BF4] in CH2CI2 (or 0.10 mol
dm' 3 in CH3CN). Under these conditions ferrocene was oxidised at +0.55 V in CH2CI2
and +0.41 V in CH3CN at room temperature. Linear stirred voltammetry employed a
Tacussel EDI rotating platinum disc working electrode operating in the range 1000 -
were recorded with positive feedback resistance compensation and phase-sensitive detection. The sinusoidal modulation was set at 10 mV and the frequency, co, was 205 Hz.
The electrochemical cell was a jacketted glass cell (10 cm3) incorporating the above electrodes. The electrolyte solutions were purged with either N2 or Ar and the cell maintained under an inert atmosphere. Low temperature measurements were recorded by connecting the jacketted glass cell to a Lauda RL6 circulating alcohol cooling bath. The temperature was monitored to within 0.2 °C by a digital thermometer with the probe located directly in the electrochemical solution.
Bulk electrolyses were performed at low temperature using a jacketted three compartment H-cell, with a platinum mesh basket working electrode, double-fritted non-aqueous Ag/AgCl reference electrode and platinum wire counter electrode separated from the bulk solution by two glass frits. A platinum disc voltammetric electrode (1 mm
diameter) was used to monitor the electrolysis.
2.4.2 Cyclic Voltammetry (CV)
Cyclic voltammetry involves the use of a static working electrode in an unstirred ("quiet") solution. The potential of the working electrode is varied at a constant rate, v (typically 50 - 1000 mV s_1), between two pre-set values in a cyclic fashion.
portion of the substrate near the electrode surface is actually oxidised or reduced, hence the bulk solution undergoes negligible electrolysis. The timescale o f the process is determined by the scan rate, v.
Four measurable parameters can be be obtained for a reversible process: the net current (ipf) and potential (Epf) of the forward curve and the corresponding parameters for the reverse curve (ipr and Epr). The value o f E1 /2 for a reversible process is
determined from the mean of Epf and Epr. These four parameters can be used to determine whether the redox process is reversible, quasi-reversible or irreversible. A voltammetrically "reversible" process means that the charge-transfer process occurs considerably faster than the rate of diffusion. A reaction in which the electron-transfer process is not effectively instantaneous and is controlled by both diffusion and charge-transfer kinetics is termed "quasi-reversible", and a reaction in which the product formed at the electrode is not returned to the starting species at a significant rate on the reverse scan is termed "irreversible". A "partially-reversible" process has an irreversible chemical reaction following charge-transfer. The criteria for voltammetric reversibility or otherwise are outlined in Table 2.1.22*24
Table 2.1 Criteria fo r reversible, quasi-reversible, partially-reversible and irreversible charge transfer processes fo r cyclic voltammetry at 298 K *
Reversible
Ep is independent of v
Epf - Epr = 59/n mV (42/n mV at 213 K) and is independent of v 1/2[Epf + Epr] = Ei/2, independent of concentration
ip/v1/2 is independent of v ipr/ipf is unity, independent of v
Quasi-reversible (i.e. electron transfer sluggish, product stable) Ep shifts with v
Epf - Epr increases as v increases
l/2[Epf + Epr] = Ei/2, independent of concentration ip/v1/2 is virtually independent of v
ipr/ipf generally = 1 (so long as a ~ 0.5)
Partially reversible (product unstable, electron transfer may be fast)
Ep increases by 30/n mV (21/n mV at 213 K) for a tenfold increase in v, at low v
ip/v1/2 is independent of v
ipr/ipf increases toward 1 as v increases
Irreversible (product unstable or grossly altered structurally, electron transfer is slow) Ep shifts with v
ip/v1/2 is independent of v no current on reverse scan
v = scan rate (mV s_l); a = charge-transfer coefficient (ideally 0.5) n = number of electrons involved in redox process
Epf and ipf = potential and net current at the maximum of the forward wave
(a) cyclic voltammogram
(b) a.c. voltammogram
[image:47.521.67.460.87.536.2]0.1 Volt
Figure 2.1 Form of (a) cyclic voltammogram and (b) a.c. voltammogram for a reversible process.
2.4.3 Alternating Current Voltammetry (acV)
corresponding cyclic voltammogram (Fig. 2.1). Focussing on the "faradaic" current (i.e. the resultant current from the oxidation-reduction process at the electrode) of a redox process,
Ox + ne = — Red (2.1)
it is necessary to have both an oxidisable and reducible species at the electrode surface for such an alternating current to exist. At potentials prior to E1/2, significant concentrations of "Red" are present only when the potential corresponds to the steeply rising portion of the cyclic voltammogram (where [Ox] > [Red] > 0), and the magnitude of the alternating current is determined by [Red] at the electrode surface. Similarly, at potentials just beyond E1/2, [Red] > [Ox] > 0 and the magnitude of the alternating current is dependent upon [Ox]. The faradaic current is at a maximum when [Ox] = [Red] (i.e. at E1/2). For non-reversible processes, rapid decay of "Red" prevents the system oscillating with applied voltage modulation, leading to collapse of the a.c. signal. For irreversible processes no a.c. peak is observed, and for quasi-reversible processes the magnitude of the a.c. current is dependent upon the frequency of the a.c. source, co. The timescale of the experiment is effectively controlled by to, rather than v, and provides a stringent test of electrochemical reversibility. The criteria for reversibility in the a.c. mode are shown below:
Ep = E1/2 (d.c.) independent of concentration and co.
The wave is highly symmetric with a width at half height of 90 mV (64 mV at 213 K). ip gives a linear plot vs co1/2 which passes through the origin.
(co = a.c. frequency; ip = peak current; Ep = peak potential)
Phase-sensitive detection allows the relevant faradaic current to be measured exclusively, leading to an increase in sensitivity and often assists the definition of waves that would be concealed at the d.c. voltammetric positive or negative limits. Another advantage is that two adjacent waves can be resolved with a difference in E1/2 of 0.08 V, compared with 0.15 V in cyclic voltammetry. Alternating current voltammetry also contains information about the reversibility of the process as outlined above.
2.4.4 Stirred Linear Voltammetry (S-V)
This S-V technique involves scanning (10 mV s_1) to increasingly anodic or cathodic potentials whilst stirring the solution (preferably by employing a purpose-built rotating disc electrode), which continually renews the solution in contact with the electrode. Resulting currents are positive (above the 1 = 0 iine) for reductive and negative (below the i = 0 line) for oxidative processes. As the species under investigation undergoes electron-transfer, the current reaches a maximum or minimum value (the diffusion current id), determined by the rate of transport of the species to the electrode surface by diffusion and forced convection. For an ideally reversible system, the midpoint of the wave, E1/2, coincides with the standard E° potential defined by the Nemst equation as long as the oxidised and reduced species have similar diffusion coefficients.
(a )
-J
t
Diffusion Current id (red)
1
E
1
. . . .
(b)
Diffusion Current id (ox)
Figure 2.2 Linear stirred voltammograms for (a) oxidised form, and (b) reduced form o f a given
![Figure 1.7 Structure of the ruthenium nonahalides, [Ru2(p-X)sX^]^'.](https://thumb-us.123doks.com/thumbv2/123dok_us/1777230.131750/24.521.92.463.71.342/figure-structure-of-the-ruthenium-nonahalides-ru-x.webp)
![Figure 1.8 Visible/near-lR spectrum of [Ru2(p-Cl)^Clß]4', showing the <7— >0 * and S K * —> 0* bands.](https://thumb-us.123doks.com/thumbv2/123dok_us/1777230.131750/25.521.74.482.252.638/figure-visible-near-spectrum-ru-clss-showing-bands.webp)
![Figure 1.12 Visible/near-IR spectrum of [Ru2(p-Cl)3(PMePh2)6p+, recorded in CH2CI2 containing [Bun4N][BF4] (0.5 mol dm'3) at 213 K.](https://thumb-us.123doks.com/thumbv2/123dok_us/1777230.131750/29.521.70.473.215.488/figure-visible-near-spectrum-pmeph-recorded-containing-bun.webp)
![Figure 1.13 Preparative Routes to [Os2(p~X)3(PR3)^]X Complexes: (i) Boiling aqueous EtOH; X = Cl, PR3 = PMe2Ph, PMePh2, PEt2Ph, PEtPh2.] (ii) Boiling EtOH; X = Cl, PR3 = PEt3, PEt2Ph, (PR3)3 = triphos.75 (iii) Treatment with Zn/Hg under Ar at room temperature in thf; X = Cl, PR3 = PMe2Ph, PEt2Ph, PEtPh2;87 X = Cl, PR3 = PMe2Ph, via electrochemical reduction in CH2Cl2;88Boiling 2-MeOEtOH; X = Br, PR3 = PMe2Ph.75 (iv) Refluxing Bu'OH; X = Cl,PR3zPMe2Ph.88(v) Boiling EtOH; X = Cl, Br, PR3 = PMePh2, PEt3 89](https://thumb-us.123doks.com/thumbv2/123dok_us/1777230.131750/30.521.97.460.180.407/preparative-complexes-boiling-treatment-temperature-electrochemical-reduction-refluxing.webp)
![Figure 1.14 Visible/near-IR spectrum of [Os2(p-Cl)3 (PEt2 Ph)(j]2+, recorded in CH2 CI2 containing [Bun4N][BF4] (0.5 mol dm'3) at 213 K.](https://thumb-us.123doks.com/thumbv2/123dok_us/1777230.131750/31.521.111.464.69.359/figure-visible-near-spectrum-pet-recorded-containing-bun.webp)