Int. J. Electrochem. Sci., 4 (2009) 295 - 307
International Journal of
ELECTROCHEMICAL
SCIENCE
www.electrochemsci.orgPhenylpropanolamine Analysis in Formulation and Urine by
Potentiometric Membrane Sensor. Theoretical investigation
Mohammad Reza Ganjali 1,*, Maryam Hariri,1 SiavashRiahi 1, 2, Parviz Norouzi1, Majid Javaheri1 1
Center of Excellence in Electrochemistry, Faculty of Chemistry, University of Tehran, Tehran, Iran 2
Institute of Petroleum Engineering, Faculty of Engineering, University of Tehran, Tehran, Iran *
E-mail: ganjali@khayam.ut.ac.ir
Received: 20 December 2008 / Accepted: 10 January 2009 / Published: 9 February 2009
This research introduces the design of an ion-pair based PVC membrane sensor for the phenylpropanolamine (PPA) determination based on some theoretical investigations. For the membrane preparation, phenylpropanolamine-tetraphenylborate ion-pair was employed as an electroactive material in the PVC membrane. Also, several plasticizers were studied namely, dibutyl phthalate (DBP), benzyl acetate (BA), nitrobenzene (NB). After a series of experiments, the best electrode performance was accomplished with a membrane composition of 30% PVC, 65% DBP, 5% ion-pair. This electrode illustrated a fast (~5 s), stable and Nernstian response (55.9±0.4 mV/decade) across a relatively wide phenylpropanolamine concentration range (1×10⁻⁵ to 1×10⁻² M), in the pH range of 4.5–6.0. Validation of the method shows suitability of the sensors for applies in the quality control analysis of phenylpropanolamine hydrochloride in pharmaceutical formulation and urine. The proposed method was found to be simple, accurate and precise which can be used as a detector for HPLC.
Keywords: potentiometric sensor, PVC membrane, ion-pair, phenylpropanolamine, DFT, chemometrics
1. INTRODUCTION
Phenylpropanolamine (PPA), Fig. 1, is a drug ingredient of the phenethylamine family used as a decongestant in cough and cold, and sinus remedies, and some combination allergy medications. It is also present in an appetite suppressant in veterinary medicine, it is used to control urinary incontinence in dogs [1,2].
[image:2.612.262.348.67.120.2]
OH NH2
Figure 1. Chemical structure of phenylpropanolamine
However, potentiometric detection based on ion–selective electrodes (ISEs) offer the advantages of speed and ease of preparation and procedures, relatively fast response, reasonable selectivity thorough judicious choice of the membrane active materials, wide linear dynamic range, and low cost. These characteristics have inevitably led to the preparation of numerous sensors for several ionic species, and the list of available electrodes has grown substantially over the past years [6].
Computational chemistry and molecular modeling play an important role in the modern drug discovery [7-11]. Computational work is also valuable in the drug development, where medium-sized organic pharmaceuticals are selected as candidates and are made in larger quantities. Instead of modeling interactions with macromolecules, the prediction of molecular properties for small molecules is more essential in the development stage.
The strength of binding usually correlates with the target molecules tendency to the ionophore, and several energy contributions may be responsible for the binding which is believed that among these energies, electrostatic interactions play dominant role in the process, at least in sequence preferences and the target molecules positioning [12,13].
There are no studies to date in the literature which have used computational methods to evaluate drug selective ligands by electronic properties. The lack of work in this area is probably due to the inherent difficulties associated with doing calculations on a Drug-Ligand complex. Some of these problems include the lack of parameters for semi-empirical or empirical methods even though the numbers of atoms in typical drug complexes indicate the use of these lower level calculations would be appropriate.
Literature survey shows that there is no reported sensor for phenylpropanolamine. In this work, we report a membrane sensor based on an ion-pair to determine phenylpropanolamine in its formulation samples and urine with a nice Nernstian response over a relatively wide working range.
Also, in this study we use DFT atomic population analysis to measure a Ligand-drug complexing by looking at the ability of the ligand to change in atomic charges and bond length of drug.
2. EXPERIMENTAL PART
2.1. Apparatus
and a double-junction saturated calomel electrode (SCE, Philips). The cell chamber was filled with an ammonium nitrate solution and both electrodes were connected to a Corning ion analyzer with a 250 pH/mV meter with ±0.1 mV precision.
2.2. Materials and Reagents
The necessary chemicals (of analytical reagent grade) were: high-molecular weight polyvinylchloride (PVC) (Fluka Co.), sodium tetraphenylborate (NaTPB), dibutyl phthalate (DBP), nitrobenzene (NB) and tetrahydrofuran (THF) (Merck Co.). All the materials were at the highest available purity and were submitted to no further modification. Phenylpropanolamine hydrochloride and its tablets were obtained from different local pharmaceutical factories.
2.3. Preparation of ion-pair compound
Ion-pair compound of phenylpropanolamine-tetraphenylborate (PPA-TPB): About 20 mL of 0.01 M solution of phenylpropanolamine hydrochloride was mixed with 20 mL of 0.01 M solution of tetraphenylborate under stirring. The resulting precipitate was filtered off, washed with water and dried.
2.4. Preparation of the electrodes
The general procedure to prepare the PVC membrane was as follow: Different amounts of the ion-pair along with appropriate amounts of PVC, plasticizer and additive were dissolved in tetrahydrofuran (THF), and the solution was mixed well.The resulting mixture was transferred into a glass dish of 2 cm diameter.The solvent was evaporated slowly until an oily concentrated mixture was obtained. A pyrex tube (3-5 mm o.d.) was dipped into the mixture for about 10 s so that a transparent membrane of about 0.3 mm thickness was formed. The tube was then pulled out from the mixture and kept at room temperature for about 10 h. The tube was then filled with an internal filling solution (1.0×10⁻³ M phenylpropanolamine hydrochloride). The electrode was finally conditioned for 24 h by soaking in a 1.0×10⁻³ M phenylpropanolamine hydrochloride solution.
2.5. Standard phenylpropanolamine solutions
A stock standard solution of 0.02 M phenylpropanolamine hydrochloride was prepared by dissolving 0.275 g of pure drug in 100 ml distilled water. The working solutions (1×10⁻⁷ to 1×10⁻² M) were prepared by appropriate dilution of the stock solution with water.
2.6. The emf measurements
Ag–AgCl | internal solution, 1×10⁻³ M phenylpropanolamine.HCl | PVC membrane | sample solution | Hg–Hg2Cl2, KC1 (satd.)
These measurements were preceded by the calibration of the electrode with several phenylpropanolamine.HCl solutions (working solutions).
2.6. Computational methods
Calculations on the isolated molecules and molecular complexes were performed within GAUSSIAN 98 package [14].
Each species was initially optimized with PM3 method and, then the optimized structures were again optimized with density functional theory using the 6-31G* basis set. Full geometry optimizations and frequency calculations were performed and each species was found to be minima by having no negative values in the frequency calculation. The calculations gave internal energies at 0 K. In order to obtain gas phase free energies at 298.15 K, it is necessary to calculate the zero-point energies and thermal corrections together with entropies to convert the internal energies to Gibbs energies at 298.15 K [15,16].
Frequency calculations on these structures verified that they were true minima and provided the necessary thermal corrections to calculate H (Enthalpy) and G (Gibbs free energy). Finally, full optimizations and frequency calculations for each species were performed with the DFT/6-31G* [17, 18].
The other one-electron properties (dipole moment, polarizability, energies of the frontier molecular orbital) were also determined at the B3LYP/6-31G* level. For the charged species, the dipole moment was derived with respect to their mass center, because for the non-neutral molecules the calculated dipole moment depended on the origin of the coordinate system.
The stabilization energies of the selected complexes were determined with the help of the DFT calculations and calculated with a recently introduced method, based on the combination of the approximate tight-binding DFTB with the empirical dispersion energy. The DFT methods are known to be inherently very deficient for stacking interactions, as they basically ignore the dispersion attraction [19-21]. As a consequence, their enlargement by an empirical dispersion term currently appears to be a very reasonable way to improve the major deficiency of the DFT method for the evaluation of the molecular complexes. It should also be mentioned that the interaction energies were obtained as the difference between the complex energy and the combined energies of the molecules in isolation [22].
3. RESULTS AND DISCUSSION
3.1. Computational study
[image:5.612.239.373.146.274.2]
optimized geometries and numeration of the atoms of the studied molecules, L1 for NaTPB, L2 for KTpClPB, Drug for PPA, Drug-L1 for PPA-TPB and Drug-L2 for PPA-TpClPB, are presented in Figs. 2 to 6, respectively.
[image:5.612.233.378.354.499.2]Figure. 2. The full optimized structure of L1
Figure. 3. The full optimized structure of L2
[image:5.612.242.371.591.665.2]
Figure. 5. The full optimized structure of L1-PPA complex
Figure. 6. The full optimized structure of L2-PPA complex
To obtain a clue on phenylpropanolamine tendency for L1 and L2 as potential ionophores, DFTB calculations (B3LYP/6-31G*) were carried out. The pair wise interaction energy ∆EA–B between molecules A (L1 or L2) and B (the drug) was estimated as the difference between the energy of the formed complex and the energies of the isolated partners. The interaction energies were corrected for the basis set superposition error using the counterpoise method [25, 26].
∆EA–B = EA−B − EA − EB
which obtained to be -81.088 and -61.680 Kcal/mol for ∆EL1 and ∆EL2 , respectively that indicates L1 is a more appropriate ionophor for phenylpropanolamine sensor in comparison to L2, which is contributed to its higher interaction energy. The main discussions are going to be on L1-PPA interaction afterward.
[image:6.612.222.390.242.360.2]
(from 0.232 to 0.027) and it’s connected carbon atoms. Additionally, the bond lengths also changed as a result of ion pair formation (Table 1). According to Table 1, the maximum bond length change occurred in drug belongs to O9-H16which indicates the hydrogen (the most positive charge) interacts with L1 (that has negative charge).
Table 1. Significant computed atomic charges and bond length for phenylpropanolamine and L1 before and after the complex formation
Some important atomic charges Atom No.
PPA PPA-L1
O9 -0.277 -0.283
H10 0.090 0.077
H16 0.212 0.195
N18 -0.351 -0.369
H20 0.206 0.199
H21 0.207 0.196
H22 0.111 0.099
H24 0.124 0.122
Bond lengths
R(9,16) 1.010 1.165
R(7,9) 1.433 1.435
R(8,17) 1.539 1.541
R(8,18) 1.548 1.520
R(18,19) 1.040 1.063
R(18,20) 1.040 1.057
R(18,21) 1.044 1.037
HOMO -11.35 2.77 for L1
LUMO 3.22 10.94 for L1
High values of polarizability (155.772 and 75.578 for L1 and drug, respectively) prove its effective role on interactions between L1 and the drug. While the low values of dipole-dipole interactions (especially for that of L1=0.0 and for drug=8.3D) show that it does not play a significant role on interactions exist among L1 and the studied drug. Moreover, electrostatic interactions should also be considered. As can be seen in Table 1, atom charges are delocalized on L1 while they are localized on the drug.
[image:7.612.187.425.200.478.2]
3.2. Membrane composition influence and selection
Because the sensitivity and selectivity degree of an ion-pair based electrode is greatly related to the membrane ingredients, the membrane composition influence on the potential responses of the phenylpropanolamine sensor was inspected. Actually, the operating characteristics of the ISEs can be significantly modified by changing the relative proportions of the electrode membrane components. The main components of an electrode membrane of this type are PVC matrix, the plasticizer and the ion-pair. Each membrane component plays a special role in the membrane function [29-32].
The plasticizer mainly acts as a fluidizer, allowing homogeneous dissolution and diffusional mobility of the ion-pair inside the membrane. The nature and/or the amount of the plasticizer must be properly controlled in order to minimize the electrical asymmetry of the membrane and to limit fouling of the sensor. The nature of the plasticizer has a marked influence on the response slope, linear domain and also on the selectivity of the PVC membrane electrodes. Here, many plasticizer types were tested, namely benzyl acetate (BA), dibutyl phthalate (DBP), nitrobenzene (NB) as listed in Table 2. After their evaluation, DBP, having the lower dielectric constant than other plasticizers was chosen to be employed in the sensor construction, because it provided an effective linear range and a lower detection limit which is due to the better extraction of the phenylpropanolamine in the organic layer [33,34].
[image:8.612.127.482.468.722.2]As it can be seen from Table 2, the absence of the ion-pair in the membrane results a very poor response (membrane no.8), which is shows the significance of the ion-pair. As a conclusion, the membrane no. 2 with the composition of 30% PVC, 5% ion-pair, and 65% DBP was the optimum one for the sensor design.
Table 2. Optimization of the membrane ingredients
Linear range (M) Slope (mV/decade) Ion-pair (% w) Plasticizer (% w) PVC (% w) Membrane no.
1.0× 10⁻⁵ -1.0 × 10⁻² 32.3± 0.3
4 DBP, 66
30 1
1.0× 10⁻⁵ -1.0 × 10⁻² 55.9± 0.4
5 DBP, 65
30 2
5.0× 10⁻⁵ -1.0 × 10⁻² 32.2± 0.3
6 DBP,64
30 3
1.0× 10⁻⁴ -1.0 × 10⁻² 36.5 ± 0.2
7 DBP,63
30 4
1.0× 10⁻⁵ -1.0 × 10⁻² 21.3± 0.3
5 NB, 65
30 5
5.0× 10⁻⁵ -1.0 × 10⁻² 28.2± 0.2 6 DBP, 62 NaTPB,2 30 6
1.0× 10⁻⁵ -1.0 × 10⁻² 22.5± 0.4
5 BA, 65
30 7
7.0× 10⁻⁴ -2.0 × 10⁻³ 5.3± 0.3
- DBP, 70
3.3. Calibration graph and statistical data
In line with the no. 2 membrane performance, the sensor exhibited a detection limit of 1.0×10⁻⁵ M, a calibration graph slope of 55.9±0.4 mV/decade of the phenylpropanolamine concentration and a standard deviation of ±0.4 mV after eight replicate measurements. Also, it presented a linear response towards the phenylpropanolamine.HCl concentration from 1.0×10⁻⁵-1.0×10⁻² M during the phenylpropanolamine.HCl concentration variation of the internal reference solution (Fig. 7).
The detection limit was calculated from the intersection of the two extrapolated segments of the calibration graph.
y = 55.907x + 190.65 R2 = 0.995
-110 -90 -70 -50 -30 -10 10 30 50 70 90
0 1 2 3 4 5 6 7 8
pPhenylpropanolamine
E
(m
V
[image:9.612.187.408.226.402.2])
Figure. 7. Calibration curve of the phenylpropanolamine membrane sensor with the composition of the membrane no. 2. The results are based on 8 measurements.
3.4. Dynamic response time of the phenylpropanolamine-basedsensor
Dynamic response time is the required time for the sensor to reach values within ±1 mV of the final equilibrium potential [6], after successive immersions in the phenylpropanolamine solutions. Its calculation involved the variation and the recording of the phenylpropanolamine concentration in a series of solutions from 1.0×10⁻⁵ to 1.0×10⁻² M. The sensor was able to reach quickly its equilibrium response (~10 s) in the whole concentration range.
3.5. pH effect on the electrode response
Relatively noteworthy fluctuations in the potential vs. pH behavior took place below and above the formerly stated pH limits.In detail, the fluctuations above the pH value of 6.0 might be justified by removing the positive charge on the drug molecule and the fluctuations below the pH value of 4.5 were attributed to the removing the ion-pair in the membrane.
3.6. Life-time study
The phenylpropanolamine-selective electrode lifetime was estimated with the creation of its calibration curve, the periodical test of a standard solution (1.0×10⁻⁵-1.0×10⁻²M, phenylpropanolamine.HCl) and the calculation of its response slope.
For this estimation, four same electrodes were employed extensively (2 hour per day) for 10 weeks. After their 7 week utilization, two changes were observed. Firstly, a slight gradual decrease in the slope (from 55.9±0.4 to 52.2±0.3 mV/decade) and, secondly, an increase in the detection limit (from 1.0×10⁻⁵ M to 7.5×10⁻⁴ M).
3.7. Analytical Application
3.7.1. Recovery test from the phenylpropanolamine tablet
The proposed sensor was evaluated by measuring the drug concentration in some pharmaceutical formulations. The recovery results are shown in Table 3.
[image:10.612.90.521.493.606.2]The drug concentration was determined with the calibration method. Obviously, the results are in satisfactory agreement with the labeled amounts. The RSD was equivalent to 3.0% with a corresponding recovery percentage value of 99.25%.
Table 3. Potentiometric determination of phenylpropanolamine in some pharmaceutical formulations
Applied sample Labeled amount
(mg/tab. )
Found* (mg/tab. )
Sample 1 25 25.3±0.4
Sample 2 25 25.9±0.2
Sample 3 25 25.3±0.4
* The results are based on triplicate measurements
3.7.3. Recovery of phenylpropanolamine from urine samples
of 10-3 M phenylpropanolamine solution was transferred into a 10 mL volumetric flask. After addition of a 2.5 mL of urine samples, the solution was diluted to the mark with water. The phenylpropanolamine content of the solution was then determined by the proposed electrode, using the calibration method. The recovery from three replicate measurements was found to be 100.1 %, 100.5 % and 99.3 %, respectively.
3.8. Validation of Method
The linearity, limit of detection, selectivity, precision, accuracy, and ruggedness/robustness were the parameters which were used for the method validation.
As mentioned before, the measuring range of the phenylpropanolamine sensor is between 1×10⁻⁵ and 1×10⁻² M. The detection limit of the sensor was calculated 1.0×10⁻⁵ M.
3.8.1. Selectivity
Selectivity, which describes an ion-selective electrode’s specificity toward the target ion in the presence of interfering ions, is the most important characteristic of these devices. The potentiometric selectivity coefficients of the phenylpropanol amine sensor were evaluated by the matched potential method (MPM) [35-37].
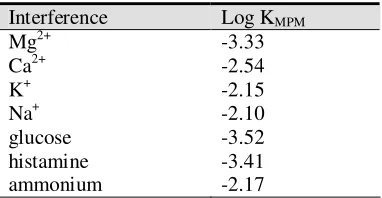
[image:11.612.211.402.482.581.2]The resulting values of the selectivity coefficients are given in Table 4. As can be seen from Table 4, in all cases the selectivity coefficients are about 10-3, which seems to indicate negligible interferences in the performance of the electrode assembly.
Table 4. Selectivity coefficients of various interfering compound for phenylpropanolamine sensor
Interference Log KMPM
Mg2+ -3.33
Ca2+ -2.54
K+ -2.15
Na+ -2.10
glucose -3.52
histamine -3.41
ammonium -2.17
3.8.2. Precision
phenylpropanolamine concentrations of 4.04, 41.5, 403.6 µg/ml and associated RSD values of 1.72, 1.02, and 0.27%, respectively.
3.8.3. Accuracy
The relevant error percentage and accuracy were calculated in each above case. The resultant concentrations were 4.04±0.03, 41.5±0.4, and 403.6±1.3 µg/ml with relevant error percentages of 3.23, 1.66, and 0.25%, respectively.
3.8.4. Ruggedness/Robustness
For ruggedness of the method a comparison was performed between the intra- and inter-day assay results for phenylpropanolamine obtained by two analysts. The RSD values for the intra- and inter-day assays of phenylpropanolamine in the cited formulations performed in the same laboratory by the two analysts did not exceed 4.3%. On the other hand, the robustness was examined while the parameter values (pH of the eluent and the laboratory temperature) were being slightly changed. Phenylpropanolamine recovery percentages were good under most conditions, not showing any significant change when the critical parameters were modified.
4. CONCLUSIONS
In the presented paper, types of interactions exist between a drug and ligands were studied. Since the studied molecules were in form of ions that resulted in ion pair formation, DFT method which also considers dispersion energies in addition to those calculated using DFT was used for further investigations. These theoretical calculations help selecting appropriate ionophores and also predicting their selectivity for different drugs. After a number of experiments involving the usage of PPA-TPB ion-pair complexes along with several plasticizers in the membrane design, it was concluded that the phenylpropanolamine sensor exhibited good analytical performance characteristics. It demonstrated an advanced performance with a fast response time (~10 s), a lower detection limit of 1.0×10⁻⁵ M and potential responses across the range of 1.0×10⁻⁵–1.0×10⁻² M. This sensor enabled the phenylpropanolamine determination in laboratory titrations and to measurement of the drug rate release from its formulation.
ACKNOWLEDGEMENTS
The authors are grateful to the Research Council of University of Tehran for the financial support of this work.
References
2. [Online] available: http://en.wikipedia.org/wiki/Phenylpropanolamine 3. D. Burke, V. S. Venturella, B. Z. Senkowski, J. Pharm. Sci. 63 (1974) 269.
4. K. P. R. Shenoy, K. S. Krishnamurthy, V. Iyengar, J. Harsha, Indian J. Pharm. Sci. 64 (2002) 398. 5. T. H. King, C. K. Mann, T. J. Vickers, J. Pharm. Sci. 74 (1985) 443.
6. M. R. Ganjali, P. Norouzi, M. Rezapour, Encyclopedia of Sensors, Potentiometric Ion Sensors, American Scientific Publisher (ASP), Los Angeles, 2006, Vol. 8, pp. 197-288.
7. F. Faridbod, M. R. Ganjali, B. Larijani, P. Norouzi, S. Riahi, F. S. Mirnaghi, Sensors, 7 (2007) 3119.
8. S. Riahi, M. R. Ganjali, P. Norouzi, F. Jafari, Sens. Actuators B, 132 (2008) 13.
9. S. Riahi, A. B. Moghaddam, M. R. Ganjali, P. Norouzi, Spectrochim. Acta Part A, 71 (2008) 1390. 10.S. Riahi, M. R. Ganjali, A. B. Moghaddam, P. Norouzi, S. S. Hosseiny Davarani, Spectrochim.
Acta Part A, 70 (2008) 94.
11.S. Riahi, P. Norouzi, A. B. Moghaddam, M. R. Ganjali, J. Theor. Comput. Chem. (JTCC), 6 (2007) 255.
12.S. Riahi, P. Norouzi, A. B. Moghaddam, M. R. Ganjali, J. Theor. Comput. Chem. (JTCC), 6 (2007) 331.
13.S. Riahi, M. R. Ganjali, P. Norouzi, J. Theor. Comput. Chem. (JTCC), 7 (2008) 317.
14.M. J. Frisch, G. W. Trucks, H. B. Schlegel, G. E. Scuseria, M. A. Robb, J. R. Cheeseman, V. G. Zakrzewski, et al., Gaussian Inc. Pittsburgh, PA, 1998.
15.J. J. P. Stewart, J. Comp. Chem. 10 (1989) 210. 16.J. J. P. Stewart, J. Comp. Chem. 10 (1989) 221.
17.W. Yang, Q. Wu, Direct Method for Optimized Effective Potentials in Density-Functional Theory, Physical Review Letters, 2002.
18.R. G. Parr, W. Yang, Annu Rev. Phys. Chem., 46 (1995) 701.
19.F. B. Duijneveldt, R. J. G. C. M. Duijneveldt-van de, J. H. Lenthe, Chem. Rev., 94 (1994) 1873. 20.T. A. Nieaus, M. Elstner, T. Frauenheim, S. Suhai, J. Mol. Struct. (THEOCHEM), 541 (2001) 185. 21.H. Y. Zhou, E. Tajkhorshid, T. Frauenheim, S. Suhai, M. Elstner, Chem. Phys., 277 (2002) 91. 22.P. Hobza, R. Zahradnik, Intermolecular Complexes, Elsevier, Amsterdam, 1988.
23.M. R. Ganjali, M. Tavakoli, F. Faridbod, S. Riahi, P. Norouzi, M. Salavati-Niassari, Int. J. Electrochem. Sci., 3 (2008) 1169.
24.M. R. Ganjali, T. Razavi, R. Dinarvand, S. Riahi, P. Norouzi, Int. J. Electrochem. Sci., 3 (2008) 1543.
25.M. J. Frisch, J. E. Del Bene, J. S. Binkley, H. F. Schaefer, J. Chem. Phys., 84 (1986) 2279. 26.D. W. Schwenke, D. G. Truhlar, J. Chem. Phys., 82 (1985) 2418.
27.M. R. Ganjali, P. Norouzi, F. Faridbod, S. Riahi, J. Ravanshad, J. Tashkhourian, M. Salavati-Niasari, M. Javaheri, IEEE Sens. J., 7 (2007) 544.
28.M. R. Ganjali, P. Norouzi, F. Sadat Mirnaghi, S. Riahi, F. Faridbod, IEEE Sens. J., 7 (2007) 1138. 29.F. Faridbod, M. R. Ganjali, R. Dinarvand, P. Norouzi, S. Riahi, Sensors, 8 (2008) 1645.
30.V. K. Gupta, A. K. Jain and G. Maheshwari, Int. J. Electrochem. Sci., 2 (2007) 102. 31.M. Shamsipur, F. Jalali, S. Haghgoo, J. Pharm. Biomed. Anal., 27 (2002) 867. 32.S. Khalil, A. Kelzieh, S. A. Ibrahim, J. Pharm. Biomed. Anal., 33 (2003) 825.
33.M. R. Ganjali, Z. Memari, F. Faridbod, P. Norouzi, Int. J. Electrochem. Sci., 3 (2008) 1169. 34.V. K. Gupta, S. Chandra, S. Agarwal and H. Lang, Sens. Actuators B, 107 (2005) 762.
35.M. R. Ganjali, R. Nemati, F. Faridbod P. Norouzi, and F. Darviche, Int. J. Electrochem. Sci., 3(2008) 1288.
36.R. K. Mahajan and P. Sood, Int. J. Electrochem. Sci., 2 (2007) 832. 37.P. R. Buck, E. Lindneri, Pure & Appl. Chem., 66 (1994) 2527.