This is a repository copy of How steep is that street?: Mapping ‘real’ pedestrian catchments by adding elevation to street networks.
White Rose Research Online URL for this paper: http://eprints.whiterose.ac.uk/138242/
Version: Accepted Version
Article:
Daniel, P and Burns, L orcid.org/0000-0003-0164-3668 (2018) How steep is that street?: Mapping ‘real’ pedestrian catchments by adding elevation to street networks. Radical Statistics (121). pp. 26-48. ISSN 0268-6376
c) The Author(s). This is an author produced version of a paper published in Radical Statistics. Uploaded with permission from the publisher.
Reuse
Items deposited in White Rose Research Online are protected by copyright, with all rights reserved unless indicated otherwise. They may be downloaded and/or printed for private study, or other acts as permitted by national copyright laws. The publisher or other rights holders may allow further reproduction and re-use of the full text version. This is indicated by the licence information on the White Rose Research Online record for the item.
Takedown
If you consider content in White Rose Research Online to be in breach of UK law, please notify us by
How steep is that street?: Mapping
ÔrealÕ pedestrian catchments by
adding elevation to street networks
Poppea Daniel & Luke Burns
Abstract
selection. Discussion: This research builds on existing established practice in walkability analysis, incorporating the often-overlooked steepness variable as a key statistical element of the walking experience. It also prompts a discussion on other factors which may
affect walkability and could be included in a more sophisticated walkability index.
Keywords: ÔPed-shedÕ, Walkability, Urban Road Networks, Catchment, Slope
Introduction
Walkability is a widely used concept connecting many divergent fields, including transportation planning, sustainability, sociology, health and urban design (Talen & Koschinsky, 2013). It is defined broadly as the level to which walking in a given area is deemed to be both practical and present, often relating to a number of factors such as air
quality, safety, crime, mixed-use neighbourhoods, sidewalks/pathways, transit and, arguably most importantly, urban density (Spacey, 2016).
services within easy walking distance. In fact, walkability is both a motivation and consequence of a more holistic approach to city design.
There is a widespread environmental and sustainability goal of
reducing car-centric urbanism by creating walkable pedestrian environments, related to the degree to which neighbourhoods are compacted (Frey, 1999). The geometry of street networks can have a big influence on whether shops and services are likely to cluster in an area. More interconnected networks and more central streets can support more shops and services (Mehaffy, et al., 2010; Porta et al., 2012). These networks are inherently more walkable (more connections mean shorter blocks), and this walkability can in turn reinforce the economic diversity and vibrancy of an area making it more attractive to retailers, not to mention improving environmental and human health conditions as a result.
their neighbourhood shop, school or bus stop (UTF, 1999). The hierarchical network of urban districts and distinct neighbourhoods advocated by this UTF report and other work also call for Ôpyramids of intensityÕ; that is, density being higher towards the centre of each
neighbourhood and district within the hierarchy. These conceptual ÔringsÕ around nodes have become important tools in concept planning in urban design.
ItÕs easy to draw conceptual pedestrian catchments around clusters of shops and services on masterplans, but these are commonly Euclidian Ôas the crow fliesÕ catchment distances and as such not representative of reality.
Figure 1 illustrates such basic practice whereby conceptual circles are drawn around locations based solely on Euclidian distance with this then translated into time with few (if any) additional constraints considered.
layout of streets might be altered to increase pedestrian walkable catchments. When trying to determine required residential density to support certain types of shops and services, then, actual walkable catchments are invaluable.
Such mapping is a considerable improvement on conceptual circles and is more recently being used in city and transportation design, sometimes with sophisticated extensions including accounting for the presence of traffic lights and the number of street crossings.
Figure 1. Walkable catchment areas are commonly represented as conceptual circles around a node.
[image:6.595.189.384.369.569.2]actual walking distances along a new proposed street network is made, with shorter blocks and more intersections. Milton is at the limits of GlasgowÕs boundary, around 2.5 miles north of the city centre, and was built between 1940 and 1960 as part of the cityÕs
slum clearance program. Its street network is characterised by oversized blocks and long roads, sometimes broken up by pedestrian paths (UK Housing, 2016).
actual distance walked, not the linear (Euclidian) distance (pedshed.net, 2016).
To provide evidence for this assumption, a comparison is undertaken
of the performance of both networks when the elevation of the streets is accounted for. This also considers whether the impact of topography is mitigated by a more densely interconnected street network.
Data
The key input to any walkability analysis is data on streets and paths (location, directionality, length etc). Geographical Information Systems (GIS) software reads this vector data as a series of connected, georeferenced polylines. These polylines are read in a two-dimensional space, as if the landscape is perfectly flat at all times. Walkability and Ôped-shedÕ analyses to date focus almost exclusively on this premise.
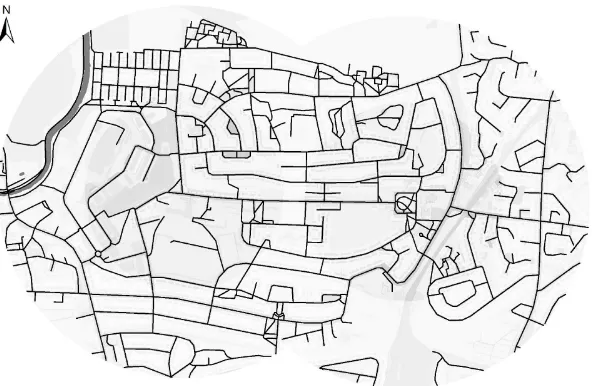
Figure 2. The combined existing street and path network in a subsection of Milton, Glasgow. Data adapted from OS ITN and Urban Paths layers, 2017.
For the proposed network, the two layers shown in Figure 2 were taken as the base, then edited with the changes according to a concept plan for the study area.
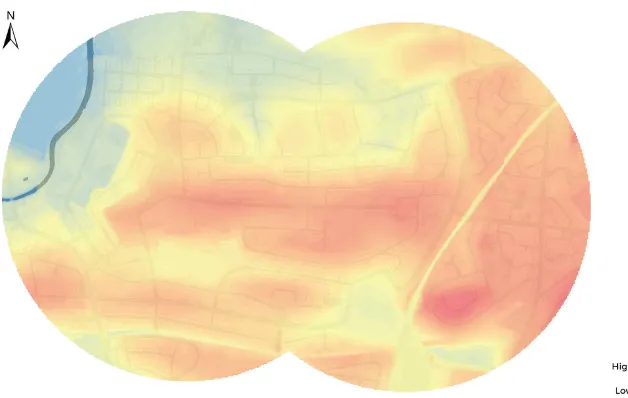
[image:10.595.135.431.89.282.2]Figure 3. Digital Terrain Model showing elevations for a subset of Milton, Glasgow. Data sourced from OS Terrain 5 (2016).
To provide context, Ordnance SurveyÕs Topography layer was also used. This offers a useful backdrop of information, including buildings and water bodies. For this analysis, each category of topographic information in this vector layer was assigned a grayscale colour.
[image:11.595.138.452.79.278.2]containing two geo-referenced points for this purpose, both within the Milton area of Glasgow.
Methodology
Analysing walkable catchments across a 2D network is relatively straightforward. To analyse walkable catchments taking elevation into account is more complex and requires a clear methodological framework with several steps. The following sub-sections evidence this framework.
Logic
The logic of adding elevation information into walkability analysis starts from the premise that more effort is required to walk uphill or down steep slopes, this is deemed common sense even if it is under researched in the field to date. Using 2D distance misses something of the reality of the pedestrian (or cyclist) experience, and walkability could be considerably misstated, particularly over hilly and irregular terrains.
Effort is related to speed. ToblerÕs hiking function is an equation which calculates anisotropic distance based on time Ð that is, average walking speed taking into account the slope of the terrain (anisotropic
because the time-distance is not the same in both directions) (see Figure 4 for a graphical illustration). The equation for ToblerÕs hiking function was originally estimated from empirical data and is used widely in analyses modelling slope as a contributor to route selection (Tolber, 1993). The equation is as follows:
where is walking speed in kilometres per hour (km/ph) and is the slope (the differential of elevation difference and distance). Where the
Figure 4. ToblerÕs hiking function models anisotropic distance based on time. Going up is slow progress, but so is going down when paths are steep.
The methodology/framework used in this research is as follows:
1. Add elevation data to the street network.
2. Calculate, according to ToblerÕs function, the speed at which each segment of the network can be traversed.
3. Using the equation Time = Distance / Speed, calculate from the speed (metres per minute) the time in minutes taken to traverse each segment going uphill, and going downhill.
5. For 2D distance, ignore ToblerÕs function and use the equation
Time = Distance / Speed to calculate the time in minutes taken to traverse each flat segment, using a base speed of 5km/ph. Multiply this time by 2 to obtain the round-trip time.
6. For each neighbourhood node, use the Network Analyst extension function in ArcGIS to calculate isochrones depicting walkable catchments along the network for 5- and 10-minute round-trips. Network AnalystÕs Service Area function uses the Dijkstra Shortest Path algorithm, which solves the single-source shortest-path problem.
The 400m / 5 minute conceptual catchments frequently used in urban and transport design and planning equates to a flat walking speed of 4.8km/ph. Five and ten minute round-trips calculated with this method roughly correspond to conceptual 200m and 400m catchments.
Limitations
Analyst does not automatically know which value to use when standing at the start point Ð it does not know in relation to this point whether a segment goes uphill or downhill. With advanced programming knowledge, it would be possible to inform Network
Analyst which slope (speed) to use.
the walkable catchment if either the to- or from-journey, in reality, deviates onto a less steep path.
The round-trip compromise is more meaningful than the next-best
alternative, though, which is to calculate catchment based on absolute positive slope, which just produces a Ôworst caseÕ catchment ignoring direction.
The other limitation comes from using speed as a proxy for effort in adding impedance to the networks. There may be a cut-off point for walking uphill, which may put off even the fittest of pedestrians. In calculating effort, itÕs not only ÔspeedÕ which matters. Energy expenditure or perceived effort may be just as, if not more, important.
This consideration leads to several ideas for extensions of the analysis, discussed further later in the paper.
Technical steps
network.
Segments on the graph are pieces of line between two intersections. In a sparse network, intersections can be quite widely spaced, and so
elevation differences along that piece of line can vary considerably. Figure 5 shows possible elevations of a street between two points. Street (A) has a constant slope along the whole segment, so its elevation is well-described by minimum, maximum and average slope. Street (B) follows are much more irregular trajectory, culminating at a higher elevation than its start point, but via several peaks and troughs. Taking an average slope of this whole segment would not describe its trajectory well. Clearly, in order for these figures to be meaningful, segments must be reasonably short: it is not possible to rely on long segments similar to (A) to accurately describe slope, but the shorter the distance between two points is, the closer it resembles (A), even when the overall trajectory of the street is irregular, like (B).
is, as a consequence, meaningful.
Figure 5. The shorter segments of street are, the better an average slope measure approximates the true slope of that segment.
At this stage, a street network in which every segment (maximum length 2 metres) has a new absolute average slope attribute (in percent) is present. The attribute table can then be exported to a spreadsheet for further manipulation.
In the spreadsheet environment (using Microsoft Excel in this research), further attributes were added to the dataset for each individual segment:
● Uphill slope in radians (radians are required by the tan function)
[image:19.595.174.421.107.338.2]● Downhill slope in radians, equal to uphill slope in radians multiplied by -1.
● Uphill speed in km/ph, calculated according to ToblerÕs hiking
function, where = (uphill slope in radians).
● Downhill speed in km/ph, where S = (downhill slope in
radians).
● Uphill time in minutes, calculated by converting uphill speed in km/ph to metres per hour (metres/ph), and using Uphill time = (length of segment / speed) * 60, where length of segment is in metres, speed is in metres/ph, and the resulting uphill time is in minutes.
● The equivalent for downhill speed.
● The sum of uphill and downhill time in minutes, 3D roundtrip =
uphill time + downhill time.
● Time taken to traverse segment without elevation at a constant speed of 5km/ph (5,000 metres/ph), where Time at flat speed = (length of segment / 5000) * 60.
● The sum of to- and from- journeys in minutes, 2D roundtrip = 2 *
Time at flat speed.
With these calculations complete, the table was then re-joined onto
calculated uphill and downhill speeds for each segment of the existing network in Milton, Glasgow.
Figure 6. Downhill speeds on street segments in existing street network. Since going downhill (at least at small inclines), is easier than going uphill, most segments can be traversed at 5-6km/ph downhill.
[image:21.595.106.486.159.366.2] [image:21.595.121.478.463.661.2]Next, ArcGISÕs Network Analyst extension was used to create a routable network dataset from this information. When creating the dataset, it is worth flagging two possible impedances based on the table attributes: 3D minutes (which takes into account elevation), and
2D minutes (which does not).
Finally, again using Network Analyst, walkable catchments were calculated (Ôservice areasÕ) for each node (ÔfacilityÕ), using first 2D minutes and then 3D minutes as impedance, with break values at 5- and 10- minute round trips. Catchments extend 30m either side of the street segment.
Analysis of results
Figures 8-14 map the results of the two sets of walkability analysis and are discussed in the forthcoming sections.
If the world was flat: existing versus proposed
street network
400m-western node are covered with the existing network of streets and paths (Figure 8). Following the new street network, 50% (east) and 56% (west) are covered (Figure 9). Decreasing the distance between intersections increases the number of intersections and the likelihood
of shorter, more direct routes from A to B.
This highlights the merits of making the transition from conceptual time or distance catchments to actual distances along a street network. For example, firstly, even a highly dense, gridded network will not achieve 100% coverage of the conceptual circle. Second, the structure of the street network clearly impacts the walkability of an area; the conceptual circle indicates the same coverage regardless of the network, which is misleading at best, and could lead to very inefficient decisions being made.
But the world is ÔhillyÕ: ÔrealÕ walkability of
street networks
Following the existing street network (Figure 12), taking topography into account reduces the percentage coverage of the conceptual eastern catchment to just 36%, from 44%, and of the western catchment to 33% from 43%: from an already fairly low base, the
reality is around 20% less walkable than the 2D analysis implies (Figure 11).
Following the proposed street network (Figure 13), the difference is less stark. The percentage coverage of the conceptual eastern catchment falls to 46% from 50%; the western from 56% to 53%. This is 5-10% less walkable than the 2D analysis suggests (Figure 14)
This analysis highlights two important points. First, even with this slightly generous measure of the 10-minute round-trip, real walkability is considerably lower than the basic 2D analysis implies. Clearly, it is important for those involved in the built environment to consider topography when conducting walkability analysis and evaluating proposals.
interconnected the street network, then, the closer the simple 2D analysis is to the walkable reality.
Figure 8. The much denser proposed street network around the western node increases the walkable 10-minute roundtrip catchment by 26%.
[image:25.595.94.520.155.381.2]Figure 10. 5- and 10-minute walkable catchments following the proposed network, without accounting for topography.
[image:26.595.100.456.87.310.2] [image:26.595.97.508.422.640.2]Figure 12. 5- and 10-minute walkable catchments following the existing network, accounting for topography.
[image:27.595.99.473.103.326.2] [image:27.595.90.465.433.656.2]Figure 14. Difference between walkable catchments following the proposed network, with and without accounting for topography. Catchments are around 20% smaller once topography is accounted for.
Improvements and extensions
[image:28.595.99.512.88.308.2]into the model as catchment areas taken from the ÔedgesÕ of a line of shops will differ from catchments calculated from centroids. Third, the catchments highlight all land area within a 30m distance of the street centreline. From a master planning perspective, it may be
preferable for catchments to highlight all street edges, plots or buildings which are reached along the walkable line. Fourth, from a transport planning perspective, incorporating population/demographic census information into walkability catchments may provide more useful information to work with.
Limited mobility and accessibility
While walking on foot is one of the most democratic modes of transport, many people are less able or totally unable to walk. While simple walkability analysis is useful, it is basing analyses on ÔaverageÕ walkability only. For those less able (through age, physical disability or handicap, e.g. pushing a wheelchair or pram), there may be slope thresholds above which walking becomes very difficult or impossible,
or specific surfaces on which walking is difficult, and average base walking speed may be much lower.
powered wheelchairs may struggle. Additionally, width and surface of paths will have a big effect on whether a street is deemed passable.
These factors could be incorporated via restrictions and new
evaluators in the network dataset. Segments of the network could be marked as passable or impassable with various mobility levels, according to evidence on what the slope thresholds discussed above might be. Differences in average speed could easily be incorporated by re-calibrating the Tobler function for a lower based speed.
Psychological (and other) factors in route
selection
Although time is a very significant resource for humans, the idea that the general population optimises routes based purely on time is overly simplistic. What has been calculated in this research is essentially a measure of ÔpotentialÕ walkability (as evidenced in Nourian & Sariyildiz, 2012). There are a multitude of other factors which might contribute to a decision on routes, or Ôactual walkabilityÕ. For example:
slopes, which might deter somebody from choosing a certain route even if it is time-minimising.
● Is route selection different depending on climatic conditions (and therefore does a Ôrainy dayÕ catchment differ from a Ôsunny dayÕ
catchment in a significant way?) or time of day (does a Ônight-timeÕ catchment differ from a ÔdayÔnight-timeÕ catchment?)
● Are people less likely to walk at all if the environment itself is unpleasant (which involves an element of subjectivity)? For example, unsafe, badly maintained, poorly lit etc.
● Will the route selection of some less mobile groups depend, for example, on whether there are benches or other street furniture on which to rest on the way?
● Are high footfall routes likely to deter people given the likely time and congestion implications?
Some of these factors are understandably easier to incorporate into a basic walkability analysis than others, but ideally, then, the Ôshortest pathÕ calculation would form only a part of an index contributing to the calculation of walkable catchments.
Bikeability
such as cycling, a Ôbike-shedÕ variant of the Ôped-shedÕ incorporating elevation would be valuable. The impedance over the network would not be calculated according to ToblerÕs hiking function, but a similar anisotropic function to account for the fact that free-wheeling downhill
requires considerably less energy than pedaling uphill. There may also be earlier slope cut-offs for cyclists and to- and from- route selection may differ substantially depending on slopes or perceived slopes. Iseki and Tingstrom (2013) propose a methodology for this form of bike-planning analysis which could be explored to extend this research to other forms of active travel.
Conclusion
catchments as in this research.
The impact of topography, however, has been explored far less. Humans walk in 3D, not 2D, environments, and the slopes of paths
References
Babb, C., Burke, M. & Paul, T. (2011), Developing neighbourhood ÔwalkabilityÕ indices for childrenÕs active transport. Conference paper: World Planning Schools Congress 2011: Planning in an era of
uncertainty and transformation, Griffith University 2011.
Frey, H. (1999), Designing the City: Towards a More Sustainable Urban Form. Taylor & Francis, London.
Giles-Corti, B., Wood, G., Pikora, T., Learnihan, V., Bulsara, M., Van Niel, K., Timperio, A., Mccormack, G. & Villanueva, K. (2010), School site and the potential to walk to school: The impact of street connectivity and traffic exposure in school neighborhoods, Health & place. 17, 545-50. 10.1016/j.healthplace.2010.12.011.
Iseki, H. & Tingstrom, M. (2014), A GIS Bikeability/Bikeshed Analysis Incorporating Topography, Street Network, And Street Connectivity. 13th World Conference on Transport Research, Rio. Available online
at:
http://www.wctrs-society.com/wp/wp-content/uploads/abstracts/rio/selected/3403.pdf (Accessed: 27th February 2017).
Mehaffy, M., Porta, S., Rof•, Y. & Salingaros, N. (2010), Urban nuclei and the geometry of streets: the Ôemergent neighborhoodsÕ model,
Urban Design International, 15, 1, 22-46. DOI: 10.1057/udi.2009.26. Newman, P. & Kenworthy, J. (2006), Urban Design to Reduce Automobile Dependence, Opolis, 2, 1. 35-52.
Nourian, P. & Sariyildiz, S (2012), An Urban Walkability Assessment Model Based On Network Distance Metrics And Topographic Features. Presentation, Delft University of Technology, Netherlands.
Pedshed.net. (2016), Frequently Asked Questions, Available at:
http://pedshed.net/?page_id=5 (Accessed: 19th June 2017).
Spacey, J. (2016), What is Walkability?, Available at:
http://simplicable.com/new/walkability (Accessed: 6th June 2017). Talen, E. & Koschinsky, J. (2013), The Walkable Neighborhood: A Literature Review, International Journal of Sustainable Land Use and Urban Planning, 1, 1. 42-63.
Tobler, W. (1993), Three Presentations on Geographical Analysis and Modeling: Non- Isotropic GeographicModeling; Speculations on the Geometry of Geography; and Global Spatial Analysis, Available online at: https://escholarship.org/uc/item/05r820mz (Accessed: 6th June 2017).
UK Housing, (2016), Milton, Available at:
http://ukhousing.wikia.com/wiki/Milton (Accessed: 6th June 2017). Urban Task Force [UTF], (1999). Towards an Urban Renaissance. London: Department of the Environment, Transport and the Regions, United Kingdom.
Data sources
OS MasterMap Topography Layer [GML geospatial data], Coverage: Milton, Glasgow, Updated December 2016. Using: EDINA Digimap Ordnance Survey Service, Downloaded: February 2017. <http://edina.ac.uk/digimap>
OS MasterMap Integrated Transport Network [GML geospatial data], Coverage: Milton, Glasgow, Updated December 2016. Using: EDINA Digimap Ordnance Survey Service, Downloaded: February 2017. <http://edina.ac.uk/digimap>
OS MasterMap Integrated Transport Network Urban Paths Theme [GML geospatial data], Coverage: Milton, Glasgow, Updated July 2016. Using: EDINA Digimap Ordnance Survey Service, Downloaded: February 2017. <http://edina.ac.uk/digimap>