Evaluation of piezoelectric energy harvester under dynamic
bending by means of hybrid mathematical/isogeometric
analysis
Mahesa Akbar .Jose Luis Curiel-Sosa
Received: 29 August 2017 / Accepted: 9 November 2017
ÓThe Author(s) 2017. This article is an open access publication
Abstract In this paper, a novel hybrid mathematical/ isogeometric analysis (IGA) scheme is implemented to evaluate the energy harvesting of the piezoelectric composite plate under dynamic bending. The NURBS-based IGA is applied to obtain the structural response exerted by the mechanical loading. The dynamic responses conveniently coupled with the governing voltage differential equations to estimate the energy harvested. The capabilities of the scheme are shown with the comparison against analytical and full electromechanical finite element results. As there is no need of fully coupled elec-tromechanical element, the scheme provides cheaper computational cost and could be implemented with standard computational software. Thus, it gives great benefit for early design stage. Moreover, the robust-ness of the scheme is shown by the couple with high order IGA element which has been proven less prone to the shear locking phenomena in the literature. The computational results show greater accuracy on structural responses and energy estimation for a very thin plate compared to the couple with standard finite element method.
Keywords PiezoelectricEnergy harvester Dynamic bendingNon-uniform rational B-spline (NURBS)Isogeometric analysis (IGA)
1 Introduction
In this paper, work on piezoelectric energy harvesting via structural vibration is presented. The numbers of the mathematical/computational model on the piezo-electric energy harvesting has been significantly grown in the past decade. One of the earliest math-ematical models is a cantilevered piezoelectric under base excitation by Erturk and Inman (2008). The model provided the basis for voltage/energy harvested from a piezoelectric composite structure under mechanical vibration and has been validated with experimental results (Erturk and Inman2009).
On the piezoelectric energy harvesting, one of the particular fields that attract constant attention is the analysis of flow-induced/aeroelastic vibration as the source of excitation (piezoaeroelastic energy harvest-ing). The articles by Abdelkefi (2016) and Li et al. (2016) reviewed numerous piezoaeroelastic energy harvesting models developed within the period 2000’s–2015. It can be seen from those reviews, most of the proposed mathematical/computational models were flutter-based harvester for micro-scale applica-tion. In addition, apart from the source of excitation,
M. Akbar (&)J. L. Curiel-Sosa
Department of Mechanical Engineering, The University of Sheffield, Sir Frederick Mappin Building, Mappin Street, S1 3JD, Sheffield, UK
the modeling of the piezoelectric energy harvester nonlinear behavior is also studied in some articles (Pasharavesh et al.2016; Stanton et al.2010).
Flutter-based vibration attracts considerable atten-tion due to its self-sustained oscillatory characteristic, thus providing more sustainable power output (Erturk et al.2010). However, flutter vibration is known for its catastrophic nature. Hence it is considered not appli-cable as the excitation source for a general use public structure, such as civil structure or aerospace structure, i.e. bridge, transport aircraft.
In contrast with the large development of piezo-aeroelastic energy harvesting model, the analysis under normal operational loads such as low-speed wind load on civil structure or cruise and gust load on aircraft structure has received little attention. To the authors’s knowledge, there are only a few articles proposed models for gust load on wing structure (De Marqui Jr. and Maria 2010; Xiang et al. 2015; Tsushima and Su 2016; Bruni et al. 2017) . Akbar and Curiel-Sosa (2016) proposed the model for a more general condition, dynamic bending load. The model has been successfully implemented on a typical transport aircraft wingbox structure under dynamic cruise load.
Akbar and Curiel-Sosa (2016) proposed a hybrid scheme, in which conveniently coupled the piezoelec-tric beam voltage equation with the dynamic responses from FEM and analytical model. By means of this scheme, it is possible to implement the responses from the various computational model (not limited to finite element model) as input to the voltage equation to provide the power output estimation.
In this current paper, a novel hybrid mathematical/ isogeometric analysis (IGA) scheme is presented. The main attribute of NURBS-based IGA is the ability to establish numerical engineering analysis within the same model from the computational engineering design/drawing. Thus, decreasing the cost of numer-ical analysis-design interface and providing more efficient computational process compared to standard finite element (Hughes et al.2005).
The first article of IGA by Hughes et al. (2005) was followed by the development of IGA in structural vibration (Cottrell et al. 2006) and fluid-structure interactions (Bazilevs et al. 2008) which demon-strated an excellent integration with CAD software. The smoothness of NURBS-basis functions has shown a great flexibility on various fluid structure-interaction
problems (Bazilevs et al. 2008). On the analysis of structural vibrations, Cottrell et al. (2006) shows that high-order NURBS-based IGA elements provided more accurate frequency spectra than standard high-order finite elements.
A uniquek-refinement also exists in NURBS-IGA formulation. This strategy involves degree elevation and knot insertion to refine the spaces (Hughes et al. 2005). Standard p-refinement as in FEM adds many degree of freedoms to the overall system, while k -refinement add fewer degree of freedoms yet still manages to obtain a higher order functions. It is also found that the k-version of IGA has better approxi-mation properties per degree of freedom compared to the standard FEM (Evans et al.2009).
In addition, the ease to construct high order and continuous basis functions provided interesting alter-natives on solving high-order PDE problems, i.e., IGA for high-order gradient elasticity (Fischer et al.2011; Khakalo and Niiranen 2017). Moreover, it is also found that higher-order NURBS-based IGA elements are less prone to the effect of mesh distortion (Lipton et al. 2010). Interested readers are referred to the article by Nguyen et al. (2015) for more detailed review of advantageous and disadvantageous/limita-tion of IGA.
In this paper, the advantage of IGA against shear locking phenomena on a thin shells and its effect on the energy harvesting response is focused. A study by Thai et al. (2012) shown that high-order IGA elements are hardly suffer from shear locking phenomena. The shear locking phenomena have been investigated since the early development of finite elements. It happens when the shear energy becomes very dominant compared to the bending energy as the thickness of the element is very small compared to its length (Kwon and Bang2000).
Thai et al. (2012) investigated the benefits of NURBS-based IGA implementation for the structural dynamic problems of the plate with various thickness. At very thin configuration, it was concluded that the high-order IGA elements show more resistance to the shear locking phenomena compares to the standard finite element. This attribute provides an advantage in the modelling of piezoelectric structures which com-monly manufactured as thin-walled structures/plates.
Therefore, the development of IGA shell elements has attracted significant attention in the recent years. Application on various structural mechanic problems and combination with other methods are found in the literature. Combination of IGA with the level set method is utilized for the analysis of complicated cutout plate (Yin et al.2015). The use of simple first shear deformation theory (FSDT) with IGA provides a shear-locking free formulation (Yu et al. 2015). Buckling and free vibration analysis of the function-ally graded material (FGM) plate (Yin et al. 2017). Buckling exerted by thermal and mechanical loads combination (Yu et al. 2017). A combination of extended IGA (XIGA) and level set method for analysis on a plate with internal defects (Yin et al. 2016). In addition, free-locking high order 3D IGA element also has been developed (Lai et al. 2017a) recently.
Over the past few decades, there have been extensive studies FEM model of piezoelectric struc-tures. One of the earliest work was reported by Allik and Hughes (1970). For the first time, the piezoelectric effect incorporated in a finite element formulation of the implementation of the tetrahedral element. Numer-ous works on the development of FEM model of piezoelectric materials from 1970 to 2000 were reviewed by Benjeddou (2000). Over than 100 articles with different types of elements, i.e., solid, shell and beam elements, were developed during this period. Moreover, in the recent years, several advancements, i.e., Moving Kriging technique for mesh-free method (Bui et al. 2011), implementation on Abaqus User Element subroutine (Sartorato et al.2015), Consecu-tive Interpolation technique with quadrilateral ele-ments (Bui et al.2016b), have also provided various alternatives on the piezoelectric structure analysis.
Despite numerous developments on the piezoelec-tric FEM model, almost all of them were implemented for actuator and sensor problems. There are only a few articles addressed energy harvesting purpose. The FEM formulation of piezoelectric energy harvester by De Marqui Jr. et al. (2009) is one of the most cited articles amongst those few. To the author’s knowl-edge, piezoelectric energy harvester model using IGA has not yet been developed. Furthermore, to this date, there are only a few published works presented the development of IGA models for piezoelectric structure.
Willberg and Gabbert (2012) proposed solid NURBS-based IGA piezoelectric elements. While Phung-Van et al. (2015), developed IGA shell for laminated composite plates with piezoelectric layers employing Higher-order Shear Deformation Theory (HSDT). Those models however limited to the appli-cation of sensors and actuators. Further development of piezoelectric IGA models, can be seen in the recent articles of Bui and colleagues. NURBS-based XIGA is implemented for crack problems on piezoelectric plates (Bui 2015) and piezoelectric embedded lami-nated composite (Bui et al.2016a).
In the present work, high order IGA elements and FSDT are implemented to evaluate dynamic response from the laminated piezoelectric composite. The novel scheme coupled the structural responses of IGA and the voltage differential equations is proposed herein. Numerical experiments were carried out on the piezoelectric composite plate with various thickness. The discussion of the results and validation of the scheme are presented in some details.
2 Piezoelectric Energy harvester model
In this section, an introduction to the hybrid mathe-matical/computational piezoelectric energy harvester model is presented. Constitutive equations of piezo-electric materials in the strain-charge form is adopted in the model. The constitutive equation in this form is written as follows (Standards Committee of the IEEE Ultrasonics, Ferroelectrics, and Frequency Control Society1988)
D¼eEþdT ð1Þ
S¼dEþsT ð2Þ
whereD,e,E,T,sandSare the electrical displacement (C/m2), permittivity (F/m), electrical field (V/m),
mechanical stress (N/m2), compliance (m2/N) and mechanical strain of the material. The piezoelectric charge constant,d(m/V), denotes The coupling of the mechanical and electrical domain. It relates how much an electrical load, i.e., voltage, affect the mechanical deformation and vice versa.
1. The electrical field only generated in z-direction
E1¼E2¼0 and E36¼0;
2. Only one mechanical stress components gener-ated in the x-direction T2¼...T6¼0 and
T16¼0;
3. All active layers are driven by the same voltage along z-direction,U3.
Therefore, Eqs. (1) and (2) become
D3 ¼e33E3þd31T1 ð3Þ
S1¼d31E3þs11T1 ð4Þ
The coordinate system adopted for the piezoelectric energy harvester structure is shown in Fig. 1. The structure made of two parts, the substrate/host layers (non-piezoelectric) and the electrically active layers (piezoelectric).
Figure1shows a mechanical bending moment,M
(Nm), is applied to the cantilever structure as well as the electrical resistance load,R(Ohm,X). Transverse displacement, Z, and bending slope, oZ=ox, are generated. In the active layer, the electrical field,E, and the electrical voltage,U, are created due to the structural displacement.
An important aspect here for the piezoelectric structure is that the displacement,Z, is the combina-tion of the displacement due to the mechanical load,
Zmech, and the electrical load,Zelec.
oZ
ox¼
oZmech
ox þ
oZelec
ox ð5Þ
TheZelecis generated by the internal forces due to the
reverse piezoelectric effect. If the reverse effect is not considered in the calculation, the structural responses and energy estimation will be highly inaccurate and overestimated the experimental results (Erturk and Inman2011).
The governing voltage equation of the energy harvester is obtained by the modification of the piezoelectric actuator charge equation of Ballas (2007). The electrical charges of an actuator, Q(x), from the root until a certain point at length x, is expressed as a function of voltage input, U(x) and bending slope, oZðxÞ=ox, with also material and geometrical properties of the beam/plate.
QðxÞ ¼UðxÞbx
h e33
d2
31
s11
d31ðh
2
uh
2
lÞb
2s11h
oZðxÞ
ox
ð6Þ
where b and h are the width and thickness of the piezoelectric layer, while hu andhlare the height of
upper and lower surfaces of the layer to the neutral axis.
As the dynamic load case is considered for the piezoelectric energy harvester, Eq. (6) is evaluated in a time-dependent domain, thus yields
Qðx;tÞ ¼Uðx;tÞbx
h e33
d2 31 s11
d31ðh
2
uh2lÞb
2s11h
oZðx;tÞ
ox ð7Þ
In the piezoelectric energy harvester case, the voltage is not an input, instead it is a response exerted by the mechanical load/structural displacement. The electri-cal load is given by implementing an external resistance load as shown in Fig. 1. Hence, the electrical circuit relationship is obtained as
dQðx;tÞ
dt ¼Iðx;tÞ ¼
Uðx;tÞ
R ð8Þ
where,Iis the electrical current (Ampere) andRis the resistance load (Ohm,X).
Incorporating Eq. (8) to (7) and assumes a harmonic oscillation motion,
Zðx;tÞ ¼ZðxÞeixt ð9Þ
Uðx;tÞ ¼UðxÞeixt ð10Þ
Thus, Eq. (7) becomes
U
R ¼ixC1UixC2
oZðxÞ
ox ð11Þ
where Z and U are the displacement and voltage amplitudes, withxis the mechanical load excitation frequency (rad/s). Whiletandidenote the time (s) and ,
, ,
[image:4.547.48.258.546.637.2]imaginary number, pffiffiffiffiffiffiffi1, with the geometrical and material parameters are defined by
C1¼
bx
h e33
d2
31
s11
ð12Þ
C2¼
d31ðh2uh2lÞb
2s11h
ð13Þ
The reverse piezoelectric effect in Eq. (10) is defined by the component ofC2 (Nm/V) and an admittance
function,Ham(rad/Nm).C2is defined to represents an
internal bending moment,Mpiezo, created by every unit
of harvested voltage.
Mpiezo¼C2U ð14Þ
Ham is the admittance function (rad/Nm) defined to
relate the displacement slope and the internal bending moment,Mpiezo.
oZelec
ox ¼HamMpiezo ð15Þ
Incorporating Eqs. (5), (14) and (15) to Eq. (10), the governing voltage equation of the harvester is obtained as
UðxÞ ¼ ixC2ðxÞ
oZmechðxÞ
ox
1
RþixC1ðxÞ ixC2ðxÞ
2
HamðxÞ
ð16Þ
It is obviously seen in Eq. (16) that the voltage amplitude can be calculated straightforwardly once the displacement due to mechanical loads,oZmech=ox,
and the admittance function, Ham, are known. It is
worth to highlight that with only the input of material/geometrical properties, C2, and the
admit-tance function, Ham is sufficient to represent the
reverse piezoelectric effect. Further, it is explained in Sect. 5 that the admittance function can be solved analytically or numerically by applying a dummy mechanical load to the structure. Therefore, the hybrid scheme could provide significant benefits as it can be performed by any standard structural analysis software/formulation.
In addition, the maximum power generated from the harvester,Pmax(Watt), could be expressed as
Pmax¼
U2
R ð17Þ
3 NURBS and B-spline surface
In this section, the mathematical model of 2D NURBS function (NURBS surface) is described. NURBS stands for Non-Uniform Rational B-Spline, hence an introduction to B-spline surface is also presented. Following the notations used by Rogers (2001), the Cartesian or tensor product of B-spline surface is given by
Qðt;sÞ ¼X
nþ1
i¼1 X
mþ1
j¼1
Bi;jNi;kðtÞMj;lðsÞ ð18Þ
Basically, B-spline function is a set of polynomial functions in terms of the parametric valuestandswith
kandlorders.Q(t,s) is the position of any point on the B-spline surface as a function of bi-parametric coor-dinatetands. Meanwhile,Bi;jare the position vectors
of the nþ1 control points at t direction and mþ1 control points atsdirection.Ni;kðtÞandMj;lðsÞare the
normalized B-spline basis functions of order k at
tdirection and orderlatsdirection.
Physically, the B-spline surface functionQ(t,s) rep-resents the transformation of the real object/surface in the bi-parametric coordinate. The surface in Cartesian coordinate (x,y) is transformed into a surface that lies betweentandsaxes in the bi-parametric coordinate. Any points Q at the Cartesian coordinate is repre-sented with any values oftands.
The basis functions of the B-spline surface are defined by
Ni;1ðtÞ ¼
1 if xit\xiþ1
0 otherwise
ð19Þ
Ni;kðtÞ ¼
ðtxiÞNi;k1ðtÞ
xiþk1xi
þðxiþktÞNiþ1;k1ðtÞ
xiþkxiþ1
;
ð20Þ
and
Mj;1ðsÞ ¼
1 if yjs\yjþ1
0 otherwise
ð21Þ
Mj;lðsÞ ¼
ðsyjÞMj;l1ðsÞ
yjþl1yj
þðyjþlsÞMjþ1;l1ðsÞ
yjþlyjþ1
ð22Þ
wherexiandyjare the components of the knot vectors
basis functions equals to the number of control points (knþ1,lmþ1) and the basis functions degree is one less of the order. The convention of 00¼0 is adopted here.
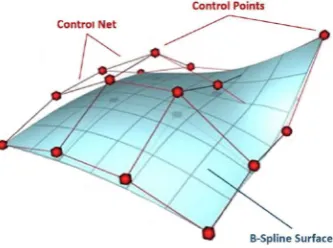
A control net is formed by the control points. This control net functioned as the frame in which the B-spline surface follows its shape. Practically, these control points are the ones that changed or controlled in a technical drawing process (usually using a CAD program) to construct the desired shape of objects. While the level of smoothness or fairness controlled with the number of control points or the order level.
An example of B-spline surface constructed with a CAD program, AutocadÓ, is shown in Fig.2. Readers are refered to Shumaker et al. (2015), for details in NURBS or B-spline CAD modeling. Moreover, the algorithm samples of CAD’s spline model integration with finite element software, i.e. ABAQUS, can be seen in (Hammami et al.2009; Lai et al.2017b).
The shape and character of B-spline surface are also significantly influenced by the type of knot vectors used to construct the basis functions. The knot vectors are categorized into periodic and open type with uniformly spaced or non-uniformly spaced knot values (Rogers 2001). Periodic knot vectors contain knot values that increased from the start to the end. While open knot vectors has multiplicity at the start and at the ends equal to the order-kof the basis functions.
Example of a periodic uniform knot vector, fork¼3,X¼ ½0;1
6; 1 3;
1 2;
2 3;
5 6;1.
Example of an open uniform knot vector, fork¼3,X¼ ½0;0;0;1
3; 2
3;1;1;1.
For the non-uniformly spaced knot vectors, the knot values may have unequal spacing and/or multiple internal knot values.
Example of an open non-uniform knot vector, X¼ 0;0;0;1
2; 1 2;1;1;1
:
Example of a periodic non-uniform knot vectors, X¼½0;0:28;0:5;0:72;1:
In the case of NURBS surface, the B-spline function in Eq. (18) is rationalized by a set of weighting values,
wi;j. Thus, the NURBS surface is written as
Rðt;sÞ ¼
Pnþ1
i¼1
Pmþ1
j¼1 wi;jBi;jNi;kðtÞMj;lðsÞ
Pnþ1
i¼1
Pmþ1
j¼1 wi;jNi;kðtÞMj;lðsÞ
ð23Þ
In most of the case, it is convenient to assumewi;j0
for alli,j. In the case of all weighting values are equal to 1, the NURBS surface reduced to the standard B-spline surface. The addition of weighting values gives more flexibility to the creation of the surface. Thus, more complicated shape, i.e., circle or conic section, is conveniently constructible.
4 Isogeometric formulation for laminated composite
The isogeometric formulation for laminated compos-ite based on First Shear Deformation Theory (FSDT) and Reissner–Mindlin Plate is presented in this section. In the isoparameteric finite element formula-tion, a particular point in an element is associated with the shape functions and the locations of all the nodes.
Rðx;yÞ ¼X
nn
A¼1
NAðt;sÞRAðxA;yAÞ ð24Þ
where R is a point in the element with coordinate (x,y). While,nnis the number of nodes in an element andNAðt;sÞis the shape function of a particular node,
RA, associated with the pointR.
In the NURBS-based isogeometric formulation, the surface or element, is also represented by the NURBS function. Hence, the shape functions,Nii, are
associ-ated with the basis functions and the control points of the NURBS surface (Thai et al.2012). Considering a NURBS surface with control net BA and weighting
valuewA, Eq. (23) is rewritten as
[image:6.547.72.239.524.648.2]Rðt;sÞ ¼ X
ðnþ1Þðmþ1Þ
A¼1
NAðt;sÞBA ð25Þ
where the shape function,
NAðt;sÞ ¼
NAðt;sÞwA
wðt;sÞ ð26Þ
and
NAðt;sÞ ¼Ni;kðtÞMj;lðsÞ ð27Þ
Hence, the displacement at a particular point on the element is written as
uðt;sÞ ¼ X
ðnþ1Þðmþ1Þ
A¼1
NAðt;sÞuA ð28Þ
where u¼ ½uxuyuzhxzhyzT is the displacement
associated with 3 translational and 2 rotational degree of freedoms.
Adopting the formulation of Reissner–Mindlin plate with FSDT assumption, the shape function derivatives for membrane, bending and shear compo-nent are written as (Ochoa and Reddy1992)
BmA ¼
NA;x 0 0 0 0
0 NA;y 0 0 0
NA;x NA;y 0 0 0
2 6 4
3 7
5 ð29Þ
BbA¼
0 0 0 NA;x 0
0 0 0 0 NA;y
0 0 0 NA;x NA;y
2 6 4
3 7
5 ð30Þ
BsA¼ 0 0
NA;x NA 0
0 0 NA;y 0 NA
ð31Þ
The stiffness matrix of the plate element, Ke, then obtained as
Ke¼
Z
Xe
ðBmÞTAcBmdXeþ
Z
Xe
ðBmÞTBcBbdXe
þ
Z
Xeð
BbÞTBcBmdXeþ
Z
Xeð
BbÞTDcBbdXe
þ
Z
Xeð
BsÞTHcBsdXe ð32Þ
whereXeis the domain of the element. TheAc,Bc,Dc
and Hc matrices are the elastic of the laminate
properties which represent the in-plane, bending-extension coupling, bending and inter-laminar shear
components. These matrices often called as one set, the A-B-D-H matrices, and are the function of the material constitutive matrix and the orientation of the lamina (Barbero2008). Furthermore, the mass matrix of the element,Me, is written as
Me¼
Z
Xeð
NAÞ
T
mNAdXe ð33Þ
with
m¼q
he 0 0 0 0
0 he 0 0 0
0 0 he 0 0
0 0 0 he3=12 0
0 0 0 0 he3=12
2 6 6 6 6 6 6 4
3 7 7 7 7 7 7 5
ð34Þ
where q and he are the material density and the
thickness of the element.
For the free vibration analysis, the eigenvalue problem is written as
Kx2nM
^
u¼0 ð35Þ
and for dynamic response problem, Kx2M
u¼f ð36Þ
where K, M, xn, u^ are the global stiffness matrix,
global mass matrix, the natural frequency and the eigenvector. While u is the displacement vector exerted by the force vectorf.
5 Computational algorithm
In this section, the algorithm of the hybrid mathemat-ical/numerical model is presented. The workflow of the computational process is shown in Fig.3.
Key procedures of the computational process are the evaluation of the deformation of the structure due to the actual mechanical load and the dummy load. The main outputs to be obtained from these procedures are as follows
1. The displacement slope (bending angle) function due to the actual mechanical loading,oZmech
ox . The
2. The admittance function of bending angle due to a unit of moment,Ham. The dummy load is given as
a unit of moment on the neutral axis of the beam/plate tip. In the case of piezoelectric layers only cover part of the plate, the unit moment is given on the tip of the piezoelectric layer. The simulation of the actual and dummy load is possible to be done employing an analytical or numerical method, or even experimental results. In Sects.6and7, FEM and IGA are also applied to obtain the structural response.
The next primary process after the evaluation of the mechanical deformation is the evaluation of the energy harvested. A computational code is built using MATLABÓ to evaluate the voltage and power response based on Eqs. (16) and (17). Key inputs of the computational code are as follows
1. The complex conjugate value of the bending angle due to the actual mechanical loading,oZmech
ox .
2. The admittance function,Ham, obtained from the
dummy load simulation.
3. Material properties and geometrical information of the structure.
4. Range of the resistance load, R, used on the electrical circuit.
To be noted that Eq. (16) is derived based on a uniform cross-section beam/plate. Therefore, in the case of non-uniform cross section, i.e. tapered beam, an approximation, i.e. polynomial function, is required to accommodate the change of the geometrical parameters along the span (huðxÞ,hlðxÞ,b(x)).
In addition, it is worth to be highlighted, one of the main benefits of the hybrid scheme is the simplicity of its three primary processes. The two steps to simulate actual and dummy load simulation can be performed with standard structural analysis formulation/soft-ware, and the last step to calculate the voltage and power amplitude can be solved straightforwardly via Eqs. (16) and (17). Further elaborated in Sect.6.2, the hybrid scheme could attain the same level of accuracy with faster computing time against fully coupled electromechanical FEM.
Computational model & simulation (e.g. FEM, IGA)
Actual mechanical load (Force, Moment, etc.)
Dummy mechanical load
(1 unit of Moment at beam’s neutral axis tip)
Complex conjugate
bending angle,
Admittance function (complex conjugate bending angle per 1 unit
of moment),
Material properties and geometry,
Γ1and Γ2 Set of Resistance load,
Governing piezoelectric energy harvester voltage
equation
Voltage and Power for the set of
[image:8.547.57.490.58.325.2]6 Validation
In this section, validation for the hybrid mathematical/ numerical model is presented. The bimorph energy harvester model of Erturk and Inman (2011) under base excitation is used as analytical solution bench-mark. The piezoelectric Kirchhoff plate of De Marqui Jr. et al. (2009) is used as benchmark for validation against electromechanically coupled finite element. 6.1 Validation against analytical solution
The material properties and geometry of the bimorph used for the analytical validation are shown in Table1. The bimorph energy harvester comprised of two piezoelectric layers, each located on the bottom and top surface of the beam. The host structure is isotropic material placed between the piezoelectric layers.
The piezoelectric layers of bimorph energy har-vester can be connected in series or parallel to the external resistance load. In the present work, series configuration of the bimorph is investigated. Three different methods, i.e., analytical, FEM and IGA are implemented to perform the structural dynamic anal-ysis. Eight-noded bi-quadratic (Q8) FEM shell ele-ment, Nine-noded quadratic (Q9) and 25-noded bi-quartic (Q25) IGA shell elements. Full integration points, 33 for bi-quadratic and 55 for bi-quartic, are used. Computational codes are developed in MATLABÓ to perform FEM and IGA structural dynamic analysis.
Table 2 shows the comparison of the natural frequencies for the FEM and IGA are in good agreement with Erturk and Inman (2011).
The mode shapes obtained via IGA Q25 elements are depicted in Fig. 4a, b. In both FEM and IGA simulations, 212 elements are used, as it is already
sufficient to attain accuracy close to the analytical solution. The frame of the undeformed plate is denoted by the black lines forming a rectangular shape. The eigenvectors are shown in the normalized values to its maximum values. It can be seen that Fig.4a shows the first Bending mode, as the deflection is increased along the span with the maximum value at the tip. The second Bending mode is shown in Fig. 4b, the deflection changes direction, downward (z-) from root to around mid span and upward (z?) from around mid span to tip.
In the present work, the resonance frequency is applied to the excitation frequency for both FEM and IGA dynamic response analysis. The comparison of the relative tip displacements and bending angles due to 1lm base excitation amplitude at the first bending frequency is shown in Table3.
Figure 5a, b depict the distribution of the vertical displacement (at z-direction) and the bending angle amplitudes along the span. The amplitudes shown are obtained via IGA Q25 elements. It is shown that the both the distribution of the vertical displacement and angle are similar with the first Bending mode. The values are increasing along the span with the maxi-mum at the tip. To be noted that the shapes of displacement are shown in model scale, not in the true scale, for clearer visualization. The reader is referred to the color-bar for the true scale magnitude of the displacement and angle.
[image:9.547.168.500.537.663.2]A separate code is also built via MATLABÓ to reconstruct Erturk-Inman’s model to obtain a quanti-tative comparison of the energy harvested over a range of resistance load. Figure 6a, b show the generated voltage and maximum power amplitude for a set of resistance load obtained via Erturk–Inman’s model and the present hybrid scheme.
Table 1 Material properties and geometry of the bimorph piezoelectric energy harvester (Erturk and Inman2011)
Properties Piezo ceramics Host structure
LengthL(mm) 30 30
Widthb(mm) 5 5
Thicknessh(mm) 0.15 (each) 0.05
Material PZT-5A Aluminium
Densityq(kg/m3) 7750 2700
Elastic modulus 1=S11(GPa) 61 70
Piezoelectric constantd31(pm/V) -171 –
In Fig.6a, b, denoted by ‘‘Present Model’’ are the present work results obtained via the hybrid mathe-matical/computational scheme. Denoted inside the brackets, ‘‘(FEM)’’, ‘‘(IGA)’’ and ‘‘(Analytical)’’, are the results of 3 different structural dynamic analysis coupled with the governing voltage function of
Eq. (16). The FEM model used is of the FEM Q8 elements and the IGA model used is of the IGA Q25 elements.
[image:10.547.43.497.58.445.2]The figures are in the logarithmic to logarithmic scale, where both the voltage and power amplitudes are normalized per unit of g (9:81 m/s2) and g2. The Table 2 Natural frequency
comparison, configuration from Table1
Mode shape Natural frequency (Hz)
Erturk–Inman FEM Q8 IGA Q9 IGA Q25
First bending 185.1 187.3 187.2 187.3
Second bending 1159.8 1172.5 1172.0 1172.5
0 5
10 15
20 25
30
−5 0 5 10 −1 0 1
Spanwise Location (mm)
1st Mode Shape − Z Eigenvector
Chord Location (mm)
0 0.1 0.2 0.3 0.4 0.5 0.6 0.7 0.8 0.9 1
(a)
0 5
10 15
20 25
30
−5 0 5 10 −1 0 1
Spanwise Location (mm)
2nd Mode Shape − Z Eigenvector
Chord Location (mm)
−0.6 −0.4 −0.2 0 0.2 0.4 0.6 0.8 1
(b)
[image:10.547.272.500.79.440.2]Fig. 4 aThe first bending andbthe second bending modes of the bimorph
Table 3 Relative tip displacements and bending angles comparison, configuration from Table1
Parameter Relative tip displacement (lm) and bending angle (rad)
Erturk–Inman FEM Q8 IGA Q9 IGA Q25
Displacement 78 78.3 78.3 78.3
Angle 3.59e-3 3.61e-3 3.63e-3 3.62e-3
0 5
10 15
20 25
30
−5 0 5 10 −1 0 1
Spanwise Location (mm)
Dynamic Response Amplitude − Z Displacement (mm)
Chord Location (mm)
0 0.01 0.02 0.03 0.04 0.05 0.06 0.07
(a)
0 5
10 15
20 25
30
−5 0 5 10 −1 0 1
Spanwise Location (mm)
Dynamic Response Amplitude − XZ Plane Angle (rad)
Chord Location (mm)
0.5 1 1.5 2 2.5 3 3.5 x 10⁻³
[image:10.547.48.262.133.439.2](b)
[image:10.547.49.499.502.568.2]amplitude value ‘‘per g’’ means it is divided by the ratio of base acceleration to g, i.e. base amplitude 1lm and 185 Hz excitation equal with 1:35 m/s2 base
acceleration or 0.14 acceleration ratio. Hence, 100 V at this acceleration is equal with 714.3 ‘‘V per g’’. In addition, the electrical power is normalized per unit g2, or the power amplitude divided by the square of the
acceleration ratio.
It is seen in Fig.6a until Fig.6b that the voltage and power amplitude from all four procedures are in good comparison and even difficult to distinguish. In the zoomed view of the plots, the ‘‘Present Model (FEM)’’ and ‘‘Present Model (IGA)’’ results are seen just slightly overestimate the results of Erturk–Inman’s
model. Meanwhile, the ‘‘Present Model (Analytical)’’ results even in the zoomed scale are still coincide with the results of Erturk–Inman’s model. In detail, the comparison for the maximum voltage and power amplitude are given in Table4. It can be seen that the variances are not significant (less than 2%).
6.2 Validation against electromechanically coupled FEM
In this subsection, the investigation of energy har-vested on UAV wing spar of De Marqui Jr. et al. (2009). The spar is a bimorph plate with the material properties and geometry as shown in Table 5. The piezoelectric layer is connected as series configura-tion, and the load source is the base excitation motion. In Table5, the piezoelectric properties are shown in 3D orthotropic of the stress-charge form (Standards Committee of the IEEE Ultrasonics, Ferroelectrics, and Frequency Control Society 1988). The
cE
11;cE12;. . .;cE66are the components of elastic stiffness
of the mechanical constitutive relations. The
e31;e32;e33are the components of piezoelectric charge
constant.
De Marqui Jr. et al. (2009) adopted Kirchhoff plate theory to develop the electromechanically coupled finite element model of the piezoelectric energy harvester. The piezoceramic layer is assumed poled in the thickness direction thus align with the assump-tion used at2. The piezoceramic layer is also assumed covered by a continuous electrode and perfectly bonded to the host-structure. It is assumed very thin and conductive electrode layers are on the top and bottom surfaces of the piezoceramic layers. Hence, it is assumed that all finite elements generate the same voltage output. Furthermore, one degree of freedom is used as the voltage output degree of freedom of each element. The interested reader is referred to De Marqui Jr. et al. (2009) for the detail of the formulation.
Rayleigh mechanical damping is used in the finite element formulation. The damping is assumed pro-portional to the mass and stiffness matrices with the constant of proportionality aandb. Thus the critical damping ratiofis written as
f¼ a
2xn
þxnb
2 ð37Þ
103
104
105
106
107 10−1
100 101
Resistance (Ω)
Voltage (V per g)
Voltage Amplitude vs Resistance
Erturk−Inman Model Present Model (FEM) Present Model (IGA) Present Model (Analytical)
8 8.5 9 9.5 10 x 105 5.4
5.45 5.5 5.55
(a)
103 104 105 106 107 100
101 102 103
Resistance (Ω)
Power (
μ
W per g
2)
Power Amplitude vs Resistance
Erturk−Inman Model Present Model (FEM) Present Model (IGA) Present Model (Analytical)
2.5 3 3.5 4 4.5 5 x 10⁴ 215
220 225 230 235
(b)
[image:11.547.50.261.58.435.2]wherexnis the natural frequency of the structure. In
the case presented in this subsection,a¼21:28 rad/s andb¼105s/rad are used.
The configuration of the spar is limited to 10%
additional mass of the full aluminum spar mass. Therefore, a restriction of length and thickness of the piezoelectric layer, Lh0:02723, is applied. L is the ratio of piezoelectric length to the total length of the beam and h is the thickness ratio of one piezoelectric layer to the total thickness of the beam. The relationship of Lh boundary is shown in Fig.7.
As the length and thickness of the piezoelectric layers and the aluminum layer are varied and not uniform along the span, thus, the analytical solution of Erturk and Inman (2008) is not applicable. Thus, in this subsection, the comparison is only applied to the
hybrid model with FEM and IGA combinations. The FEM Q8 and IGA Q25 elements are used in the present case. Figure8shows the variation of the first Bending natural frequency and the critical damping ratio for various length ratio, L.
It is seen from Fig. 8 the trends of the natural frequency and damping ratio for all three procedures are all in good comparison. The total mass of the beam is fixed at 1.1 full aluminum mass, and the cross section shape is maintained. It is, therefore, the only variation that affecting the change of the natural frequency is the composite material properties along the span.
In general, the natural frequency is decreasing from L¼0:1 to 1. However, from L= 0.25 to 0.4 a slight increment occurs, despite it is followed by a signif-icant drop from L= 0.8 to 1. This trend is caused by a reduced stiffness of the piezo-aluminum composite beam as the piezoceramics layers approaches L ¼1. In addition, for a benchmark, analytically the natural frequency of a full aluminum spar is 108.79 Hz.
[image:12.547.279.499.86.328.2]The maximum power and the resistance load at the maximum power for various length ratio are depicted Table 4 Electrical
parameters comparison, configuration from Table1
Parameter Electrical parameters comparison
Erturk–Inman Present (analyt.) Present (FEM) Present (IGA)
Max voltage (V) 0.78 0.78 0.79 0.79
Max power (lW) 4.35 4.35 4.43 4.43
[image:12.547.47.265.180.408.2]R at max power (kX) 35.9 35.9 36.11 36.09
Table 5 Material properties and geometry of the bimorph UAV Wingspar (De Marqui Jr. et al.2009)
Dimension of the beam
Total lengthL(mm) 300
Total widthb(mm) 30
Total thicknessh(mm) 12
Piezoceramics (PZT-5A)
q(kg/m3) 7800
cE
11,cE22(GPa) 120.3
cE
12(GPa) 75.2
cE
13,cE23(GPa) 75.1
cE
33(GPa) 110.9
cE
66(GPa) 22.7
e31,e32(C/m2) -5.2
e33(C/m2) 15.9
e33(nF/m) 15.93
Host-structure (aluminum)
q(kg/m3) 2750
E(GPa) 70
0.1 0.2 0.3 0.4 0.5 0.6 0.7 0.8 0.9 1 0
0.05 0.1 0.15 0.2 0.25 0.3 0.35
L* (Length Ratio)
h* (Thickness Ratio)
Length Ratio vs Thickness Ratio
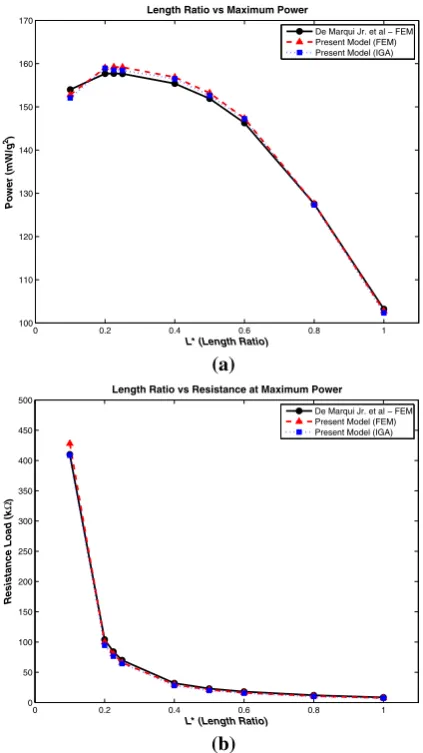
in Fig.9a, b. All of the three procedures are also in good agreement. The maximum power increased at first and reached its highest point at L¼0:225 before it significantly drops when Lapproach 1. In contrast, the resistance load at the maximum power is decreased with the increment of L.
De Marqui Jr. et al. (2009) concluded that for very thin piezoceramics, at L[0:5, the effect of increased dynamic flexibility (decreased natural frequency, Fig. 8a) is not able to overcome the increased structural damping as shown in Fig. 8b. Therefore, although the flexibility is increased, the amplitude of the vibration is reduced. It resulted in the decrease of the power harvested as shown in Fig.9a. This behavior is aligned with Eq. (16) in which the energy output is
influenced by the displacement variation along the structural element.
Figure 10 depicted the variation of the power amplitude with the resistance load for different length ratio. The black cross ‘‘’’ denoted L¼1 and the
blue plus ‘‘?’’ denoted L¼0:1. It can be seen that the Power–Resistance curve is shifting from left to right as the L decreased. In align with Eq. (12), thinner and longer piezoelectric layer means C1
parameter is increased. Thus, the voltage function reached the asymptotic behavior at smaller resistance load.
In detail, the comparison of the natural frequency and maximum power obtained from the present hybrid 0 0.2 0.4 0.6 0.8 1
100 101 102 103 104 105 106 107 108 109 110
L* (Length Ratio)
Frequency (Hz)
Length Ratio vs Short−circuit Resonance Frequency
De Marqui Jr. et al − FEM Present Model (FEM) Present Model (IGA)
(a)
0 0.2 0.4 0.6 0.8 1 0.0185
0.019 0.0195 0.02 0.0205
L* (Length Ratio)
ζ
(Damping Ratio)
Length Ratio vs Critical Damping Ratio
De Marqui Jr. et al − FEM Present Model (FEM) Present Model (IGA)
(b)
Fig. 8 Variation of theanatural frequency,bcritical damping ratio with the length ratio of the Spar
0 0.2 0.4 0.6 0.8 1 100
110 120 130 140 150 160 170
L* (Length Ratio)
Power (mW/g
2)
Length Ratio vs Maximum Power
De Marqui Jr. et al − FEM Present Model (FEM) Present Model (IGA)
(a)
0 0.2 0.4 0.6 0.8 1 0
50 100 150 200 250 300 350 400 450 500
L* (Length Ratio)
Resistance Load (k
Ω
)
Length Ratio vs Resistance at Maximum Power
De Marqui Jr. et al − FEM Present Model (FEM) Present Model (IGA)
(b)
Fig. 9 Variation of the a maximum power amplitude and
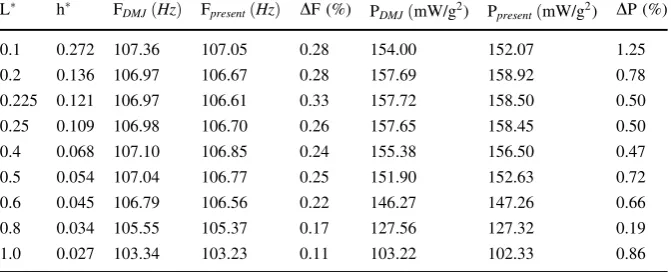
[image:13.547.50.262.52.426.2] [image:13.547.287.499.57.434.2]model and the results of De Marqui Jr. et al. (2009) is presented in Tables6and7. The first bending natural frequency is denoted by ‘‘F’’ and the maximum power is denoted by ‘‘P’’. The subscripts ‘‘DMJ’’ and
‘‘Present’’ represent the results of De Marqui Jr. et al. (2009) and the ones obtained by means of the present hybrid scheme. The D shows the variance of both procedures.
The comparison of The present hybrid scheme with FEM Q8 combination is provided in Table 6. It is shown that the natural frequencies and maximum power amplitude are all in good agreement with variances less than 1%. Moreover, the results of IGA Q25 couple is shown in Table7with also insignificant variations compared to De Marqui Jr. et al results. These results demonstrate the robustness of the present hybrid scheme, the capability to estimate energy harvested from a structure with non-uniform material properties and obtained a good level of accuracy similar to the electromechanically coupled finite element model.
A general illustration of the simulation time comparison between the hybrid scheme and fully coupled FEM is shown in Table8. The simulation time of the UAV spar case with the full-length piezoelectric layer is observed. The hybrid scheme simulation 102 103 104 105 106 107 108
101 102 103 104 105 106
Resistance (Ω)
Power (
μ
W per g
2)
Power Amplitude vs Resistance
L*=0.1 L*=0.2 L*=0.4 L*=0.6 L*=0.8 L*=1.0
[image:14.547.51.260.58.231.2]L* decrease
[image:14.547.167.502.360.499.2]Fig. 10 Variation of the power amplitude with the resistance load for various length ratio of the Spar obtained via the present hybrid scheme with IGA combination
Table 6 Natural frequency and maximum power comparison of De Marqui Jr. et al.—FEM and present model (FEM)
L h FDMJ(Hz) FpresentðHzÞ DF (%) PDMJðmW/g2) PpresentðmW/g2) DP (%)
0.1 0.272 107.36 106.78 0.54 154.00 152.79 0.79
0.2 0.136 106.97 106.39 0.54 157.69 159.06 0.87
0.225 0.121 106.97 106.40 0.53 157.72 159.24 0.97
0.25 0.109 106.98 106.42 0.52 157.65 159.18 0.97
0.4 0.068 107.10 106.59 0.48 155.38 156.88 0.96
0.5 0.054 107.04 106.56 0.45 151.90 153.22 0.86
0.6 0.045 106.79 106.33 0.43 146.27 147.33 0.74
0.8 0.034 105.55 105.12 0.41 127.56 127.59 0.02
[image:14.547.166.502.526.662.2]1.0 0.027 103.34 102.95 0.38 103.22 102.79 0.41
Table 7 Natural frequency and maximum power comparison of De Marqui Jr. et al.—FEM and present model (IGA)
L h FDMJðHzÞ FpresentðHzÞ DF (%) PDMJðmW/g2) PpresentðmW/g2) DP (%)
0.1 0.272 107.36 107.05 0.28 154.00 152.07 1.25
0.2 0.136 106.97 106.67 0.28 157.69 158.92 0.78
0.225 0.121 106.97 106.61 0.33 157.72 158.50 0.50
0.25 0.109 106.98 106.70 0.26 157.65 158.45 0.50
0.4 0.068 107.10 106.85 0.24 155.38 156.50 0.47
0.5 0.054 107.04 106.77 0.25 151.90 152.63 0.72
0.6 0.045 106.79 106.56 0.22 146.27 147.26 0.66
0.8 0.034 105.55 105.37 0.17 127.56 127.32 0.19
utilizes the bi-quartic (Q25) IGA elements, and the fully coupled FEM utilizes eight-noded bi-quadratic (Q8) elements. The fully coupled FEM follows De Marqui Jr. et al. (2009) formulation, in which one additional voltage degree of freedom is added to each element. The configuration of 212 elements are used. For both IGA Q25 elements and fully coupled FEM Q8 elements, computational codes are built and run via MATLABÓ. The simulations are performed by a standard office laptop with Intel Core i7 2.4 GHz and 4 GB RAM.
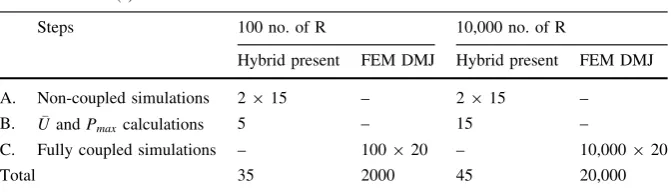
In Table 8, ‘‘Hybrid-Present’’ denotes the present hybrid scheme coupled with IGA, while the full electromechanically coupled FEM of De Marqui Jr. et al. (2009) is denoted with ‘‘FEM–DMJ’’. As explained in Sect. 5 and Fig. 3, the present hybrid scheme only requires three primary processes con-sisted of two numerical simulations for actual and dummy load, and one process to calculate voltage-power harvested. Step A denotes the non-coupled/ purely mechanical loads numerical simulations per-formed via IGA Q25 configuration. Calculation of voltage (U) and power (Pmax) for N-number of
resistance loads,R, is denoted by step B. Process of calculation in step B is also performed via a MATLABÓ computational code.
For ‘‘FEM–DMJ’’ simulation, the only step used is step C, the full electromechanically coupled finite element simulation. In step C, the resistance load and the mechanical load are both given as the excitation source on the finite elements, while both the structural deformation and voltage responses are obtained directly as the output of FEM simulation. It is assumed that for a set of N-numbers of R, N-times of simulations is required.
As shown in Table8, step A shows fixed simulation time, 215 s. The elapsed time for the actual load (base excitation) and the dummy load (the moment at
the tip) are around 15 s each and independent to the number of R. In step B, shows an increment of computing time as the number of resistance loads is increasing. For a set of 100 variances of R, the elapsed time is less than 5 s. While for 10,000 numbers of R, around 15 s computing time is required. Therefore, in total, ‘‘Hybrid–Present’’ simulations require 35 s for 100 variances of R, and 45 s for 10,000 numbers of R. In contrast, the simulation time required for ‘‘FEM– DMJ’’, step C, is purely dependent on the number of R observed. For a simulation with one resistance load, it only requires less than 20 s. However, the simulation times are multiplied with N-number of R investigated. Therefore, if 100 number of R used, then 2000 s is required. Furthermore, if 10,000 number of R used, then 200,000 s or around 56 h is required. Interesting to note that to produce a plot with the level of detail such as shown in Fig.10, a set of R from 102to 108X
with 100 X step is used. Thus, to produce this plot utilizing the present hybrid scheme only need less than 1 min, while with full electromechanically coupled FEM will require around 56 h.
[image:15.547.166.502.70.166.2]The independence on the number of simulations on the hybrid scheme is beneficial especially in a preliminary/conceptual design stage, in which a faster iterative design process to obtain an optimal harvester structural design and resistance load is achievable. However, despite the higher computational cost, a full electromechanically coupled FEM may provide more details for a particular area of interests, i.e., the region near optimum resistance load. Thus, the hybrid scheme may build the fundamental sense of the best harvester design at the early design stage, while more detailed analysis may be provided by fully coupled FEM at the later design phase. Further in Sect.7, the robustness of the present hybrid scheme with IGA combination is elaborated with very thin structural configurations.
Table 8 Simulation time
comparison Simulation time (s)
Steps 100 no. of R 10,000 no. of R
Hybrid present FEM DMJ Hybrid present FEM DMJ
A. Non-coupled simulations 2915 – 2915 –
B. UandPmaxcalculations 5 – 15 –
C. Fully coupled simulations – 100920 – 10,000920
7 Case study of plates with various thickness
As mentioned in Sect. 1, Thai et al. (2012) imple-mented NURBS-based IGA to investigate the shear locking phenomena on the dynamic response prob-lems of the laminated composite plate. In this section, a new investigation on the effect of shear locking phenomena and the resistance of high-order IGA elements to the voltage and power responses of piezoelectric energy harvester is presented.
The present hybrid scheme with the combination of FEM and IGA are utilized to investigate plates with various thickness. The beam with the configuration on Table 1 is modified. The thickness of the beam is varied with h is the investigated thickness and h0is the
original thickness on Table 1. Thus, a ratio of thickness, h0/h is defined as the non-dimensional
parameter.
Similar procedure as presented in Sect. 6.1 is implemented. FEM Q8, IGA Q9, and IGA Q25 elements are deployed. The same number of elements, 212 equal sized elements, is used. The thickness ratio of the beam is varied from h0=h¼1 to
h0=h¼104. As the thickness ratio, h0=h increases,
the investigated thickness becomes smaller. At h0=h¼104, the length per thickness ratio of the
element is more than 7000 and considered as a very thin element.
The numerical investigation results show that IGA Q9, Q25, and FEM Q8 elements are all maintained a good level accuracy at small thickness ratio. In contrast, at the larger thickness ratio, shear locking effect started influenced the FEM Q8 elements. Figures 11 and 12 show the structural dynamic response obtained via IGA Q25 and Q9 at thickness
ratio, h0=h¼103:75or h0=h¼5600 still at maintained
the same level of accuracy with h0=h¼1 (see Fig.5a).
The displacement obtained via FEM Q8 is depicted in Fig.13. It can be seen the result of FEM Q8 started deviated, the level of displacement dropped lower than the IGA Q9 and Q25 results.
The variation of the tip displacement and tip angle with the thickness ratio are displayed in Fig.14. The black line, red diamond, blue circle and green square are denoted the analytical results, FEM Q8, IGA Q9 and IGA Q25 results. The results of FEM Q8 started deviating from the analytical results at h0=h¼103:5or
h0=h¼3200 and dropped significantly at thickness
ratio 104. While the IGA 9 and IGA 25 results just
slightly deviated at thickness ratio 104.
The results are shown in Fig.14are aligned with the trend shown by Thai et al. (2012). For finite element results, the structural displacement is distorted further from the analytical results as the shear energy dominated within the element. At a particular thick-ness when the element becomes extremely thin, the plate/shell element behaves more like a plane stress element. Hence, the element is unable to be loaded by out-of-plane loading, i.e. bending load, and resulted in an unreliable response.
In Fig.15the effect of shear locking as the element becomes thinner to the reverse piezoelectric parameter is shown. In general, similar trend with Fig. 14 is obtained. For finite element result, the magnitude of the reverse piezoelectric parameter, jixC2
2Hamj, is
dropped significantly towards h0/h = 104. Figures16
and17show the voltage-resistance and power-resis-tance curves shifted from the reference value at very thin plate.
For the finite element results, at the very thin plates, the voltage response is underestimated at the range of resistance load close to short circuit (R!0). The geometrical configuration and material properties,
C1&C2, unaffected by the numerical results.
How-ever, for the finite element results at very thin plates, the reverse piezoelectric effect is decreased, thus, at the range near short circuit, the reverse piezoelectric parameter unable to overcome the 1/R parameter. Moreover, with also smaller mechanical deformation, hence the voltage response is underestimated.
On the other side, as the resistance value is close to the open circuit (R! 1), the 1/R parameter is decreased. Furthermore, As for FEM result, the
0 5
10 15
20 25
30
−5 0 5 10 −1 0 1
Spanwise Location (mm)
Dynamic Response Amplitude − Z Displacement (mm)
Chord Location (mm)
[image:16.547.51.260.513.636.2]0.01 0.02 0.03 0.04 0.05 0.06 0.07
Fig. 11 Vertical displacement amplitude of the bimorph with
reverse piezoelectric also dropped at the very thin plate, it led to the overestimated voltage response.
Figures16a and17a show the voltage response is shifted further from the analytical value as the thickness ratio changed from 103:75 to 104. The
maximum voltage is greater overestimated at thick-ness ratio 104. As the voltage responses are shifted, the power response are also shifted as shown in Figs.16b and 17b. Despite the fact that the power-resistance curves of the finite element results similar to the trend of the analytical, the resistance values are overestimated.
In detail, Table 9 presented the comparison of maximum voltage and maximum power amplitude with the resistance at maximum power for all proce-dures at h0=h¼104. It can be seen that all of the
methods are in good agreement except the one combined with FEM. Although the maximum power obtained with FEM combination is less than 5% variance (D), however the resistance value at the maximum power is overestimated by 2.5 times the analytical result.
0 5
10 15
20 25
30
−5 0 5 10 −1 0 1
Spanwise Location (mm)
Dynamic Response Amplitude − Z Displacement (mm)
Chord Location (mm)
[image:17.547.49.266.59.339.2]0.01 0.02 0.03 0.04 0.05 0.06 0.07 Fig. 12 Vertical
displacement amplitude of the bimorph with h0=h¼ 103:75via 9-noded (quadratic) IGA elements
0 5
10 15
20 25
30
−5 0 5 10 −1 0 1
Spanwise Location (mm)
Dynamic Response Amplitude − Z Displacement (mm)
Chord Location (mm)
0 0.005 0.01 0.015 0.02 0.025 0.03 0.035 0.04 0.045 0.05
Fig. 13 Vertical displacement amplitude of the bimorph with h0=h¼103:75via 8-noded (quadratic) FEM elements
102 103 104
300 350 400 450 500 550 600
Thickness Ratio (h0/h)
Tip Displacement (
μ
m per g)
Tip Displacement vs Thickness Ratio
Analytical FEM Q8 IGA Q9 IGA Q25
(a)
102 103 104
12 14 16 18 20 22 24 26 28
Thickness Ratio (h
0/h)
Tip Angle (10
3 rad per g)
Tip Angle vs Thickness Ratio
Analytical FEM Q8 IGA Q9 IGA Q25
(b)
[image:17.547.279.499.60.583.2]8 Conclusions
The hybrid mathematical model/Isogeometric Analy-sis (IGA) scheme to evaluate a cantilevered piezo-electric energy harvester under dynamic bending has been developed. The hybrid scheme has shown beneficial advantages, i.e., the simplicity of the primary processes on the use of standard structural analysis and straightforward governing voltage equa-tion. It is shown in this paper; the hybrid scheme re-duced computational cost compared to the more sophisticated electromechanically coupled finite ele-ments. The capabilities and robustness of the
procedure are demonstrated by comparison with results from the literature.
The numerical investigations focused on the shear locking resistance of the higher-order IGA elements have been performed. It is shown in this paper; the higher-order IGA elements are less prone to the shear locking phenomena. Employing higher-order IGA, the structural deformations and the energy responses are maintained at a reasonable level of accuracy even at a very thin structure. It is considered advantageous for the analysis of piezoelectric materials, in which usually manufactured as thin-walled structures.
However, as it is discussed earlier in the Introduc-tion secIntroduc-tion, one of the gaps in the piezoelectric energy harvesting study is the lack of models for more general loading conditions and complex structure. Despite the ability of the hybrid formulation to provide analysis on various form of loads, i.e., force, pressure, base excitation, it is still limited to the dynamic bending cases. In order to obtain more general formulation, mixed mechanical loads, i.e., bending and torsion, need to be considered in the further development. Further elaboration on more complicated structural configuration, i.e., a tapered section, twisted section, may as well required. In this case, the ability of NURBS-based IGA on the integration with CAD software and complex shapes construction are worth to be explored in the future works.
Concerning higher-order NURBS-based IGA, it is found from the literature that it may have a negative 102
103
104 1.2
1.4 1.6 1.8 2 2.2 2.4 2.6 2.8
Thickness Ratio (h0/h)
| i
ωΓ
2
2H
α
m
| (10
5 rad 2Nm/V 2s)
Parameter of Reverse Piezoelectric Effect vs Thickness Ratio
[image:18.547.50.261.54.230.2]Analytical FEM Q8 IGA Q9 IGA Q25
Fig. 15 Variation of reverse piezoelectric parameter for various thickness ratio,h0=h
103
104
105
106
107 10−1
100 101
Resistance (Ω)
Voltage (V per g)
Voltage Amplitude vs Resistance
Erturk−Inman Model Present Model (FEM) Present Model (IGA) Present Model (Analytical)
8 8.5 9 9.5 10 x 105 5.4
5.45 5.5 5.55
(a)
103
104
105
106
107 100
101 102 103
Resistance (Ω)
Power (
μ
W per g
2)
Power Amplitude vs Resistance
Erturk−Inman Model Present Model (FEM) Present Model (IGA) Present Model (Analytical)
2.5 3 3.5 4 4.5 5 x 10⁴ 215
220 225 230 235
(b)
[image:18.547.60.486.465.648.2]effect on the computational cost. For a fixed number of unknown, higher-order NURBS-based IGA may con-sume more CPU time and RAM (Collier et al.2012). Therefore, it is considered worth to be investigated in the future work the effect of the higher-order NURBS-based IGA to the overall computational cost of the present hybrid scheme. Despite in this paper, it is shown that there is no significant issue with the computing time, investigation on the more complex structure and more dense mesh may need to be performed in the future.
It is also found that the use of the mass matrices in higher-order IGA for structural vibration analysis is still not optimal (Cottrell et al. 2006). The lumped mass matrices limit the accuracy to just second order, even for higher-order of IGA elements. However, some attempts to develop novel high-order mass matrices are found in the literature (Wang et al. 2013,2015). Those new mass matrices are proven to increase the level of accuracy. Thus, it may be used to enhance the performance of the present IGA elements.
Acknowledgements The authors gratefully acknowledge Dr. Anton Krynkin for the fruitful discussions and the support of Indonesia Endowment Fund for Education (LPDP).
Open Access This article is distributed under the terms of the Creative Commons Attribution 4.0 International License (http:// creativecommons.org/licenses/by/4.0/), which permits unrestricted use, distribution, and reproduction in any medium, provided you give appropriate credit to the original author(s) and the source, provide a link to the Creative Commons license, and indicate if changes were made.
References
Abdelkefi, A.: Aeroelastic energy harvesting: a review. Int. J. Eng. Sci.100, 112–135 (2016)
Akbar, M., Curiel-Sosa, J.: Piezoelectric energy harvester composite under dynamic bending with implementation to aircraft wingbox structure. Compos. Struct.153, 193–203 (2016)
Allik, H., Hughes, T.J.R.: Finite element method for piezo-electric vibration. Int. J. Num. Methods Eng.2(2), 151–157 (1970)
103
104
105
106
107 10−1
100 101
Resistance (Ω)
Voltage (V per g)
Voltage Amplitude vs Resistance
Erturk−Inman Model Present Model (FEM) Present Model (IGA) Present Model (Analytical)
8 8.5 9 9.5 10 x 105 5.4
5.45 5.5 5.55
(a)
103
104
105
106
107 100
101 102 103
Resistance (Ω)
Power (
μ
W per g
2)
Power Amplitude vs Resistance
Erturk−Inman Model Present Model (FEM) Present Model (IGA) Present Model (Analytical)
2.5 3 3.5 4 4.5 5 x 10⁴ 215
220 225 230 235
[image:19.547.65.487.54.241.2](b)
Fig. 17 Plot voltage and power amplitude versus resistance load of the bimorph withh0=h¼104
Table 9 Electrical parameters comparison with h0/h = 104
Parameter Electrical parameters comparison
Erturk Inman Present (analyt.) Present (FEM) Present (IGA)
Max voltage (nV) 7.8 7.8D¼0:0% 14.5D¼85:9% 7.64D¼2:0%
Max power (pW) 4.35e-10 4.35e-10D¼0:0% 4.55e-10D¼4:6% 4.17e-10D¼4:1%
[image:19.547.45.500.291.368.2]Ballas, R.G.: Piezoelectric Multilayer Beam Bending Actuators: Static and Dynamic Behavior and Aspects of Sensor Inte-gration. Microtechnology and MEMS. Springer, Berlin (2007)
Barbero, E.J.: Finite Element Analysis of Composite Materials. CRC Press, Boca Raton (2008)
Bazilevs, Y., Calo, V.M., Hughes, T.J.R., Zhang, Y.: Isogeo-metric fluid-structure interaction: theory, algorithms, and computations. Comput. Mech.43(1), 3–37 (2008) Benjeddou, A.: Advances in piezoelectric finite element
mod-eling of adaptive structural elements: a survey. Comput. Struct.76(1), 347–363 (2000)
Bruni, C., Gibert, J., Frulla, G., Cestino, E., Marzocca, P.: Energy harvesting from aeroelastic vibrations induced by discrete gust loads. J. Intell. Mater. Syst. Struct. 28(1), 47–62 (2017)
Bui, T.Q.: Extended isogeometric dynamic and static fracture analysis for cracks in piezoelectric materials using
NURBS. Comput. Methods Appl. Mech. Eng. 295,
470–509 (2015)
Bui, T.Q., Nguyen, M.N., Zhang, C., Pham, D.A.K.: An efficient meshfree method for analysis of two-dimensional piezo-electric structures. Smart Mater. Struct. 20(6), 065,016 (2011)
Bui, T.Q., Hirose, S., Zhang, C., Rabczuk, T., Wu, C.T., Saitoh, T., Lei, J.: Extended isogeometric analysis for dynamic fracture in multiphase piezoelectric/piezomagnetic com-posites. Mech. Mater.97, 135–163 (2016a)
Bui, T.Q., Nguyen, D.D., Zhang, X., Hirose, S., Batra, R.C.: Analysis of 2-dimensional transient problems for linear elastic and piezoelectric structures using the consecutive-interpolation quadrilateral element (CQ4). Eur. J. Mech. A Solid58, 112–130 (2016b)
Collier, N., Pardo, D., Dalcin, L., Paszynski, M., Calo, V.: The cost of continuity: a study of the performance of isogeo-metric finite elements using direct solvers. Comput. Methods Appl. Mech. Eng.213–216, 353–361 (2012) Cottrell, J., Reali, A., Bazilevs, Y., Hughes, T.: Isogeometric
analysis of structural vibrations. Comput. Methods Appl. Mech. Eng.195(41), 5257–5296 (2006). John H. Argyris Memorial Issue. Part II
De Marqui Jr, C., Maria, M.J.: Effect of piezoelectric energy harvesting on the response of a generator wing to a tur-bulence gust. In: 27th Congress of the International Council of The Aeronautical Sciences (2010)
De Marqui, J.C., Erturk, A., Inman, D.J.: An electromechanical finite element model for piezoelectric energy harvester plates. J. Sound Vib.327(1), 9–25 (2009)
Erturk, A., Inman, D.J.: A distributed parameter electrome-chanical model for cantilevered piezoelectric energy har-vesters. J. Vib. Acoust.130(4), 041,002 (2008)
Erturk, A., Inman, D.J.: An experimentally validated bimorph cantilever model for piezoelectric energy harvesting from base excitations. Smart Mater. Struct. 18(2), 025,009 (2009)
Erturk, A., Inman, D.J.: Piezoelectric Energy Harvesting. Wiley, New York (2011)
Erturk, A., Vieira, W.G.R., De Marqui, J.C., Inman, D.J.: On the energy harvesting potential of piezoaeroelastic systems. Appl. Phys. Lett.96(18), 184103 (2010)
Evans, J.A., Bazilevs, Y., Babuka, I., Hughes, T.J.: n-widths, supinfs, and optimality ratios for the k-version of the iso-geometric finite element method. Comput. Methods Appl.
Mech. Eng. 198(21), 1726–1741 (2009). Advances in
Simulation-Based Engineering Sciences Honoring J. Tinsley Oden
Fischer, P., Klassen, M., Mergheim, J., Steinmann, P., Mu¨ller, R.: Isogeometric analysis of 2D gradient elasticity. Com-put. Mech.47(3), 325–334 (2011)
Hammami, W., Padmanabhan, R., Oliveira, M.C., BelHadjSa-lah, H., Alves, J.L., Menezes, L.F.: A deformation based blank design method for formed parts. Int. J. Mech. Mater. Des.5(4), 303 (2009)
Hughes, T., Cottrell, J., Bazilevs, Y.: Isogeometric analysis: CAD, finite elements, NURBS, exact geometry and mesh
refine-ment. Comput. Methods Appl. Mech. Eng. 194(3941),
4135–4195 (2005)
Khakalo, S., Niiranen, J.: Isogeometric analysis of higher-order gradient elasticity by user elements of a commercial finite element software. Comput. Aided Des.82, 154–169 (2017) Kwon, Y., Bang, H.: The Finite Element Method Using MATLAB. Mechanical and Aerospace Engineering Series, 2nd edn. CRC Press, Boca Raton (2000)
Lai, W., Yu, T., Bui, T.Q., Wang, Z., Curiel-Sosa, J.L., Das, R., Hirose, S.: 3-D elasto-plastic large deformations: IGA simulation by Bezier extraction of NURBS. Adv. Eng. Softw.108, 68–82 (2017a)
Lai, Y., Zhang, Y.J., Liu, L., Wei, X., Fang, E., Lua, J.: Inte-grating CAD with Abaqus: a practical isogeometric anal-ysis software platform for industrial applications. Comput. Math. Appl.74(7), 1648–1660 (2017b)
Li, D., Wu, Y., Ronch, A.D., Xiang, J.: Energy harvesting by means of flow-induced vibrations on aerospace vehicles. Prog. Aerosp. Sci.86, 28–62 (2016)
Lipton, S., Evans, J., Bazilevs, Y., Elguedj, T., Hughes, T.: Robustness of isogeometric structural discretizations under severe mesh distortion. Comput. Methods Appl. Mech. Eng.199(5), 357–373 (2010)
Nguyen, V.P., Anitescu, C., Bordas, S.P., Rabczuk, T.: Isoge-ometric analysis: an overview and computer implementa-tion aspects. Math. Comput. Simul.117, 89–116 (2015) Ochoa, O., Reddy, J.: Finite Element Analysis of Composite
Laminates. Solid Mechanics and Its Applications. Kluwer, Dordrecht (1992)
Pasharavesh, A., Ahmadian, M.T., Zohoor, H.: Electrome-chanical modeling and analytical investigation of nonlin-earities in energy harvesting piezoelectric beams. Int. J. Mech. Mater. Des.13(4), 499–514 (2016)
Phung-Van, P., Lorenzis, L.D., Thai, C.H., Abdel-Wahab, M., Nguyen-Xuan, H.: Analysis of laminated composite plates integrated with piezoelectric sensors and actuators using higher-order shear deformation theory and isogeometric finite elements. Comput. Mater. Sci.96(Part B), 495–505 (2015). special Issue Polymeric Composites
Rogers, D.F.: An Introduction to NURBS: B-spline. The Mor-gan Kaufmann Series in Computer Graphics. MorMor-gan Kaufmann, San Francisco (2001)
Sartorato, M., de Medeiros, R., Tita, V.: A finite element for-mulation for smart piezoelectric composite shells:
experimental evaluation. Compos. Struct. 127, 185–198 (2015)
Shumaker, T., Madsen, D., Laurich, J., Black, C., Malitzke, J.: AutoCAD and Its Applications Advanced 2016. Good-heart-Willcox Publisher, Tinley Park (2015)
Standards Committee of the IEEE Ultrasonics, Ferroelectrics, and Frequency Control Society IEEE Standard on Piezo-electricity. ANSI/IEEE Std 176-1987 (1988)
Stanton, S.C., Erturk, A., Mann, B.P., Inman, D.J.: Nonlinear piezoelectricity in electroelastic energy harvesters: mod-eling and experimental identification. J. Appl. Phys.
108(7), 074,903 (2010)
Thai, C.H., Nguyen-Xuan, H., Nguyen-Thanh, N., Le, T.H., Nguyen-Thoi, T., Rabczuk, T.: Static, free vibration, and buckling analysis of laminated composite Reissner–
Mindlin plates using NURBS-based isogeometric
approach. Int. J. Numer. Methods Eng.91(6), 571–603 (2012)
Tsushima, N., Su, W.: Modeling of highly flexible multifunc-tional wings for energy harvesting. J. Aircr. 53(4), 1033–1044 (2016)
Wang, D., Liu, W., Zhang, H.: Novel higher order mass matrices for isogeometric structural vibration analysis. Comput. Methods Appl. Mech. Eng.260, 92–108 (2013)
Wang, D., Liu, W., Zhang, H.: Superconvergent isogeometric free vibration analysis of Euler Bernoulli beams and Kirchhoff plates with new higher order mass matrices. Comput. Methods Appl. Mech. Eng.286, 230–267 (2015)
Willberg, C., Gabbert, U.: Development of a three-dimensional piezoelectric isogeometric finite element for smart struc-ture applications. Acta. Mech.223(8), 1837–1850 (2012) Xiang, J., Wu, Y., Li, D.: Energy harvesting from the discrete
gust response of a piezoaeroelastic wing: modeling and performance evaluation. J. Sound Vib. 343, 176–193 (2015)
Yin, S., Yu, T., Bui, T.Q., Xia, S., Hirose, S.: A cutout isoge-ometric analysis for thin laminated composite plates using level sets. Compos. Struct.127, 152–164 (2015) Yin, S., Yu, T., Bui, T.Q., Liu, P., Hirose, S.: Buckling and
vibration extended isogeometric analysis of imperfect graded Reissner–Mindlin plates with internal defects using NURBS and level sets. Comput. Struct.177, 23–38 (2016) Yin, S., Yu, T., Bui, T.Q., Zheng, X., Yi, G.: Rotation-free isogeometric analysis of functionally graded thin plates considering in-plane material inhomogeneity. Thin Walled Struct.119, 385–395 (2017)
Yu, T., Yin, S., Bui, T.Q., Hirose, S.: A simple FSDT-based isogeometric analysis for geometrically nonlinear analysis of functionally graded plates. Finite Elem. Anal. Des.96, 1–10 (2015)