I
I
I I I
:I I
'
I I • I
'!
11
I I I I
I I
Temporal context
•
Ill
land cover classification
by
R W
Fitzgerald
A thesis submitted for the degree of
Doctor of Philosophy
Department of Geography
Australian National University
13 February, 1997
Declaration of Originality
Declaration of Originality
All analyses and arguments presented in this thesis are my own except where
otherwise indicated by way of citation. No part of this thesis has been presented as
part of any tertiary qualification at any University.
R W Fitzgerald
13 February, 1997
THEMA99M.WPD 13 February, 1997
..
I j
I
I
i
Acknowledgments
Acknowledgements
Like many theses before me, typing this marks the end of a long and enjoyable journey of exploration, frustration and now relief - its over.
My wife Helen and two boys Riard and Chris have patiently understood this act of insanity called doing a thesis. They have all put up with me, travelled to conferences (a terrific reward for them) with me, cursed the damned thesis and generally given me a hard time with a view to making sure it got finished. It now is, so hello again team.
Dr. Brian Lees has been the best supervisor a struggling student could ask for. Fi1m,
fair and persistent. His encouragement to get slabs of the thesis published at international conferences has brought such terrific benefits to 1ne. I have met top people in my field, bounced ideas around with them, adopted the discipline of preparing papers and had them peer reviewed. Thanks Brian. Scotland is proud of you.
Drs. Stuart Davey and Rob Williamson were my advisory panel members. Their 'steady as she goes' guidance was most appreciated.
During the four year journey a number of individuals added pieces to the puzzle. Dr. Paul Whitbread helped focus early ideas. Prof. John Richards helped me very early on decide which side of the neural network fence I should inhabit. Dr. Richard Aspinall showed me the ecological modelling perspective. Mark Gahegan's enthusiasm for Devonshire teas and a chat about GIS were most welcon1e. Mrs. Kim Smith helped immensely and kept the Wordprocessor under control. Dr. Cedric Bullard stood vigil during the final drafts and proof read draft 2 with consu1nmate
THEMA99M.WPD
I
I'
l I ! I
I
I
t
I I
I I,
~ II
'
I
Acknowledgments
ease. Kaz Singer provided another valuable proof reading perspective. Ted
Chapman and later Dr. Larry Stemstein helped me cope with the scholarship side of
the University. The Head of department Prof. Diana Howlett and the staff of the
ANU Geography department (Helena, Val, Kevin, Peter and Rose) smoothed my
path through the University maze.
The early work on neural networks by Dr. Jon Benediktsson and Prof. Phillip Swain
inspired the classification vehicle of this thesis. The work of Prof. Russell Congalton
provided the statistical rigour for the accuracy assessment. A number of chance
meetings with Prof. Peter Burroughs in various forums around the world proved
inspirational. Dr. Dean Graetz and Dr. Joe Walker of CSIRO provided pragmatic
role models in the use of remotely sensed and environmental data in the debate over
environmental health.
Its a lovely autumn day, I'm going for a well earned walk!
Thanks.
THEMA99M.WPD
13 February, 1997 lV
'
I
I
J
ii
I I
I
II
I
I
I~ II j
'
I
I
t
'·
Abstract
Abstract
This thesis examines the application of temporal context to the classification of multi-temporal remote sensing and environmental data. A te1nporally invariant land cover classifier of multi-temporal remotely sensed and environmental data is developed in this thesis.
Multi-temporal remotely sensed data presents a number of significant proble1ns for
the statistical and spatial competence of a classifier. Ideally, a classifier of multi-temporal data should be multi-temporally invariant. It must have the capacity to account
for the variations in season, growth cycle, radiometric and atmospheric conditions
at any point in time when classifying land cover.
This thesis tests two methods of creating a temporally invariant classifier based on
the pattern recognition capabilities of a neural network. A suite of 12 multi-temporal datasets spread over 4½ years along with a comprehensive mix of environmental
variables are fused into floristic classification images by the neural network based classifier. Uncertainties in the classifications are explicitly addressed with a
confidence mask derived from the output of the classifier. The confidence mask is used to produce a constrained classification image.
The temporally invariant classifier developed in this study consistently achieved
average overall classification accuracies within dates of 60% and between dates of
78%. The randomized trained temporally invariant classifier seems more robust than conventional statistical classifiers against the variations of season, radiometric and
THEMA99M.WPD
13 February, 1997 V
Abstract
atmospheric conditions and shows great promise as a temporally invariant classifier.
The performance of the temporally invariant classifier was benchmarked against a
conventional GML statistical classifier. The GML classifier averaged an overall
classification accuracy of 64% both within and between dates. The GML classifier
was not exposed to temporal context and this may be evident in the 14%
improvement in the classification accuracy achieved between dates by the temporally
invariant classifier.
THEMA99M.WPD
-:I
I
'l '
I
I [I
11
1,
I I
• I
l
:
a
r,
C1
I
Table of Contents
Table of Contents
Declaration of Originality . . . ii
Acknowledgements ... iii
Abstract ... v
.. Table of Contents . . . vu List of Figures ... xi
List of Tables ... . xiii
Chapter 1, Introduction . . . 1
A temporally invariant land cover classifier . . . 1
Spatial context information and land cover classification . . . 4
The issues that prompted the development of a temporally invariant classifier
6
Cascade classifiers, neural networks, controlled change and GML benchmarking . . . 10Summary ... 12
Chapter 2, Literature Review . . . 13
Contextual information . . . 13
Multi-temporal remotely sensed datasets . . . 17
Propagation of errors in spatial data . . . 1 7 Conventional classification of spatial data . . . 20
AI tools for the classification of multi-spectral data . . . 20
The application of neural networks to land cover classification . . . 22
Multi-temporal land cover classification . . . 24
Decision trees as land cover classifiers . . . 25
Fuzzy sets as a tool for classification . . . 27
Radiometric & atmospheric affects in multi-temporal classification . . 28
Classification accuracy assessment . . . 3 1 Summary ... 34
Chapter 3, Research Design . . . 3 6 Temporal context design . . . 36 Creating a temporally invariant classifier . . . 3 7
THEMA99M.WPD 13 February, 1997
..
-'
I
I
I
I f,
J i
'
,
,
11
11
I ~
,
Table of Contents Vertical and horizontal neural network vector integration in temporal
analysis . . . 39
GML benchmarking and controlled change tests ... 42
Testing the performance of a temporally invariant classifier . . . 43
Attributes of temporal context . . . 45
Confidence values . . . 46
Multi-temporal dataset design . . . 52
Spectral and environment variables - visualisation and analysis . . . 53
Summary . . . 55
Chapter 4, Methods . . . 56
The study area . . . 56
A brief history of the ANU Kioloa dataset . . . 59
Multi-temporal dataset definition and compilation . . . 60
Controlled changes in land cover over time . . . 64
Data flow and processing . . . 67
Sequential and randomised training of a neural network based classifier in temporal context . . . 69
Sequential training of a neural network in temporal context . . . 7 4 Randomised training of a neural network in te1nporal context . 78 GML benchmarking of temporally invariant classifier performance . . 79
Summary . . . 80
Chapter 5, Results . . . 83
Controlled changes in land cover over time - results . . . 83
Sequential training of temporal context - results . . . 84
Randomised training of temporal context - results . . . 88
Evaluating the performance of the temporally independent classifier . 93 GML benchmarks . . . 96
Summary . . . 99
Chapter 6, Discussion . . . . 107
107 The evolution of the sequential training of temporal context ... . The performance of the temporally invariant classifier between dates 109 The spatial agreement of the temporally invariant and GML classifier's resultant images . . . 111
Summary . . . 114
Chapter 7, Conclusions . . . 119
Bibliography . . . 127
Appendix 1, The ANU KIOLOA (1994) Remote sensing & GIS dataset . . . . 155
THEMA99M.WPD
"
I'
I I
I
I
j
I
I
11
I
1·
Table of Contents
Appendix 2, Annotated file listing 199
ANU Kioloa 30x30m Multi-temporal Dataset (1995) annotated file listing
for archive tape . . . 200
HN C Explorenet Neural network application files . . . 212
FORTRAN 77 input vector generation and BPN feed forward simulator programs . . . 216
Appendix 3, The multi-temporal extension (1995, ver 95.1.0) ... 220
Introduction . . . 221
Documentation title: . . . 221
Compiler of documentation: . . . 221
Address for correspondence: . . . 222
Dataset version history: . . . 222
Topographic map base ... 222
LANDSAT TM re1notely sensed i1nage specifications . . . 222
Geometric rectification (Warping), re-sampling and geo-referencing . 223 Appendix 4, Computer software utilised . . . 232
Image processing . . . 23 3 Word processing, tables, figures and bibliography preparation. . . . 233
Appendix 5, Papers in press . . . 235
Abbreviations . . . 285
Glossary of terms . . . 296
Index - Keywords . . . 3 02
THEMA99M.WPD
I
!
:1'
I
I
i
I
I
I
I
II
I
l
f
I
,1
I
1.
I
J
II ti
i
,,
I I
List of Figures
List of Figures
Figure 1: The Kioloa study area, South East New South Wales . . . 57
Figure 2: Fully classified integer Rank 1 i1nage of T2 by the T2 trained neural
network (T2w3rl). . . . 103
Figure 3: Fully classified integer Rank 1 image of T6 by the T2 trained neural
network (T6w3r 1 ). . . . 103
Figure 4: Sequential training, variant B constrained image 104
Figure 5: Sequential training, variant D constrained image . . . 104
Figure 6 Randomized training, variant E, constrained i1nage on T8. . . . 105
Figure 7 Tl 0, randomized training, variant E. . . . 105
Figure 8 TO, randomized training, variant E.
Figure 9 T 1, randomized training, variant E.
106
106
Figure 10 Evolution of sequential training, variant B, intermediate steps in temporal
exposure. . . . 116
Figure 11 The evolution of the sequential training of variant B, overall classification
accuracy for each floristic class . . . 116
Figure 12 Comparative GML classifier performance on the four validation dates.
117
Figure 13 Comparative TIC performance on the four validation dates. . . . 117
Figure 14: The Geological formations within the Kioloa study area. . . . 118
Figure 15: GML classification of TIO with 5% exclusion ... 118
THEMA99M.WPD
·-I
,:
J
I
,,
! I
1:
u
I
I I
cl
lt
'[
r 1,
I
ii 1
[,
List of Tables
List
o
f
Tables
Table 1: Comparison of selected published neural network land cover classification
results. . . . 22 Table 2: The multi-temporal sequence of the ANU Kioloa (1994) dataset. ... 40
Table 3: Variants of vector integration type and spatial context. . . . 42
Table 4: An example of the output vector of a neural network. . . 48
Table 5: The 9 class floristic schema and number of ground truth sites for each class
58
Table 6: Source blocks, their location & names for the in controlled land cover
change experiment. . . . 64 Table 7: Target blocks overwritten in the controlled land cover change experiment.
65
Table 8: File flow of the classification of T2 & T6 controlled change experiment.
... 66 Table 9: File flow of T2 & T6 datasets and environmental variables in controlled
change experiment . . . 7 0 Table 10: Flow diagram of image and neural network processing . . . 70
Table 11: Neural network input vector structure and content. . . . 73 Table 12: Neural network structure determination for sequential lean1ing of temporal
context. . . 75 Table 13 Neural network structure determination for randomized learning of
temporal context. . . . 77
Table 14: Resultant classified i1nage filenames from the GML and TIC classifiers.
81
Table 15: Relative classification performance ( overall classification accuracy¾) of
4 sequential learning variants of temporal context. . . . 85
Table 16 Error matrix for constrained classification of T8 based on rando1nized
THEMA99M.WPD
~ I
I
I
I
i I
'
I
I I I
I I
Ill
I
I
,
,
II
ii
I
I
I I
I
I
List of Tables
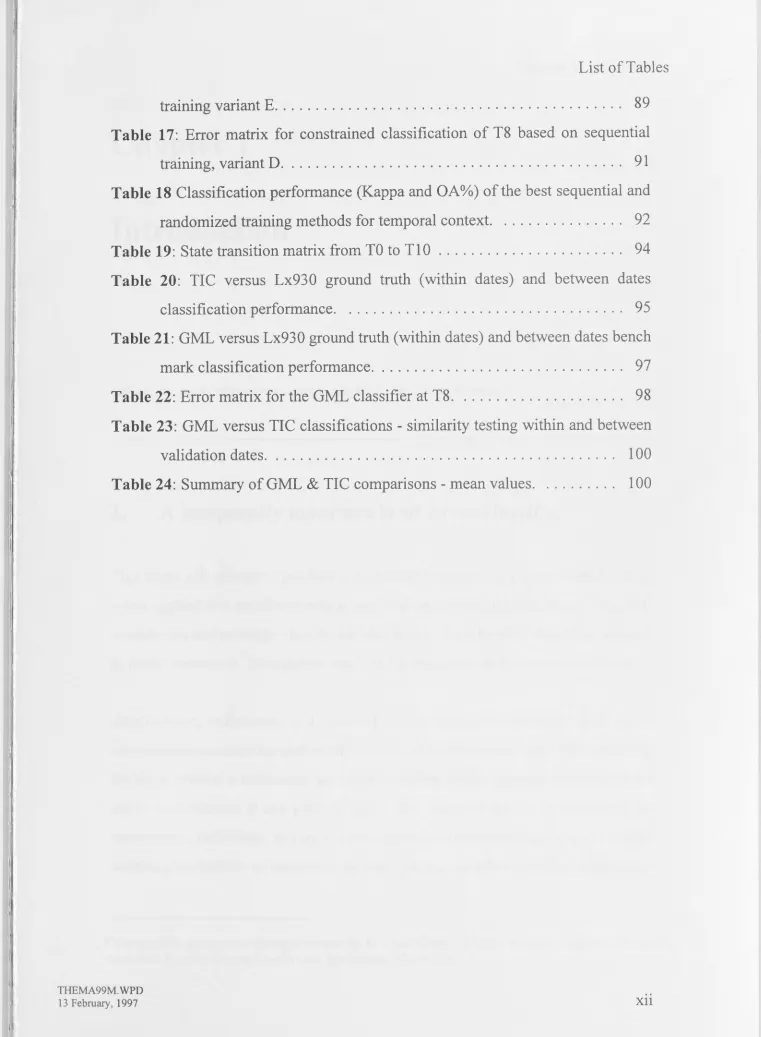
training variant E. . . . 89
Table 17: Error matrix for constrained classification of T8 based on sequential
training, variant D. . . . 91
Table 18 Classification perfonnance (Kappa and OA % ) of the best sequential and
randomized training methods for temporal context. . . . 92
Table 19: State transition matrix from TO to Tl 0 . . . . . . 94
Table 20: TIC versus Lx930 ground truth (within dates) and between dates
classification performance. . . . 9 5
Table 21: GML versus Lx930 ground truth (within dates) and between dates bench
mark classification performance. . . . 97
Table 22: Error matrix for the GML classifier at T8. . . . 98
Table 23: GML versus TIC classifications - similarity testing within and between
validation dates. . . . 100
Table 24: Summary of GML & TIC comparisons - mean values. . . . 100
THEMA99M.WPD
13 February, 1997
[image:12.794.24.785.29.1066.2]I
I
j
Chapter 1, Introduction
Chapter 1
Introduction
"Humans make the obvious unthinkable", Dr. Dean Graetz.1
1.
A temporally invariant land cover classifier
This thesis will attempt to produce a temporally invariant land cover classifier that,
when applied to a set of remotely sensed and environmental data at any date, will
consistently and correctly classify the land cover. The classifier should be adapted to time, seasonality, illumination angle and atmospheric and radiometric effects.
Atmospheric, radiometric and seasonal effects are known to affect land cover classification accuracy using re1notely sensed and environmental data. By controlling
for these effects, a temporally invariant classifier should produce consistent land
cover classification at any point in time. The classifier should be unaffected by
atmospheric, radiometric or seasonal effects that have conventionally plagued remote sensing classification techniques in the past. Such a classifier would be a large step
This quotable quote arose during a tutorial by Dr Dean Graetz, CSIRO Wildlife, Canberra, at the 7th Australian Remote Sensing Conference, Melbourne, March 1994
THEMA99M.WPD
-I
'
I
I
I
I
[1
I
1,
I
I
I
I
I
• !
i I
1,
p
I 1,
II
2
Chapter 1, Introduction
forward in the analysis of multi-temporal remotely sensed datasets.
The temporally invariant land cover classifier that will be developed in this study
incorporates a neural network adapted to multi-temporal pattern recognition. The
classifier will be trained to recognise and adapt to at1nospheric, radiometric and
seasonal effects inherent in a multi-temporal remote sensing and environmental
dataset.
Floristic classification from multi-temporal remotely sensed data is a difficult task.
Temporal auto-regression makes most remotely sensed data either redundant in the
classification process or confuses the classifier. This thesis will discuss two methods
at creating a temporally invariant classifier for floristics using multi-te1nporal
remotely sensed and environmental data. The two methods to be used to create a
temporally invariant classifier will be supervised sequential and randomised training
of the neural network within the temporally invariant classifier.
A temporally invariant classifier is not designed for multi-temporal change detection.
A temporally invariant classifier can be applied to the task of floristic classification
of remotely sensed data at any point in time and produce a consistent floristic
vegetation classification. It is a floristic classifier that has prior knowledge of the
temporal domain. It would not be confused by seasonality, day length and other
attributes of the temporal domain which include radiometric and atmospheric effects
and temporal auto-regression2• These attributes are some of the components of
temporal context that will be investigated in this thesis.
In this study, a multi-temporal remotely sensed dataset containing 12 discrete ti1ne
slices of the Kioloa study area, SE Australia, are overlayed and co-registered with a
The term auto-regression is borrowed from the field of statistical time series analysis. An auto-regressive
process predicts the next value of the time series from a linear combination of the immediately (hence the
term auto) preceding values of the time series (hence the term regression).
THEMA99M. WPD
Chapter 1, Introduction
single time slice of environmental data. Thus, the multi-temporal character of the
combined datasets is embodied in the remotely sensed component.
The temporal extent of the multi-temporal dataset assembled for this study compares
well with those reported in literature. Eastman (1992) assembled a sn1all suite of 12
by 1 month sub-scenes. Henebry ( 1993) had nine images ( one per year) while Jeon
& Landgrebe (1992) had only two dates. This thesis assembles 12 dates spread over
4½ years with three dates per calender season.
The topics within the field of remote sensing research that are most relevant to this
thesis are multi-temporal classification, classification techniques, assessment of
classification accuracy and the application of automated classification techniques.
Much of the literature is more focused on either multi-temporal change detection of
land cover or the incorporation of multi-temporal images into land cover
classification.
Very often, the incorporation of multi-temporal data into land cover classification
confounds the classification accuracy of land cover classification as Blanda &
Pasquariello (1992) discovered. As a result, a substantial portion of this thesis will
be focused on a discussion of the analysis of temporal context and its effects on the
statistical accuracy of land cover classification.
Land cover classification in remote sensing is usually achieved by the application of
statistical classification techniques such as Generalised Maximum Likelihood and
Cluster analysis. In this thesis, GML will be used as the benchmark land cover
classification technique for the assessment of the performance of the temporally
invariant classifier in the Kioloa study area.
Artificial Intelligence (AI) techniques are being applied to land cover classification
with increasing success. These techniques include expert systems, neural networks,
THEMA99M. WPD
I
~I ,,
I
I
I
I I
I I
!
I
II
~
II
I
I
I
Chapter 1, Introduction
genetic algorithms and fuzzy classification techniques. An advantage of Fuzzy
classifiers is that they allow the application of continuous classification schemes to
natural phenomena (Bonham-Carter, 1994).
Whatever the land cover classification technique used, assessing the accuracy of land
cover classification has many pitfalls for new players. The essential questions
addressed by the techniques of assessing accuracy are, how confident is the user in
the classification result produced, and where do the errors in that classification come
from?
Methods of assessing classification accuracy, the sampling sche1nes used and the
sources of error and noise are most ably addressed by Janssen & van der Wel (1994)
and Lunetta et.al. (1991 ). In this regard, the effects of atmospheric and radiometric
factors on the acquisition of remotely sensed data often swamp other sources of error
(Landgrebe & Malaret, 1986).
2.
Spatial
context
information
and
land
cover
classification
The proposition that introducing contextual information into modelling, using raster
data, will in1prove the accuracy of the result, is rarely tested. It can be shown that the
utility of contextual information in spatial modelling depends on the homogeneity of
the classes to be modelled (Fitzgerald & Lees, 1994b ). There is however little
published work on the utility of temporal context in spatial modelling.
The assumption underlying the introduction of context information is that, if
neighbouring cells are similar, this similarity will increase the confidence with which
one can allocate the central cell to the appropriate class. In other words, classes with
THEMA99M.WPD
I
I
I
I
Chapter 1, Introduction
high spatial, or temporal, autocorrelation will benefit most. Unfortunately, this
autocorrelation depends on the relationship between cell size, sample interval and the
level of within class variability. Thus, the definition of context must vary as this
relationship varies.
Spatial context is used extensively in geo-statistics. Regionalised variable theory is
used to model the spatial distribution of minerals and ores (Hohn, 1988).
Geo-statistics successfully uses the inherent spatial context information in spatial
phenomena, via the semi-variogram and models based on it. Therefore, by not using
spatial context we are handicapping any classifier in ecological or environmental
modelling. All the neighbourhood pixels are more likely to be similar and the saine
floristically.
Spatial context and its complexity is reflected by the relationship between spatial
autocorrelation, within class homogeneity and spatial context scale. Spatial
complexity is a function of:
• The raster grid cell size;
• The underlying floristic structure;
• The quality of the sampling scheme;
• The within class spectral and environmental variables' homogeneity of
vanance;
• The spatial homogeneity and texture;
• The natural variety of terrain, topography, illumination, geology, hydrology
etc. that a class can exhibit;
• The boundary transition zone sharpness of each class (Fitzgerald & Lees,
19946).
The interaction of all the above seven components of spatial complexity creates a
very difficult task for any classifier in land cover classification. The diverse patterns
of spatial complexity exhibited in feature space can be mapped by the rich internal
THEMA99M. WPD
' I
I
I
I
I
Chapter 1, Introduction
structure of a neural network. Provided a good representative training sample of the
full variety of spatial complexity is given to the neural network, and sufficient
inten1al nodes are available, the neural network will learn and generalise this pattern
mapping.
Spatial context in land cover classification is useful. Fitzgerald & Lees (1994b)
showed a 10% increase in classification accuracy just by using a 3x3 spatial context
window. Whitbread (1993) demonstrated large increases up to 30% in classification
accuracy by using spatial context. Latty & Hoffer (1981) found the reverse;
including spatial context confused their classifier.
The incorporation of contextual information into land cover classification is most
useful. In this regard, the inclusion of spatial and temporal context has been shown
by Eastman (1992), Henebry (1993) and Jeon & Landgrebe (1992) to be of great
assistance in the production of a single land cover classification for change detection
purposes. What this thesis intends will be different to the above. The aim is to
produce a temporally invariant classifier which can produce consistent and invariant
land cover classifications at any point in time.
3.
The issues that prompted the development of a
temporally invariant classifier
The components of land cover consist of vegetation, water (in all of its phases), soil,
geology, topography and climatic setting. These components function together as the
habitat. They provide the resources for life. These resources have an interface to the
energy and 1nass cycles between the atmosphere and the lithosphere.
The main factors that drive land cover change are: land use, especially from
THEMA99M.WPD
'11
, I
I
'
I
'
I
'
1:
I I
a
11
I
Q
11
I
,, I
Chapter 1, Introduction
population growth, climate, and changes to the CO2 cycle. The relationship between
land cover and land use is multi-functional.
Vegetation and soils are two of the most important factors of land cover. Vegetation
has attributes such as structure (both spatial and biomass generation), function
( exchange and storage) and species capacity.
The analytical tools for the detection and monitoring of land cover change are poorly
developed to date. Re1note sensing is the best tool available for multi-temporal land
cover classification and change detection.
Multi-temporal land cover classification, with specific emphasis on vegetation
classification, will be the application topic addressed by this thesis. Unfortunately,
vegetation and vegetation structure contribute less to the re1notely sensed signal than
do cloud shadow, topography, land use and fire history. As Lees & Ritman (1991)
note, remote sensing is the tool of choice when classifying disturbed landscapes,
while GIS based environmental modelling is more successful in undisturbed natural
environments. They show that remote sensing can be used to constrain the land
cover classification produced from a GIS based model.
In modelling the Australian landscape, the two dominant features in the re1notely
sensed signal are disturbance from fire, fire history, and topography. In this regard,
remote sensing models the disturbance and topography well and the GIS models the
rest. The GIS also contains topographic information and so can modify the influence
of that component of the remote sensing signal. Thus the remote sensing and GIS
components interact in the modelling process (Lees & Ritman, 1991 ). The Kioloa
study area contains both fire history and topographic effects on the landscape.
The Kioloa study area is the primary source of data for this thesis. Kioloa is located
in south east New South Wales, Australia, just north of the coastal town of Batemans
THEMA99M. WPD
0
I
I
j
I
p I
I
I
I
'I
I I
I
I
I,
I
I
I
I!
!
I
11
I
! I
Chapter 1, Introduction Bay and south of Ulladulla. The study area is centred on 35 ° 35' S, 150 ° 15' E. Figure 1 shows the approximate location of Kioloa. The study area is 25 x 25 km square and contains varied topography ranging from sea level to 285m. The Tas1nan Sea accounts for 20% of the total area. The study area contains rainforest, disturbed forestry areas, cleared land and beachfront.
Many different land cover classifiers, including those using decision trees and neural networks, have been applied to the ANU Kioloa dataset. The overall classification accuracy achieved by these classifiers was between 60% and 70% (Lees & Ritman,
1991; Moore, Lees & Davey, 1991; Fitzgerald & Lees, 1992a). The spatial sophistication and distribution of the land cover classification results of these classifiers are quite different. The difference between these classifiers is also reflected in their use of the precious ground truth data. Decision trees consume all of the ground truth sites during training while neural networks are much more frugal and are able to split the ground truth data into statistically independent training, test and validation sets (Fitzgerald & Lees, 1994a).
A comparison between the correlation models such as BIOCLIM (Nix, 1986) and the data driven modelling of decision trees and neural networks is highlighted by
Bonham-Carter (1994). The data driven models have the advantage of simplicity in application. Unlike knowledge driven models, they do not require the formalisation of process knowledge into a model.
Land cover classification is often a precursor to change detection. Change detection,
especially in relation to climate, is one of the most hotly debated issues in Environmental Science. Remote sensing is probably the best tool for global scale monitoring of the environment. However, several important factors limit and define the borders of its utility;
•
THEMA99M. WPD
13February, 1997
The relationship of individual species to their reflectance value as sensed by
-'
I
l
' .,
I.
I
I
I I
I
11 I!
I
'
:
a
I
ii
I
Chapter 1, Introduction
the satellite instrument. Lees & Ritman ( 1991) showed that the within
species variance is often greater than the between species variance.
• Remote sensing has difficulty sensing the vegetation understorey as it is
usually obscured by the tree canopy. As this understorey is considered the
most immediately sensitive to climate change, remote sensing has difficulty
detecting this immediate response. From the perspective of climate change
detection via vegetation response, remote sensing may be the only practical
tool for the global scale of the problem, but its application to this problem is
complex and difficult.
Current land cover classification schema consist of discrete classes such as sea, fore st
and agricultural crop types. The inability of the classification scheme to correctly
describe the underlying land cover complexity is exhibited in the land cover classifier
by confused thematic classes. The discrete classes of the classification scheme
ignore the continuous nature of the underlying species and community distributions
on the ground. Some authors are experimenting with fuzzy logic classifiers directly
to address this issue (Fisher & Pathirana, 1990; Bonham-Carter, 1994).
The spatial homogeneity of the thematic classes has a large effect on the relationship
of spatial context scale and classification accuracy. The more homogeneous a
thematic class, the larger is the spatial autocorrelation about any given pixel as
measured by Moran's
I
or the geo-statistical semi-varianceA.
From this it follows that the confidence in the classification will be higher.The issues which are important 1n land cover classification, especially in the
Australian context, include disturbance, especially fire history, topography and the
spatial homogeneity of the thematic classes. These issues have been examined during
the development of a number of different classifiers applied to the ANU Kioloa
dataset. They can be thought of as contextual information which needs to be
THEMA99M. WPD
-'
I
Pl 1 I f
,,
I
11
I
11
I
I I
ii
i
i
a
,,
II
Chapter 1, Introduction
incorporated into the classification.
4.
Cascade classifiers, neural networks, controlled
change and GML benchmarking
Two separate problems arise in the incorporation of contextual information in land
cover classification. First, there is the added computational complexity and
decreased degrees of freedom required by having to define more spectral classes for
each new spatial, temporal and spatio-temporal class. The definition of extra spectral
classes is required to satisfy the multi-variate assumptions of normality of each
spectral class. Secondly, the temporal changes in class should ideally be viewed
simultaneously by the classifier. This is, however, usually impractical, given the
degrees of freedom problem with conventional statistical techniques (Fitzgerald &
Lees, 1994b ).
The method adopted by Jeon & Landgrebe (1992) to overcome these problems, was
to create temporal transition matrices ( one for each date pair) and use a cascading
statistical classifier that trained on one temporal dataset at a time. The matrix
consists of attribute class values at time Tl as the columns and their subsequent value
at time T2 on the rows of the matrix. Those class values on the diagonal of the matrix
experienced no change in class value from ti1ne Tl to T2. This temporal transition
matrix is similar to a Markov state transition matrix.
The temporal transition matrices approach of Jeon & Landgrebe (1992) will be
mirrored in this thesis by the sequential training of the neural network included in the
classifier. The neural network is exposed to temporal context one date at a time. The
neural network a posteri constructs a temporal state transition matrix of probabilities
internally ( expressed as the weights within each network layer) at each training stage.
THEMA99M. WPD
Chapter 1, Introduction
The cascading statistical classifier of Jeon & Landgrebe (1992) mirrors an early
proposal for developing a temporal diffusion matrix in this thesis. It was
subsequently superseded by later work as discussed below. The proposal was to
create a cascading series of transition matrices containing the probability of change
in thematic class from one date to the next. These temporal transition or diffusion
matrices could then be used by a Markov model, or input to some form of
multi-variate analysis.
Neural networks have demonstrated their ability to classify land cover successfully.
The early work of Benediktsson (1989) and Ritter & Hepner (1990) along with the
author's experience (Fitzgerald, 1991) provides much support for the idea that neural
networks may also perform well with temporal context. The statistical flexibility and
lack of a priori assumptions about the input data by neural network classifiers
suggests that their application in the development of a temporally invariant classifier
could be useful.
GML classification is a well established and robust statistical technique which has
proved its worth in the classification of remote sensing data. As such, GML
classifiers provide a convenient benchmark with which to compare the performance
of a temporally invariant classifier. Three sets of GML benchmarks will be used to
assess the performance of a temporally invariant classifier; the within dates
comparison to the ground truth data; the pairwise between dates comparisons and the
direct comparisons to the temporally invariant classifier itself. These 3 sets of
benchmarks provide a comprehensive means of assessing the performance of a
temporally invariant classifier with multi-temporal data.
In using a neural network as the basis for a temporally invariant classifier, it will be
necessary to test the change detection capability of a neural network land cover
classifier on multi-temporal data. To this end, one of the multi-temporal datasets will
THEMA99M.WPD
I
I
~I
11
I
I,
,,
I:
I
I
I
II:
•
I
I
a
'1
Chapter 1, Introduction
be perturbed by the transposition of regular blocks of sea, paddocks and forest into
other areas of the sub-scene. A trained neural network classifier will then be tested
on this dataset to see if it can pick out the transposed blocks.
5.
Summary
This thesis will attempt to produce a temporally invariant land cover classifier that,
when applied to a set of remotely sensed and environmental data at any date, will
consistently and correctly classify the land cover. The classifier should be adapted
to time, seasonality, illumination angle and atmospheric and radiometric effects.
The previous successful applications of Artificial Intelligence techniques to land
cover classification have been described as background to the development of a
temporally invariant classifier. Cascade classifiers were considered as a design
method for the development of a temporally invariant classifier. This design concept
will be extended into the use of neural networks as the basis of a temporally invariant
classifier.
An experiment in gross land cover change is proposed to test a neural network based
classifier's ability to identify gross land cover change. The use of GML benchmark
classifications as a means of evaluating the performance of a temporally invariant
classifier will be identified.
THEMA99M.WPD
Chapter 2, Literature review
Chapter 2
Literature Review
1.
Conte
x
tual information
Contextual information in the analysis of remotely sensed data has many forms. It
is a subset of the concept of texture in remotely sensed data.3 Context is often used
as a generic term for spatial context in the remote sensing literature.
The two forms of contextual information discussed in this thesis are temporal and
spatial context with an emphasis on temporal context. Context includes the spectral,
thematic, floristic and structural characteristics of the spatial and temporal
neighbourhood of pixels surrounding the central pixel of interest. The dimensions
(spatial or temporal) of this neighbourhood and the rate of change in inter-pixel
association are central to the study of context in remotely sensed data.
A number of authors use texture and spatial context synonymously. Briggs & Nellis (1991) describe it in
terms of the similarity of a central pixel to surrounding pixels in a moving window. Henebry (1993)
describes texture as a generic term for the local effect of spatial dependence and heterogeneity.
THEMA99 .WPD
-I
'
i
1' l
I
1,
I 1 I
I
I
I
l
I
l
i
I
I
a
II
•
Ii
I 1,
Chapter 2, Literature review
Contextual information is most often ignored or discarded by re1note sensing
analysts, as noted by Jeon & Landgrebe (1992). The land cover classifiers developed
by these analysts usually concentrate on the spectral characteristics of single pixels.
The increased computational complexity, data management tasks and associated
computing overheads (increased disk space and memory require1nents) incurred by
including contextual information is cited for discarding context (Nagy, 1984; Jeon
& Landgrebe, 1992). Class transition probability matrices conveying temporal
infonnation during a cascading training process ( one temporal step at a time) is the
method employed by Jeon & Landgrebe (1990) to overcome the increased
computational complexity introduced by the inclusion of temporal context.
One of the main reasons for including contextual information is to improve the
accuracy of land cover classification. Multi-temporal analysis of remotely sensed
data for change detection, relies on the high autocorrelation between spatial variables
and land cover change (Green et.al., 1994). Equally the inclusion of multi-temporal
data can improve a uni-temporal land cover classification. Increases in classification
accuracy (the amount of increase in brackets) have been demonstrated by Lo et.al.
(1986) (2%), Blanda & Pasquariello (1992) ( 4%), Jeon & Landgrebe (1992) (5%),
Belward & Taylor (1986) (6%) Conese & Maselli (1991) (10%) and Kaifel & Loher
(1992) (15%). Thus, the inclusion of temporal context information generally
increases the classification accuracy.
The most easily accessible form of contextual information is spatial context. Bischof
et.al. (1992), Whitbread (1993) and Fitzgerald & Lees (1994b) have examined spatial
context using neural networks, and compared their performance with Generalised
Maximum Likelihood (GML) classifiers on the same datasets. Bischof et.al. shows
a gain in the overall accuracy percentage of around 3%. Whitbread shows dramatic
increases in classification accuracy of 30% with the inclusion of high order spatial
context (7x7 cells).
THEMA99M.WPD
I I
~''
I
'
I
'
I
I I
• I
I:
I
ii
I
I
i
[I
II
I I
I
Chapter 2, Literature review
The gains in classification accuracy by these authors are also supported by Khazenie
& Crawford (1989; 1990), Hepner et.al. (1990) and Fitzgerald & Lees (19946) who
showed gains in classification accuracy of 8 to 40%. Khazenie & Crawford's results
( an increase in classification accuracy of up to 40%) are based on simulation studies
alone. Jeon & Landgrebe (1992) showed that the inclusion of spatial context
increased classification accuracy by 2%. Including temporal context increased the
classification accuracy by 2% and both spatio-temporal context by 7%. Lo et.al.
(1986) found an increase of 3% with spatial context.
The scale of spatial context is sensitive to the underlying structure of the land cover
class (Fitzgerald & Lees, 19946 ). Choosing the optimum scale for each land cover
class is a trade-off between scale complexity, prediction confidence and classification
accuracy. There seems to be a relationship between the scale of spatial context and
classification accuracy for each land cover class. This relationship depends on the
spatial homogeneity and complexity of each land cover class (Fitzgerald & Lees,
19946 ).
The scale and complexity of spatial context can be reflected by the internal structure
of a neural network based classifier. The effects of the internal structure upon the
classification performance of a neural network classifier has not been substantively
addressed. Bischof et.al. (1992) showed that the number of hidden units can change
the overall classification accuracy by as much as 18%. Fitzgerald & Lees (19946)
extended Bischof s work and showed that the internal co1nplexity of the neural
network classifier must be matched to the complexity of the classification problem.
A constraint on this internal complexity is the number of ground truth training sites
required.
Temporal context itself has received more attention recently by authors using a
variety of techniques. These include Blonda & Pasquariello (1992), Jeon &
Landgrebe (1991, 1992), Khazenie & Crawford (1989, 1990), Shimoda et.al. (1990,
THEMA99M.WPD
13 February, 1997 15
1
' j
'I
I
'
'
I
I
.!
fl
I
a
'
',
:ii'
I
l
Chapter 2, Literature review
1991) and Middelkoop & Janssen (1991 ). Temporal context is discussed by these
authors in terms of the inherent temporal autocorrelation information contained in
a multi-temporal remotely sensed dataset. This information can aid land cover
classification.
A complex statistical algorithm that models the spatio-temporal autocorrelation
structure of the multi-temporal datasets was developed by Khazenie & Crawford
(1989, 1990). They incorporate the requirement for time series stationarity by
detrending the temporal data. Their classifier is tested with encouraging results on
a Monte Carlo simulated dataset.
The recent works ofMiddelkoop & Janssen (1991) and Jeon & Landgrebe (1992) are
the most relevant so far to the use of temporal context in land cover classification.
Markov transition matrices were used to express the temporal knowledge about crop
rotation by Middelkoop & Janssen (1991). They combined these matrices with
spectral and spatial data using a Bayesian classifier. This improved the classification
accuracy by only 4%. Jeon & Landgrebe (1991) created a statistically based,
bi-temporal contextual classifier. Using the immediate spatial and bi-temporal neighbours
for each pixel, they improved the classification accuracy by up to 8%.
The combination of spatial and temporal context shows great promise in
multi-temporal land cover classification. It is, however, a difficult and demanding task
from any of the computational, image processing and spatial classifier perspectives.
Only two authors cited have attempted to use spatial and temporal context together.
Jeon & Landgrebe (1992) have been examining this topic over many years and have
developed an impressive cascaded, transition matrix spatio-temporal classifier based
on Gibbs random fields. It has been tested on LANDSAT TM data with claimed
increases in classification accuracy of 6% to 8%. Khazenie & Crawford (1989, 1990)
have developed a spatio-temporal autocorrelation model and used Monte Carlo
simulations to assess the classification accuracy.
THEMA99M.WPD
-I
I'
1'
I I
11
I
I
I
I
I
J
I
II
ll
I
'
i
"
II
I
,I
I
I
L
I
I I
Chapter 2, Literature review
2.
Multi-temporal remotely sensed datasets
A multi-temporal remotely sensed dataset consists of many images, acquired at different points in time, co-registered to the same spatial location. Typically, acquisition dates are chosen to correspond to different growing stages of crops (Conese & Maselli, 1991; Hoffer & Lee, 1989; Prince, 1991; Mauser 1991). Each
image acquisition date can be thought of as a temporal sample point. The larger the number of sampling points, the more extensive and complex is the time series
analysis that can be carried out (Eastman, 1992, 1993; Eastman & Fulk, 1993).
The down side of increasing the number of temporal sampling points is in the problems of handling and manipulating larger volumes of digital data. The eno1n1ous complexity and subtlety of the multi-temporal classification proble1n is poorly understood.
As the number of temporal samples acquired increases, co-registration of all the multi-temporal datasets becomes more important. Belward & Taylor (1986) showed
that different re-sampling methods alone could change the classification accuracy by 2%. This is a small difference when compared to the other sources of confounding in remotely sensed datasets. This issue is also documented as part of a broader review of remotely sensed dataset processing by Lunetta et. al. (1991) and Jans sen & van der Wel (1994).
3.
Propagation of errors in spatial data
The preprocessing and analysis of remotely sensed data for its use in land cover
THEMA99M.WPD
I
'
I'
'
I
J
I
.
'C '
j:
II
'
i
ii
d
l ~
11
11
I
I
I
Chapter 2, Literature review
classification within a GIS is a chronology of accumulating error. From the n1oment
the solar radiation is reflected from a ground target, noise and a host of perturbations
confuse the analysts' attempts to use this acquired data for land cover classification.
These sources of noise and error are broadly grouped into four categories: sensor;
radiometric & atmospheric; image processing; and positional and attribute accuracy
issues within GIS.
Remote sensing sensors have three potential sources of noise that can reduce the
signal to noise ratios. These are atmospheric, sensor and quantisation errors
(Landgrebe & Malaret, 1986). The relative contribution of these three sources of
noise is explored by Landgrebe & Malaret (1986). They conclude that atmospherics
are by far the largest noise source in remotely sensed data. Quantisation noise is not
a problem with eight or more bits for the digital conversion (Landgrebe & Malaret,
1986; Wrigley et.al., 1984). Several authors have addressed the issue of sensor
induced noise including Conese & Maselli (1993) and Murphy et.al. (1985).
The transformation of remotely sensed images to a map coordinate system
(geo-referencing) induces positional accuracy errors depending on the quality and number
of ground control points and the warping process (Janssen & van de Wel 1994;
Lunetta et.al., 1991 ). The precision ( coordinate point exactness), accuracy ( absolute
closeness to a point) and reliability (RMS error as a statistical measure) of the
geo-referencing is usually poorly documented (Whitbread & Fitzgerald, 1994).
Ascertaining the magnitude and attitude of the errors in remotely sensed and
environmental data and their effects on the accuracy of classification and modelling
is an important research problem. The propagation of these errors within spatial
modelling and GIS is discussed in a comprehensive paper by Heuvelink et.al. (1989).
Authors including Bel ward & Taylor (1986), Townshend et.al. (1991 ), Peters et.al.
(1992), Gupta (1992) and Roy (1994) have discussed these issues in detail.
THEMA99M.WPD
•
,
I
i
I
~''
I
I
'
i:
I I II
,1i
I!
'
I
I
I
l
I,,
:I
I
,
4Chapter 2, Literature review The accumulation of error and noise are at their peak during the analysis of remote sensing and GIS datasets. Multi-temporal datasets potentially have 1nore accumulated error and noise than uni-temporal datasets. The sources of this error include the multi-temporal permutations of the image to image and image to map coregistration errors, sensor drift and atmospheric & radiometric differences over time. Janssen & van der Wel (1994) described these errors as the "Achilles heel" of GIS. Lunetta et.al. (1991) described how these errors are transferred from one processing step to the next.
High quality documentation for all the above error sources and processing stages is essential in allowing remote sensing and GIS practitioners to assess and cope with error in tertiary datasets (Lunetta et.al., 1991; Janssen & van der Wel, 1994,
Whitbread & Fitzgerald, 1994; Davis & Dozier, 1990). Janssen & van der Wel (1994) sum up the discussion on error propagation in remote sensing and GIS by
calling for:
•
Better documentation on remote sensing and GIS datasets; • Better sampling strategies for ground truth acquisitions;•
Practical uncertainty measures of remotely sensed and environmental data;• Better classification accuracy assessment methods.
The relative size of the accumulated error discussed above in multi-temporal datasets
in relation to the expected amount of land cover change, over the time frame of the dataset, is crucial to successful change detection. The amount of land cover change present and the small number of temporal sampling points4, in relation to the
accumulated errors, mean that only gross land cover changes can be reliably detected.
Two or three acquisition dates are the most common number. Eastman (1993) is an exception with monthly
time series of multi-spectral data over many years.
THEMA99M.WPD
---
----
---
---
--
--
---I
,
I
11
I'
I
I
C
I
I
I
I I
I
I
I
Chapter 2, Literature review
4.
C
o
nventi
onal clas
s
ificat
i
on o
f spat
i
al data
Conventional statistical classification techniques can perform poorly on spatial data
such as multi-spectral remotely sensed data. Spatial data's complexity,
heterogeneous nature, scale and spatial dependents are reflected in the complexity of
its spatial autocorrelation structure. This complexity makes the classification of
spatial data a difficult task.
As 1nany classical statistical assumptions (multi-variate normality and independence
of observations) are not valid with spatial data, there are few available conventional
statistical tools for spatial analysis. As an example, Henebry (1993) and Key et.al.
(1990) maintain that the deviation from Gaussian normality inherent in multi-spectral
data explains the low performance of GML classifiers. The problems experienced
when applying conventional statistical techniques to spatial data can be turned to an
advantage as demonstrated by geo-statistical techniques that use the inherent spatial
autocorrelation directly (Hohn, 1981 ).
The limitations of classical non-spatial statistics when applied to spatial problems
are compounded when the temporal dimension is added to spatial data. The
increased number of items in feature space requires more spectral classes for each
thematic class during training. It also requires larger samples of expensive ground
truth sites. All this increases the computational complexity considerably (Jeon &
Landgrebe, 1990). All the above has prompted the search for alternative
classification techniques including those borrowed from the AI community.
5
.
AI tools
fo
r
the cl
ass
i
ficati
o
n of multi-spectral data
The literature on AI and its application to remote sensing and GIS can be broken into
THEMA99M.WPD
I
I
!
i
,j
I
'111
I
I
I
I
ti
I
tll
:I
l
I
I
I
!1
Chapter 2, Literature review
four major sections: Decision support and expert systems; Neural networks and the
application of fuzzy logic; Genetic algorithms; and specific applications of AI
techniques in the remote sensing and GIS field.
Decision support and expert systems have been developed for the forestry industry
by many authors. These authors include Goldberg et.al. (1985), Skidmore (1989) and
Saarenmaa (1990). Leung (1990) applied expert systems to LIS/GIS. Fisher et.al.
(1988) reviewed a wide range of expert systems across several applied fields while
Estes et.al. (1986) and Wharton (1987) looked at the application of expert systems
to image processing.
Specific applications of AI to particular application areas include authors such as
Usery et.al. (1988) and Bonham-Carter (1994) with geological applications. Walker
& Moore (1988) and Stockwell et.al. (1990) applied AI to ecological modelling.
Drifting more towards the computer science side, Genetic algorithms have been
discussed by Riolo (1992) and Lawton (1992).
AI techniques with the specific focus of creating practical land cover classification
techniques have been explored by many authors. These include Estes et.al., (1986)
and Dambra et.al. (1991) who worked with data fusion, fuzzy logic and expert
systems. Similarly, Wyatt et.al. (1988) used AI techniques in vegetation
classification while Wilkinson & Megier (1990) used a combination of expert
systems and statistical techniques.
In a comprehensive overview of the application of AI to the classification of remote
sensing and GIS, Nagy & Swain (1987b) observed that the three areas of major
interest in the application of AI are the classification of land use, automated image
interpretation and the development of expert systems for decision support. They also
noted a drift away from traditional statistical classification towards AI techniques
because of their robustness and lack of assu1nptions concerning the underlying
THEMA99M. WPD
;
' 1. I
I
i I
' I
,,
I
I
J:
I
'1
!
I
j
I I
5
Chapter 2, Literature review
statistical distributions. However, the bulk of the recent published research is very
much application driven and as such was poor science (Nagy & Swain, 1987b ). They
noted that there was little discussion of the underlying scientific questions,
experimental design and little, if any, replication of experiments.
6.
The application of neural networks to land cover
classification
Many authors have applied neural networks to land cover classification with claimed
classification accuracies of 80% or more. These include Decatur (1989),
Benediktsson & Swain (1990), Benediktsson et. al. (1989, 1990a, 1990b, 1991), Key
et.al., (1989, 1989, 1990), Ritter & Hepner (1990), Hepner et.al., (1990), Beermann
& Khazenie (1990, 1992), Lee et.al., (1990), Maslanik et.al., (1990), Mulder &
Spreeuwers (1991a, 1991b), Liu & Xiao (1991), Kanellopoulos et.al., (1991), Kaifel
& Laher (1992), Bischof et.al. (1992), Blanda & Pasquariello (1992), Fitzgerald
(1991 ), Fitzgerald & Lees (1992a, 1992b, 1994a, 1994b), Civco (1991, 1993), Dreyer
(1993), Yin & Xu (1991) and Haas et.al., (1994).
Table 15 contains a sample of the published results of a number of neural network
based classifiers used for land cover classification. The classification categories have
been aggregated into 3 major land cover classes for comparison purposes. All of the
authors cited in Table 1 achieved consistently high classification results. The sample
sizes varied greatly. The neural network application used by Fitzgerald (1991) and
Fitzgerald & Lees (1992a, 1992b, 1994a, 1994b) used a training sample size at least
an order of magnitude smaller than all the cited authors in Table 1 to achieve
equivalent, or better results.
The contents of Table 1 are meant to be indicative, not exhaustive. The results quoted are those which were
easily and unequivocally obtained from the quoted papers.
THEMA99N. WPD
I
I
'I
I
I
I
I
I
11
I
:
I•
I
:I
I
u I
Chapter 2, Literature review
% classification accuracy Data
Authors Overall Water Forest Paddocks source
Fitzgerald - 3 class 99 100 99 100 ms
Fitzgerald - 9 class 51 100 39 100 ms
Fitzgerald - 1994b 57 99 43 96 ms
Benediktsson 52 98 43 29 ms
Ritter & Hepner 69 66 80 55 rs
Decatur 76 92 na 57 rs
Bischof 86 96 90 71 rs
Toe sources for table 1 are:
Fitzgerald(l991) and Fitzgerald& Lees (1994b), lxl spatial context
Benediktsson et.al. (1990a), table Vl-b, pg 549, mode I E Ritter & Hepner (1990), table 2, pg 879
Decatur (1989), table 2.1, pg i-285 Bischof et.al. ( 1992)
rs= remotely sensed data only, ms = multi-source data
Sample size%
0.5 0.5 0.5
1 1 39 5
4
Table 1: Comparison of selected published neural network land cover classification results
This thesis builds on the land cover classification studies carried out on the ANU
Kioloa dataset by Moore, Lees & Davey (1991 ), Lees & Ritman (1991 ), Fitzgerald
(1991) and Fitzgerald & Lees (1992a, 1992b ). The thesis extends these last studies
into the temporal domain. The neural network applications developed in the
Fitzgerald & Lees (1992a) study have performed better than most of the published
results cited in Table 1. The neural network application in Fitzgerald & Lees (1992a)
has also performed a more subtle classification of the entire Kioloa sub-scene in
comparison to the decision tree classifier of Lees & Ritman (1991 ).
Neural networks have shown promising results when incorporated into land cover
classifiers. They have the advantage of making no a priori assumptions about the
input data ( either data modelling parameters or assumptions concerning the
probability distribution) and create a posteri probabilities directly from the input data
using least squares methods (Blonda & Pasquariello, 1991 ).
The lack of a priori assumptions and the distribution-free nature of neural network
THEMA99N. WPD
:
I
I
~ I I
I
: !
I
I ' II
I
I
I I
I
I
,
,,,/ I
I
I
i
,,
''
·1
Chapter 2, Literature review
based classifiers makes them attractive candidates as tools for land cover
classification. Along with their non-linear character and pattern recognition
capabilities, ground breaking studies in the use of neural networks to produce land
cover classifiers have been carried out by a number of authors (Kaifel & Loher, 1992;
Benediktsson et.al., 1989, 1990a, 1990b, 1991, 1993; Benediktsson & Swain, 1990,
Hepner et.al., 1990; Fitzgerald 1991; Fitzgerald & Lees, 1992a, 1992b, 1994b;
Blonda & Pasquariello 1992; Key et.al., 1989, 1990; Khazenie & Crawford, 1989,
1990; Ritter & Hepner, 1990; Decatur, 1989; Bischof et.al., 1992).
7.
Multi-temporal land cover classification
The analysis of multi-temporal data is typified by the early work ofKauth & Thomas
(1976) on the Tasselled Cap. Most of the work in multi-te1nporal analysis using
remotely sensed data has concentrated on change detection in agricultural crops. The
works of Kaneko (1978), Haralick et.al. (1980), Badhwar (1984b ), Badhwar et.al.
(1982) and Mehrotra et.al. (1991) are samples of this literature.
The literature on multi-temporal change detection itself is vast. Some notable
contributors are Richards & Milne (1984), mapping regeneration of bush fire burns,
Naugle et.al. (1986), working on erosion analysis, and Blonda & Pasquariello (1992),
who used artificial intelligence techniques to detect change.
Multi-temporal change detection of land cover uses a variety of techniques. These
range fro1n the simple mechanism of image subtraction between dates (Green et.al.,
1994), visual map to map interpretation (Green et.al., 1994; Mehrotra et.al., 1991;
Marsh et.al., 1991), histogram matching techniques (Richards & Milne, 1984), GML
and regression techniques (Olsson, 1993; Conese & Maselli, 1991; Henebry, 1993;
Briggs & Nellis, 1991; Maracci & Aifadopoulou, 1990) to principal co1nponents
analysis (Eastman, 1992, 1993; Eastman & Fulks,1993; Byrne, 1980) and neural
THEMA99M.WPD