Risk assessment of deoxynivalenol
in high-risk area of China by human
biomonitoring using an improved
high throughput UPLC-MS/MS
method
Chunli Deng
1, Chenglong Li
1, Shuang Zhou
1, Xiaodan Wang
1, Haibin Xu
1, Dan Wang
1,
Yun Yun Gong
1,2, Michael N. Routledge
3, Yunfeng Zhao
1& Yongning Wu
1A risk assessment of deoxynivalenol (DON) was recently conducted for the residents in Henan province, China, where wheat as the staple food are highly consumed. A high-throughput sensitive UPLC-MS/ MS method following 96-well μElution solid-phase extraction (SPE) were developed and validated for the determination of DON biomarkers in human urine. Isotope labelled internal standard, 13C-DON, was used for accurate quantification. Urinary samples collected from 151 healthy Chinese aged 2–78 years were processed with and without enzyme hydrolysis to determine total and free biomarkers, respectively. DON, and de-epoxy-deoxynivalenol (DOM-1) to a lesser extent, can be frequently detected in these samples both with and without enzyme hydrolysis. Free DOM-1 was detected at low level in human urine for the first time. Total DON was detected in all samples with a mean concentration at 47.6 ng mL−1. The mean and median probable daily intakes (PDI) for the whole participants,
estimated to be 1.61 μg/kg bw and 1.10 μg/kg bw, both exceeded the PMTDI (1 μg/kg bw/day), indicating a potential risk for the residents in this area, especially for children and adolescents.
Deoxynivalenol (DON), belonging to the trichothecenes group produced by Fusarium spp. is one of the most prevalent mycotoxins1. Various crops are easily infested by these molds and thereby contaminated with DON,
which is responsible for gastro-intestinal problems in humans as well as other potential adverse effects on human health, including immunosuppression and impairment of reproduction and development2. In response, the Joint
FAO/WHO Expert Committee on Food Additives (JECFA) conducted a series of risk assessments and established a provisional maximum tolerable daily intake (PMTDI) of 1 μg/kg bw/day for the total amount of DON and its acetylated derivatives, 3-acetyl-deoxynivalenol (3ADON) and 15-acetyl-deoxynivalenol (15ADON)3. This led to
many countries setting maximum permitted levels for DON4.
After ingestion, DON undergoes a rapid metabolization to glucuronide conjugates, mainly DON-3-glucuronide (D-3-GlcA) and deoxynivalenol-15-glucuronide (D-15-GlcA)5. Additionally, a small proportion
of DON can be detoxified to DOM-1 by gut microbiota, which can also conjugate with glucuronic acid and be excreted in the urine6.
Humans and animals are exposed to DON by ingestion of contaminated food1. Assessment of human
expo-sure to mycotoxins is conventionally performed by analysis of food contamination levels and calculation of intake based on consumption data7–9. The heterogeneous distribution of mycotoxins in food may affect the accuracy of
these results, whereas a biomarkers-based strategy can provide a less biased measure of mycotoxin intake. A strong correlation has been demonstrated between the total DON (free DON together with DON-glucuronides) in urine and dietary DON intake in several studies5,10,11. DON biomarker analysis was
initi-ated by Meky et al., via the measurement of total DON after enzymatic deconjugation12 and further improved by
1China National Center for Food Safety Risk Assessment, Key laboratory of Food Safety Risk Assessment, Ministry of Health, Beijing, 100021, PR China. 2School of Food Science and Nutrition, University of Leeds, Leeds, LS2 9JT, UK. 3School of Medicine, University of Leeds, Leeds, LS2 9JT, UK. Correspondence and requests for materials should be addressed to S.Z. (email: szhoupku@gmail.com) or Y.Y.G. (email: y.gong@leeds.ac.uk)
Received: 21 November 2017 Accepted: 16 February 2018 Published: xx xx xxxx
inclusion of isotope internal standard correction13. Subsequently, a number of approaches for the determination
of DON biomarkers have been proposed for biological samples, involving gas chromatography-mass spectrom-etry (GC-MS)14–17, liquid chromatography-mass spectrometry (LC-MS)13,18–20, liquid chromatography-tandem
mass spectrometry (LC-MS/MS)6,21–24, and other rapid screening methods such as Fourier-Transform Infrared
Spectrometry25, fluorescence excitation-emission matrix26, and enzyme-linked immunosorbent assay (ELISA)27.
Among them, LC-MS/MS provides excellent accuracy, sensitivity and selectivity, and has become a preferred technique. Most of these studies focused only on DON, DOM-1 and their glucuronides. DON acetylated deriva-tives (3-A-DON and 15-A-DON), also known as masked DON28, were commonly not included in the biological
sample analysis, since these compounds could be digested to release DON in vivo. In these assays, solid-phase extraction (SPE) and immunoaffinity columns have been widely used for sample preparation, effectively reducing matrix interference and achieving a high increase in sensitivity. However, the labor-intensive and time-consuming steps of these conventional approaches present challenges to their further application in large-scale analysis.
To address such issues, we have developed a high-throughput UPLC-MS/MS method involving a 96-well μElution plate for the determination of total and free DON and DOM-1 in urine. This is the first application of μElution plate for DON biomarker analysis, which enables the simultaneous preparation of multiple samples without evaporation and reconstitution steps. Using this method, 151 urine samples collected from healthy vol-unteers in Henan province, China were evaluated for DON exposure.
Results
Method development and validation.
MS/MS conditions were optimized manually by individual infusions of each analyte standard. The detailed parameters for each analyte were optimized as summarized in Table 1. Waters CORTECS C18 UPLC column (2.1 mm × 100 mm, 1.6 μm) with methanol and water as mobile phase under a gradient elution provided a complete separation of the analytes as well as their analogs for a sin-gle run, as displayed in Fig. 1. It is noteworthy that formic acid and ammonium formate used as mobile phase additives resulted in a strong suppression of ionization and thereby worse signal intensity of DON and DOM-1. A high-throughput sample preparation strategy implementing a 96-well Oasis®
PRiME HLB μElution Plate was used for DON biomarker analysis. To improve recovery and selectivity, the detailed parameters associ-ated with loading, washing and elution buffer as well as the enzymatic hydrolysis process were optimized (see Supplementary Information, Table S1 and Figure S1). To our best knowledge, this is the first report that enables high-throughput analysis for DON biomarkers, allowing 96 urine samples (one plate) to be processed within 2 h with good extraction recoveries (88.3~112%) and well-controlled matrix interference (67.4~83.2%).Method validation was carried out as described in the Method section, following the recommendations of EMEA29 and US FDA30. The LOD and LOQ were 0.5 ng mL−1 and 1 ng mL−1, respectively for DON. For DOM-1,
Analyte Parent ion (m/z) Daughter ion (m/z) Cone voltage (V) Collision energy (eV)
DON 297.2 231.2 +36 +10
249.2a +36 +8
13C-DON 312.2 245.1 +20 +10
263.2a +20 +8
DOM-1 281.2 109.1 +26 +14
233.2a +26 +8
Table 1. MRM transitions of the analytes. aTransition used for quantification.
[image:2.595.155.363.46.137.2] [image:2.595.158.517.177.345.2]the LOD and LOQ were 0.1 ng mL−1 and 0.2 ng mL−1, respectively (Table 2). All analytes showed good linearity from their respective LOQ up to 100 ng mL−1, with correlation coefficients (R2) fell between 0.9920 and 0.9999. DON and DOM-1 displayed excellent method recoveries (RM) ranged from 80% to 112%. The inter-day and intra-day RSD were 3.8–12.5% and 3.2–13.3%. And no apparent carry-over was observed by injections of reagent blanks directly after high contaminated urine samples. A summary of validation parameters can be found in Table 2, all in accordance with the acceptance criteria.
Urinary DON biomarkers in the Chinese subjects.
The high-throughput strategy was implemented to monitor the occurrence of DON biomarkers in urine samples collected from 151 healthy volunteers in Henan province, China. The demographic characteristics of the subjects are shown in Table 3.Chromatograms of a human urine sample naturally contaminated with DON and DOM-1 are shown in Fig. 2. In the absence of the β-glucuronidase digestion step, 92.7% (n = 140/151) of samples were positive for free DON (fDON) and 2.0% (n = 3/151) were positive for free DOM-1 (fDOM-1). The mean level (range) of fDON was 8.25 (<LOD-47.0) ng mL−1. Free DOM-1 was quantified in only one sample at a low level of 0.23 ng mL−1. After
Analyte Spiked level (ng mL−1) Measured (ng mL−1) Method recovery (%)
RSDr
LOD
(ng mL−1) LOQ (ng mL−1)
Intra-day
(n = 6) Inter-day (n = 18)
DON
2 1.9 94 12.5 13.3
0.5 1
10 11.2 112 3.8 3.2
50 20.8 104 7.1 8.4
DOM-1
2 1.6 80 7.3 9.5
0.1 0.2
10 9.1 91 6.4 4.5
50 18.2 91 4.4 6.6
Table 2. Sensitivity, accuracy and precision of the developed method.
Variables Children Adolescents Adults elderly
Number of subjects 33 14 68 36
Male 2 2 34 18
Female 31 12 34 18
Age 6 ± 3 (2–12) years 15 ± 1 (13–17) years 40 ± 13 (21–64) years 72 ± 4 (66–81) years
Weight 25 ± 10 (12–50) kg 51 ± 8 (40–64) kg 70 ± 13 (45–95) kg 65 ± 11 (46–91) kg
Table 3. Characteristics of the subjects (mean ± SD (range)).
Figure 2. Chromatograms of a naturally contaminated urine sample before (left) and after (right)
[image:3.595.156.506.46.150.2] [image:3.595.155.553.311.522.2]enzymatic hydrolysis, urinary total DON (tDON) was quantified in 100% (n = 151/151) of the samples, with the mean value (range) of 47.6 (1.36–247) ng mL−1; and a detection rate (30.5%, n = 46/151) of total DOM-1 (tDOM-1) was obtained, at a mean level (range) of 0.28 (<LOD-6.43) ng mL−1 (Table 4). As can be seen, glucu-ronide conjugates are the main metabolites for both DON and DOM-1. It should also be mentioned that, DON acetylated derivatives (3-A-DON and 15-A-DON), known as masked DON were also measured in our study. The key experimental parameters were presented in Supplementary Information (Tables S2 and S3). However, neither of them was detected in 151 urine samples (both with and without enzyme hydrolysis), which provide further demonstration for the rapid digestion of 3-A-DON and 15-A-DON in vivo after ingestion.
The urinary tDON (free DON + DON-glucuronides) concentrations taken as biomarker for exposure to DON were further analyzed by gender and 4 age groups (0–12, 13–18, 19–65, and >65). The mean level of tDON was slightly higher in female (52.8 ± 56.5 ng mL−1) than in male (38.8 ± 32.2 ng mL−1), but the difference did not reach statistical significance (P = 0.475). All the 4 age groups were positive for DON and DOM-1. The mean levels of tDON were highest in children (age ≤ 12, 63.2 ± 52.6 ng mL−1) and adolescents (age 13–18, 73.1 ± 61.0 ng mL−1), with no significant difference (P = 0.664) between them. Urinary tDON was about 1.5-fold lower in adults (age 19–65, 45.1 ± 44.5 ng mL−1) than in children and adolescents (P < 0.05). The elderly group (age > 65, 27.8 ± 42.2 ng mL−1) had the lowest tDON levels (P < 0.01), as presented in Table 5.
Compound Positive n (%) Mean ((ng mL±−1SD) ) Median (ng mL−1) Range (ng mL−1)
fDON 140 (92.7) 8.25 (±8.74) 5.48 ND–47.0
tDON 151 (100) 47.6 (±49.2) 32.5 1.36–247
fDOM-1 3 (2.0) 0.052 (±0.015) 0.05 ND–0.23
tDOM-1 46 (30.5) 0.28 (±0.79) 0.05 ND–6.43
Table 4. Summary of free and total DON and it’s metabolites in 151 urine samples. ND, level below LOD; positive samples refer to the levels higher than LOD. When calculating the mean and median values, level below LOQ was set to half of the LOQ, and level below LOD was set to half of the LOD.
Compound
Positive Mean (± SD) Median Range
n (%) ng mL−1 ng mL−1 ng mL−1
Gender
Male, n = 56
tDON 56 (100%) 38.8 (±32.2) 29.8 3.11–132
fDON 49 (87.5%) 5.96 (±6.03) 4.25 ND–25.2
tDOM-1 14 (25.0%) 0.37 (±1.08) 0.05 ND–6.43
Female, n = 95
tDON 95 (100%) 52.8 (±56.5) 33.4 1.36–247
fDON 91 (95.8%) 9.60 (±9.78) 6.47 ND–47.0
tDOM-1 32 (33.7%) 0.22 (±0.54) 0.05 ND–3.49
Age
Age ≤ 12, n = 33
tDON 33 (100%) 63.2 (±52.6) 44.6 7.42–224
fDON 32 (97.0%) 11.3 (±10.5) 7.79 ND–47.0
tDOM-1 12 (36.4%) 0.16 (±0.25) 0.05 ND–1.05
12 < Age ≤ 18, n = 14
tDON 14 (100%) 73.1 (±61.0) 52.4 11.4–240
fDON 14 (100%) 13.0 (±10.8) 9.85 1.00–37.4
tDOM-1 5 (35.7%) 0.11 (±0.10) 0.05 ND–0.35
18 < Age ≤ 65, n = 68
tDON 68 (100%) 45.1 (±44.5) 29.8 3.31–213
fDON 65 (95.6%) 8.05 (±7.38) 5.79 ND–31.1
tDOM-1 21 (30.9%) 0.36 (±1.03) 0.05 ND–6.43
Age > 65, n = 36
tDON 36 (100%) 27.8 (±42.2) 10.98 1.36–247
fDON 29 (80.6%) 3.96 (±6.49) 2.48 ND–37.0
tDOM-1 8 (22.2%) 0.40 (±0.74) 0.05 ND–2.91
[image:4.595.155.363.46.114.2] [image:4.595.154.459.174.481.2]Discussion
Urinary DON levels comparison.
The present study was conducted for the residents in Henan province located in the central part of China, where wheat as the staple food, are consumed often at higher levels than in other provinces in China31. Accordingly, the average urinary concentration of tDON in the healthy subjects wasmuch higher than those from Shanghai (n = 60, 97% positive, mean 4.8 ng mL−1)20 and Yunnan (n = 4, 100%
positive, mean 12 ng mL−1) inhabitants12, and slightly higher than those of cancer patients in Henan province
(100% positive, mean 37 ng mL−1) in 200312. This reflected regional and temporal variability of DON exposure
in the Chinese population.
Moreover, the tDON values in this study were also higher than those reported in Bangladesh (n = 54, 52% positive, mean 0.86 ng mL−1; n = 62, 27% positive, mean 0.17 ng mL−1)21,22, Cameroon (n = 220, 73% positive,
mean 2.22 ng mL−1; n = 145, 43% positive, mean 5.93 ng mL−1)32,33, Egypt (n = 93, 68% positive, mean 1.11 ng/
mg creatinine)34, Nigeria (n = 120, 5% positive, mean 3.9 ng mL−1)35, Tanzania (n = 166, 51% positive, mean 2.5
ng mL−1)10, South Africa (n = 53, 100% positive, mean 20.4 ng/mg creatinine)36, Austria (n = 27, 59% positive,
mean 20.4 ng mL−1)37, France (n = 67, 99% positive, 0.5–28.8 ng mL−1)38, Germany (n = 50, 100% positive, mean
9.02 ng mL−1; n = 30, 100% positive, mean 7.15 ng mL−1; n = 101, 30% positive, mean 3.38 ng mL−1)22,39,40, Italy
(n = 52, 96% positive, mean 11.89 ng mL−1; n = 10, 70% positive, mean 3.7 ng mL−1)41,42, Spain (n = 54, 69%
positive, mean 23.3 ng/mg creatinine)16, Sweden (n = 29, 97% positive, mean 10.8 ng mL−1; n = 326, 90% posi-tive, mean 2.9 ng mL−1; n = 252, 73% positive, mean 5.38 ng mL−1)43–45, U.K. (n = 15, 100% positive, mean 13.5
ng mL−1; n = 25, 100% positive, mean 10.8 ng mL−1; n = 300, 99% positive, mean 8.9 ng/mg creatinine; n = 35, 100% positive, mean 11.6 ng mL−1; n = 34, 68% positive, mean 2.4 ng mL−1; n = 85, 100% positive, mean 10.3 ng/ mg creatinine)6,13,46–49 and Haiti (n = 142, 17% positive, mean 3.2 ng mL−1)23. On the other hand, the determined
tDON levels in the Chinese participants was lower than those in Belgian volunteers (n = 32, 100% positive, mean 59.0 ng mL−1)24 and pregnant women (n = 40) from Croatia (97.5% positive, mean 111.8 ng/mL, range 4.8–1238
ng/mg)50.
Urinary DOM-1 levels comparison.
Urinary tDOM-1 after β-glucuronidase hydrolysis was reported in the low ng mL−1 range in several studies6,16,22,24,34,39,45,49, whereas it was not detected in other surveys37,46. In ourstudy, tDOM-1 was detected in 30.5% of the samples, comparable with the prevalence of tDOM-1 in France (34%)38, Belgium (25%)24, Germany (40%; 50%)22,39 and UK (37% in 2012 and 40% in 2013)6, but apparently
higher than in Sweden (8%)45, Spain (3.7%)16, Egypt (2%)34 and another study in UK (3%)49.
Considering the occurrence of tDOM-1 in several previous studies, fDOM-1 in urine can also be anticipated. In our study, fDOM-1 was first evidenced in human urine, which was detected in 2.0% (n = 3/151) of the sam-ples. All the three samples were from male adults; their urinary tDON, tDOM-1 and fDOM-1 levels were 20.7 ng mL−1, 4.07 ng mL−1 and 0.22 ng mL−1, 42.0 ng mL−1, 6.43 ng mL−1and <LOQ, 32.2 ng/ml, 2.53 ng mL−1 and <LOQ, respectively. It is noteworthy that the three positive samples also shared high levels of tDOM-1 (ranked of 1st, 2nd and 7th), whereas their tDON levels were not remarkably high (ranked 58th, 77th and 100th). It is possible that these participants are more likely to detoxify DON to DOM-1 than others. This is the first demonstration of urinary free DOM-1 in humans.
Correlation between different urinary biomarkers.
Free DON levels were significantly corre-lated with the levels of tDON (Fig. 3a, r = 0.765, P < 0.001). On average 82.7% of the tDON was present as DON-glucuronides, in line with the recent findings in Austria (86%) directly quantifying DON, D-3-GlcA and D-15-GlcA37, and in UK (91.1%) comparing DON levels before and after β-glucuronidase hydrolysis49.Conjugation with glucuronic acid to DON-glucuronides appears to be a major route of DON detoxification and excretion. These results confirm that tDON is a more important urinary biomarker than fDON in reflecting the dietary DON exposure.
[image:5.595.156.552.47.190.2](35.3 ± 33.7 ng mL−1). In the 46 positive samples urinary tDOM-1 represented 3.17% (range 0.05–19.6%) of the amount of urinary tDON. Five samples among them possessed proportions of tDOM-1 (10.5–19.6% of tDON) higher than 10%.
Estimated dietary DON intake.
A probable daily intake (PDI) for DON could be estimated for the par-ticipants using equation (1), based on the urinary DON biomarker levels determined in this study and a urinary excretion rate published before5:= × ×
×
C V
W E
PDI 100 (1)
where C= total DON concentration (μg L−1), V= daily urine excretion (L), W= the individual body weight of each participant (kg), E= excretion rate (%).
A mean daily urine excretion was assumed to be 0.5 L for children and 1.5 L for adults51,52. An excretion rate of
68% (including 52% as DON-glucuronides and 16% as free DON)5 was used for the calculation. PDI calculated
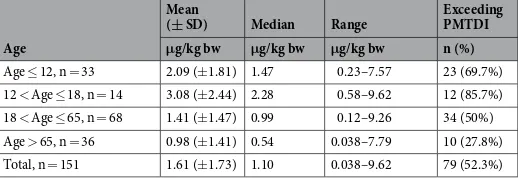
for DON ranged 0.038–9.62 μg/kg bw; and 79 of the 151 participants (52.3%) exceeded the PMTDI value set by JECFA (1 μg/kg bw/day)3. For the 4 age groups, children (2.09 ± 1.81 μg/kg bw) and adolescents (3.08 ± 2.44 μg/
kg bw) have the highest PDI, with no significant difference (P = 0.126) between them. The PDI of DON was lower (P < 0.05) for adults (1.41 ± 1.47 μg/kg bw) than for children and adolescents. The elderly group (0.98 ± 1.41 μg/ kg bw) had the lowest PDI (P < 0.01), as summarized in Table 6. Remarkably, the mean and median PDI for the entire cohort estimated to be 1.61 μg/kg bw and 1.10 μg/kg bw both exceeded the PMTDI, indicating a potential risk for the residents in Henan province, China. This could be partially attributed to the high consumption of cereals in this area.
This situation was similar for Croatia (mean 111.8 ng/mL)50 and Belgain (mean 59.0 ng mL−1)24, mean daily
intakes being 4.1 and 2.2 μg/kg bw/d respectively, exceeding the PMTDI. Especially in Croatia, nearly half of the subjects were estimated to exceed the PMTDI. On the contrary, most other studies around the world reported acceptable mean levels of tDON ranging from 0.2 to 20 ng/mL as mentioned above, corresponding to the daily intakes between 0.007 and 0.74 μg/kg bw/d, below the PMTDI value of 1 μg/kg bw/d.
Methods
Chemicals and materials.
Standard solutions of DON (100 μg mL−1), DOM-1 (50 μg mL−1), and 13C 15 -DON (10 μg mL−1) were purchased from Biopure (Tulln, Austria). Beta-glucuronidase (Type IX from E. coli) was from Sigma-Aldrich (MO, USA). LC-MS grade water, acetonitrile, methanol, formic acid and ammonia acetate were supplied by Fisher Scientific (Leicestershire, United Kingdom). All other chemicals and reagents used were of analytical grade or better. The Oasis PRiME HLB 96-well μElution plate (3 mg/30 μm) was product of Waters (Milford, MA, USA). A mixed standard containing 10 μg mL−1 of each analyte was prepared in ACN/H2O (50/50, v/v) and stored at 4 °C. Working dilutions of mixed standards were freshly prepared for each run in methanol/ H2O (20/80). The enzyme solution containing 2000 U mL−1β-glucuronidase was prepared in phosphate buffer (0.075 mol L−1, pH 6.8) freshly on each day of use.
Sample collection and storage.
Urine samples of 151 healthy volunteers aged 2–78 years (56 males, 95 females) were collected in Henan province located in the middle of China. For each person, morning urine sam-ples were collected on three consecutive days, immediately frozen stored at −70 °C. The urine from the three days were mixed at a 1:1:1 ratio to make one sample prior to DON biomarker analyses. The study was approved by the ethics committee of China National Center for Food Safety Risk Assessment, and all the methods were performed according to the approved guidelines and regulations. All the participants were completely informed of the pur-pose of this study, and the informed consents from the adult participants or parents on behalf of their children who participated the study were obtained.Preparation of calibration standards and quality control samples.
Serial calibration standard solu-tions at levels of 1, 2, 5, 10, 20, 50 and 100 ng mL−1 for each analytes were prepared by dilutions of the mixed standard solution (20 μg mL−1 of each compound). Each calibration standard solution contained 10 ng mL−1 of 13C15-DON as internal standard, which was used for quantification of DON. Quality control (QC) samples at levels of 2, 10 and 50 ng mL−1 were prepared by spiking analyte-free urine with mixed standard solutions. The QC samples were included in each batch of 80 samples, and their measured values should be within ±15% of the nominal values.
Age
Mean
(± SD) Median Range Exceeding PMTDI
μg/kg bw μg/kg bw μg/kg bw n (%)
Age ≤ 12, n = 33 2.09 (±1.81) 1.47 0.23–7.57 23 (69.7%)
12 < Age ≤ 18, n = 14 3.08 (±2.44) 2.28 0.58–9.62 12 (85.7%)
18 < Age ≤ 65, n = 68 1.41 (±1.47) 0.99 0.12–9.26 34 (50%)
Age > 65, n = 36 0.98 (±1.41) 0.54 0.038–7.79 10 (27.8%)
Total, n = 151 1.61 (±1.73) 1.10 0.038–9.62 79 (52.3%)
[image:6.595.157.416.47.136.2]Sample preparation.
Urine samples were thawed and centrifuged at 5000 × g for 15 min. Internal standard, 13C15-DON, was added to 1 mL supernatant at a final concentration of 10 ng mL−1, followed by a 2.5-fold dilution with phosphate buffer (75 mM, pH 6.8). A portion of 500 μL diluted sample was cleaned via Oasis
®
PRiME HLB μElution Plate (pre-conditioned with 200 μL methanol and 200 μL of water). After the loaded samples were slowly passed through under vacuum, the wells were washed with 200 μL of water to remove interference from urine matrix. Then the analytes were eluted twice with 100 μL each of methanol and diluted with 800 μL of water before the LC-MS/MS analysis. For the measurement of total DON and DOM-1, an enzyme digestion was added. 1 mL of the urine sample were first mixed with 1.5 mL phosphate buffer (75 mM, pH 6.8) containing 2000 Units of β-glucuronidase and incubated in a shaking water-bath at 37 °C for 18 h for digestion before the centrifugation.LC-MS/MS analysis.
Analysis was performed on an ACQUITY UPLC™
I-Class system (Waters, MA, USA) connected to a Xevo®
TQ-S tandem quadrupole mass spectrometer (Waters, MA, USA) equipped with an electrospray ionization (ESI) source. Chromatographic separation of DON biomarkers was achieved on a CORTECS™
UPLC®
C18 Column (2.1 × 100 mm, 1.6 μm, Waters, MA, USA). The mobile phase consisted of solvent A (water) and solvent B (methanol/acetonitrile, 80/20, v/v), running a gradient program as follow: 10% B at 0–1.5 min, 10–20% B at 1.5–1.8 min, 20% B at 1.8–7 min, 90% B at 7.1–8 min and 10% B at 8.1–9 min. The total run time was 9 min and the flow rate was set at 0.4 mL/min. The injection volume was 10 μL and the column temperature was maintained at 40 °C. MS/MS analysis in multiple reaction monitoring mode (MRM) was used to quantify DON biomarkers by reference to internal standard. Ion spray voltage was set to 3.0 kV in positive ionization mode. The MRM transitions, collision energies and cone voltages were optimized for each analyte as presented in Table 1. Other parameters were: source temperature, 150 °C; desolvation gas, nitrogen, 900 L h−1, 500 °C; cone gas, nitrogen, 150 L h−1; collision gas, argon, 0.15 mL/min.Method validation.
Validation in terms of linearity, specificity, accuracy, precision (intra and inter-day variability) and sensitivity (LOD and LOQ) were evaluated for DON biomarkers according to the guidelines defined by the European Medicines Agency (EMEA)29 and US Food and Drugs Administration (FDA)30. TheLOD (S/N = 3) and LOQ (S/N = 10) of the assay were determined using spiked urine samples at low levels. The linearity was assessed from a calibration curve on three consecutive days, using linear regression with 1/x weight-ing. The accuracy, expressed as the method recoveries (RM), as well as inter-day and intra-day precision were investigated at low (2 ng mL−1), medium (10 ng mL−1) and high (50 ng mL−1) spiking levels in blank urine in six replicates with internal standards correction.
Statistical analysis.
For statistical tests, undetectable DON biomarker concentration was set as half the value of their respective LOD51,53. The concentration data of DON biomarkers was natural log transformed fornormality, prior to analyses with independent sample t-test and ANOVA to determine the differences in urinary DON levels of different subgroups (age, gender). The concentration of total DOM-1 was non-normally distrib-uted even after logarithmically transformation. As a result, Pearson and Spearman tests were used separately to assess the correlations between total DON with free DON and total DOM-1. Statistical analysis was performed using SPSS, version 19 (SPSS, Chicago, IL, USA). A p-value <0.05 was considered as statistically significant.
Data availability.
The datasets generated during and/or analysed during the current study are available from the corresponding author on reasonable request.Conclusions
A high-throughput LC-MS/MS method was tested for the first time for urinary DON and DOM-1 analysis. The involvement of a 96-well μElution plate allowed the simultaneous preparation of 96 samples within 2 h, without the requirement of evaporation and reconstitution steps. The method, with significantly improved efficiency and accuracy, provides a powerful tool for large-scale population studies. With this method DON, and DOM-1 to a lesser extent, can be frequently detected in the Chinese urine samples both with and without enzyme hydroly-sis. Free DOM-1 was detected at low level in a small fraction of human urine for the first time. Total DON was detected in all samples with a mean concentration at 47.6 ng mL−1, higher than most populations previously studied. The PDI of children and adolescents estimated based on the biomarkers levels, were higher than the adults and elders. Over 50% of the population in study exceeded the PMTDI set by JECFA, indicating a potential health risk from DON exposure.
References
1. Pestka, J. J. Deoxynivalenol: mechanisms of action, human exposure, and toxicological relevance. Arch. Toxicol. 84, 663–679 (2010). 2. Pestka, J. J. & Smolinski, A. T. Deoxynivalenol: toxicology and potential effects on humans. J. Toxicol. Environ. Health Part B 8, 39–69
(2005).
3. WHO. WHO Technical Report Series. Evaluation of certain contaminants in food. 72nd Report of the Joint FAO/WHO Expert
Committee on Food Additives (JECFA), Geneva, Switzerland (2011).
4. FAO. Worldwide regulations for mycotoxins in food and feed in 2003. FAO Food and Nutrition paper No. 81. Food and Agriculture Organization of the United Nations, Rome, Italy (2004).
5. Warth, B., Sulyok, M., Berthiller, F., Schuhmacher, R. & Krska, R. New insights into the human metabolism of the Fusarium mycotoxins deoxynivalenol and zearalenone. Toxicol. Lett. 1, 88–94 (2013).
6. Gratz, S. W., Richardson, A. J., Duncan, G. & Holtrop, G. Annual variation of dietary deoxynivalenol exposure during years of different Fusarium prevalence: A pilot biomonitoring study. Food Addit. Contam. Part A 31, 1579–1585 (2014).
7. Beltrán, E. et al. Development of sensitive and rapid analytical methodology for food analysis of 18 mycotoxins included in a total diet study. Anal. Chim. Acta. 783, 39–48 (2013).
9. Sirot, V., Fremy, J. M. & Leblanc, J. C. Dietary exposure to mycotoxins and health risk assessment in the second French total diet study. Food Chem. Toxicol. 52, 1–11 (2013).
10. Srey, C., Kimanya, M. E., Routledge, M. N., Shirima, C. P. & Gong, Y. Y. Deoxynivalenol exposure assessment in young children in Tanzania. Mol. Nutr. Food Res. 58, 1574–1580 (2014).
11. Turner, P. C., Flannery, B., Isitt, C., Ali, M. & Pestka, J. The role of biomarkers in evaluating human health concerns from fungal contaminants in food. Nutr. Res. Rev. 25, 162–179 (2012).
12. Meky, F. A. et al. Development of a urinary biomarker of human exposure to deoxynivalenol. Food Chem. Toxicol. 41, 265–273 (2003).
13. Turner, P. C. et al. Dietary wheat reduction decreases the level of urinary deoxynivalenol in UK adults. J. Exposure Sci. Environ. Epidemiol. 18, 392–399 (2008).
14. Cunha, S. C. & Fernandes, J. Q. Development and validation of a gas chromatography–mass spectrometry method for determination of deoxynivalenol and its metabolites in human urine. Food Chem. Toxicol. 50, 1019–1026 (2012).
15. Rodríguez-Carrasco, Y., Moltó, J. C., Mañes, J. & Berrada, H. Development of a GC-MS/MS strategy to determine15 mycotoxins and metabolites in human urine. Talanta 128, 125-131 (2014).
16. Rodríguez-Carrasco, Y., Moltó, J. C., Mañes, J. & Berrada, H. Exposure assessment approach through mycotoxin/creatinine ratio evaluation in urine by GC-MS/MS. Food Chem. Toxicol. 72, 69–75 (2014).
17. Rodríguez-Carrasco, Y., Mañes, J., Berrada, H. & Font, G. Preliminary Estimation of Deoxynivalenol Excretion through a 24 h Pilot Study. Toxins 7, 705–718 (2015).
18. Brera, C. et al. Experimental study of deoxynivalenol biomarkers in urine. EFSA supporting publication, EN-818 (2015). 19. Razzazi-Fazeli, E., Böhm, J., Jarukamjorn, K. & Zentek, J. Simultaneous determination of major B-trichothecenes and the
de-epoxy-metabolite of deoxynivalenol in pig urine and maize using high-performance liquid chromatography–mass spectrometry. J. Chromatogr. B 796, 21–33 (2003).
20. Turner, P. C. et al. A biomarker survey of urinary deoxynivalenol in China: the Shanghai Women’s Health Study. Food Addit. Contam. Part A 28, 1220–1223 (2011).
21. Ali, N., Blaszkewicz, M., Nahid, A. A., Rahman, M. & Degen, G. H. Deoxynivalenol Exposure Assessment for Pregnant Women in Bangladesh. Toxins 7, 3845–3857 (2015).
22. Ali, N., Blaszkewicz, M. & Degen, G. H. Assessment of deoxynivalenol exposure among Bangladeshi and German adults by a biomarker-based approach. Toxicol. Lett. 258, 20–28 (2016).
23. Gerding, J. et al. A comparative study of the human urinary mycotoxin excretion patterns in Bangladesh, Germany, and Haiti using a rapid and sensitive LC-MS/MS approach. Mycotoxin Res. 31, 127–136 (2015).
24. Huybrechts, B., Martins, J. C., Debongnie, P., Uhlig, U. & Callebaut, A. Fast and sensitive LC-MS/MS method measuring human mycotoxin exposure using biomarkers in urine. Arch. Toxicol. 89, 1993–2005 (2015).
25. Bromovic, B., Igor, J., Abramovic, B., Cosic, J. & Juric, V. Detection of deoxynivalenol in wheat by fourier transform infrared spectroscopy. Acta Chim. Slov. 54, 859–867 (2007).
26. Fujita, K., Tsuta, M., Kokawa, M. & Sugiyama, J. Detection of deoxynivalenol using fluorescence excitation-emission matrix. Food Bioprocess Technol. 3, 922–927 (2010).
27. Lupo, A. et al. Validation study of a rapid ELISA for detection of deoxynivalenol in wheat, barley, malted barley, corn, oats, and rice. J. AOAC Int. 93, 600–610 (2010).
28. Vendl, O., Crws, C., MacDonald, S., Krska, R. & Berthiller, F. Occurrence of free and conjugated Fusarium toxins in cereal-based food. Food Addit. Contam. Part A 27, 1148–1152 (2010).
29. European Medicines Agency. Guideline on bioanalytical method validation. Available online: http://www.ema.europa.eu/docs/ en_GB/document_library/Scientific_guideline/2011 /08/WC500109686.pdf (2016).
30. Food and Drug Administration. Center for Veterinary Medicine (CVM) Guidance for Industry, Bioanalytical Method Validation (2001).
31. Wu, Y. N. & Li, X. W. The Fourth China Total Diet Study. Chemical Industry Press, Beijing, China (2015).
32. Abia, W. A. et al. Bio-monitoring of mycotoxin exposure in Cameroon using a urinary multi-biomarker approach. Food Chem. Toxicol. 62, 927–934 (2013).
33. Ediage, E. N., Di Mavungu, J. D., Song, S., Sioen, I. & De Saeger, S. Multimycotoxin analysis in urines to assess infant exposure: a case study in Cameroon. Environ. Int. 57, 50–59 (2013).
34. Piekkola, S. et al. Characterisation of aflatoxin and deoxynivalenol exposure among pregnant Egyptian women. Food Addit. Contam. Part A 29, 962–971 (2012).
35. Ezekiel, C. N. et al. Mycotoxin exposure in rural residents in northern Nigeria: a pilot study using multi-urinary biomarkers. Environ. Int. 66, 138–145 (2014).
36. Shephard, G. S. et al. Multiple mycotoxin exposure determined by urinary biomarkers in rural subsistence farmers in the former Transkei, South Africa. Food Chem. Toxicol. 62, 217–225 (2013).
37. Warth, B. et al. Assessment of human deoxynivalenol exposure using an LC–MS/MS based biomarker method. Toxicol. Lett. 211, 85–90 (2012).
38. Turner, P. C. et al. Determinants of Urinary Deoxynivalenol and De-epoxy Deoxynivalenol in Male Farmers from Normandy, France. J. Agric. Food. Chem. 58, 5206–5212 (2010).
39. Föllmann, W., Ali, N., Blaszkewicz, M. & Degen, G. H. Biomonitoring of mycotoxins in urine: pilot study in mill workers. J. Toxicol. Environ. Health Part A 79, 1015–1025 (2016).
40. Gerding, J., Cramer, B. & Humpf, H. U. Determination of mycotoxin exposure in Germany using an LC-MS/MS multibiomarker approach. Mol. Nutr. Food Res. 58, 2358–2368 (2014).
41. Solfrizzo, M., Gambacorta, L., Lattanzio, V. M. T., Powers, S. & Visconti, A. Simultaneous LC-MS/MS determination of aflatoxin M1, ochratoxin A, deoxynivalenol, de-epoxydeoxynivalenol, α and β-zearalenols and fumonisin B1 in urine as a multi-biomarker method to assess exposure to mycotoxins. Anal. Bioanal. Chem. 401, 2831–2841 (2011).
42. Solfrizzo, M., Gambacorta, L. & Visconti, A. Assessment of Multimycotoxin exposure in Southern Italy by urinary multi-biomarker determination. Toxins 6, 523–538 (2014).
43. Turner, P. C. Deoxynivalenol and nivalenol occurrence and exposure assessment. World Mycotoxin J. 3, 315–321 (2010).
44. Wallin, S. et al. Biomonitoring study of deoxynivalenol exposure and association with typical cereal consumption in Swedish adults. World Mycotoxin J. 6, 439–448 (2013).
45. Wallin, S. et al. Biomonitoring of concurrent mycotoxin exposure among adults in Sweden through urinary multi-biomarker analysis. Food Chem. Toxicol. 83, 133–139 (2015).
46. Hepworth, S. J. et al. Deoxynivalenol exposure assessment in a cohort of pregnant women from Bradford, UK. Food Addit. Contam. Part A 29, 269–276 (2012).
47. Turner, P. C. et al. Urinary deoxynivalenol is correlated with cereal intake in individuals from the United Kingdom. Environ. Health Perspect. 116, 21–25 (2008).
48. Turner, P. C. et al. A comparison of deoxynivalenol intake and urinary deoxynivalenol in UK adults. Biomarkers 15, 553–562 (2010). 49. Turner, P. C. et al. Assessment of deoxynivalenol metabolite profiles in UK adults. Food Chem. Toxicol. 49, 132–135 (2011). 50. Šarkanj, B. et al. Urinary analysis reveals high deoxynivalenol exposure in pregnant women from Croatia. Food Chem. Toxicol. 62,
51. Gong, Y. Y., shirima, C. P., Srey, C., Kimanya, M. E. & Routledge, M. N. Deoxynivalenol and fumonisin exposure in children and adults in a family study in rural Tanzania. World Mycotoxin J. 8, 553–560 (2015).
52. Haga, M. & Sakata, T. Daily salt intake of healthy Japanese infants of 3-5 years based on sodium excretion in 24-hour urine. J. Nutr. Sci. Vitaminol. 56, 305–310 (2010).
53. Heyndrickx, E. et al. Human biomonitoring of multiple mycotoxins in the Belgian population: Results of the BIOMYCO study. Environ. Int. 84, 82–89 (2015).
Acknowledgements
This work was supported by National Natural Science Foundation of China (31471671 and 31501400) and China Food Safety Talent Competency Development Initiative (CFSA 523 Program).
Author Contributions
C.L. Deng analyzed samples and processed data; C.L. Li assisted the experiment; C.L. Deng and S. Zhou developed the method, directed exposure assessment and drafted this manuscript; X.D. Wang and H.B. Xu collected samples; S. Zhou, Y.N. Wu and Y.Y. Gong conceived and designed this study; Y.F. Zhao and D. Wang directed the quality assurance; Y.Y. Gong and M.N. Routledge revised the manuscript.
Additional Information
Supplementary information accompanies this paper at https://doi.org/10.1038/s41598-018-22206-y. Competing Interests: The authors declare no competing interests.
Publisher's note: Springer Nature remains neutral with regard to jurisdictional claims in published maps and institutional affiliations.
Open Access This article is licensed under a Creative Commons Attribution 4.0 International License, which permits use, sharing, adaptation, distribution and reproduction in any medium or format, as long as you give appropriate credit to the original author(s) and the source, provide a link to the Cre-ative Commons license, and indicate if changes were made. The images or other third party material in this article are included in the article’s Creative Commons license, unless indicated otherwise in a credit line to the material. If material is not included in the article’s Creative Commons license and your intended use is not per-mitted by statutory regulation or exceeds the perper-mitted use, you will need to obtain permission directly from the copyright holder. To view a copy of this license, visit http://creativecommons.org/licenses/by/4.0/.