Influence of Lift to Drag Ratio on Optimal Aerodynamic
Performance of Straight Blade Vertical Axis Wind Turbines
Conaill Soraghan University of Strathclyde [email protected]
Prof. William Leithead University of Strathclyde [email protected]
Peter Jamieson GH Garrad Hassan [email protected]
Abstract:
This paper defines an effective lift to drag for a vertical axis wind turbine design based on averaged torque per cycle. This metric is used to characterise the relationship between overall optimum aerodynamic performance and design parameters. A double multiple streamtube aerodynamic prediction model is employed to demonstrate the effect of lift to drag ratio on optimal power performance for the H-rotor and the V-rotor concept VAWT. A further study looks at the effect of coning angle for the V-rotor.
Keywords: vertical axis wind turbines, aerodynamics, power performance.
1. Introduction
For a given blade number and chosen aerofoils, an optimum wind turbine rotor can, within limits, be designed for any desired tip speed ratio
(λ=ωR/ ). However, a specific λ related to these choices will result in an overall maximum power coefficient. This λ relationship is well documented for horizontal wind turbine (HAWT) design (see section 1.11 of [1]) and is clearly related to the maximum lift to drag ratio at each blade station of the chosen aerofoils. As a vertical axis wind turbine (VAWT) operates with intrinsically variable angle of attack in each cycle of rotation, the blade sections cannot operate at a fixed maximum lift to drag. This paper defines an effective lift to drag for a VAWT design based on averaged torque per cycle. This metric can then be used to characterise the relationship between overall optimum
[image:1.595.315.540.214.383.2]aerodynamic performance and design parameters.
Figure 1:The two classifications of straight blade VAWT that are investigated.
A double multiple streamtube aerodynamic prediction model is employed to demonstrate the effect of lift to drag ratio and solidity (σ = Nc/R) on optimal power performance for the H-rotor. A further study investigates the effect of lift to drag ratio and coning angle, γ, for the V-rotor.
Poor lift to drag ratio underpins some of the most significant disadvantages of VAWT technology and it makes transparent how VAWT designs could be improved. In addition to improving the
aerodynamic efficiency, increasing the lift to drag ratio would allow the turbine to operate at a higher λ and hence reduce the weight and cost of the drivetrain.
2. Aerodynamic Model
The cylindrical swept area is discretised into a mesh by dividing the blades into segments and separating the incident wind into independent streamtubes. The convention for angles and streamtube geometry follows Sharpe’s contribution to [4]. This formulation allows for streamtube expansion, a consequence of heavy loading caused by high solidity or high λ which leads to the airflow tending to manoeuvre around the turbine rather than through it.
Traditional actuator disk momentum aerodynamic prediction models use an iterative scheme to determine the induction factor, a. The model employed here instead adopts a graphical method that was devised by McIntosh and Babinsky [5] for use in a single actuator disk model and applies it in a double actuator disk model. The method is based on the idea that force of the wind on the blades transformed into the axial direction can be determined in two ways; using either momentum or blade element considerations. Both of these are functions of a because force on the blades
depends on how much energy is absorbed by the blades. Traditional iterative BEM schemes solve for an a where these two calculations for axial force balance. However, the onset of stall and flow reattachment can lead to multiple solutions and the significant benefit of the graphical method of [5] is that it identifies multiple solutions and successfully selects the correct a. Once an
induction factor for each streamtube disk has been calculated, the aerodynamic forces on that blade segment at that azimuthal position are completely defined. Total torque provided by the whole turbine is simply the sum of the individual torque
contributions from each azimuthal position. VAWTs have inherently complex aerodynamics due to the continuous changes in angle of attack and blade wake interaction downstream [6]. Two important complex phenomena are tip loss and dynamic stall. This investigation is concerned with idealized aerodynamic performance so both of these complex phenomena are disregarded.
3. Method
This section introduces the definition of effective lift to drag ratio for VAWTs. An explanation follows that outlines the investigations which explore the effect of lift to drag ratio on VAWT performance.
3.1 Effective lift to drag ratio
Actuator disk theory has previously been applied to determine the optimum performance of a VAWT in the specific case of an H-rotor with zero blade drag [7]. Newman found that using tandem actuator disks lead to optimum performance which exceeds the Betz limit by 8%. Current horizontal axis wind turbines attain a maximum power coefficient (Cpmax), exceeding 0.5, at an optimal λ (λopt) beyond 8. This is achieved by maintaining a lift to drag ratio between 100 and 120 with the present aerofoils preferred for large HAWT blades [1]. The Cpmax and λopt of a VAWT also depend on a lift to drag ratio but, because of the variation of angle of attack in each cycle of rotation, the relevant lift to drag ratio is an “effective” one which, unlike the HAWT design, is much lower than the maximum lift to drag ratio of the aerofoil section.
The effective lift to drag ratio for a VAWT is defined as follows. For a given turbine, the averaged torque per cycle is determined and an azimuthal position is found that produces an instantaneous torque equal to the averaged torque. The lift to drag ratio at this azimuthal position is selected as the indicative lift to drag ratio for that turbine. Dividing the total torque provided by the number of azimuthal positions determines an instantaneous torque that an azimuthal position must provide to be selected as the location to calculate effective lift to drag ratio. Once the indicative azimuthal position has been selected, the lift provided by the whole blade at that position is divided by the drag created by the whole blade. This is important because a V-rotor will exhibit variation in lift and drag along the blade.
reference provided; the infinite lift to drag ratio case has zero as all drag coefficients; the other six data sets are generated by amending each drag coefficient by one of the following amounts [-0.01, -0.005, +0.005, +0.01, +0.02, +0.05].
3.2 Effective lift to drag ratio
investigations
I. Influence of lift to drag ratio on H-rotor performance
The following procedure is followed to determine the optimal H-rotor turbine then investigate the impact of lift to drag ratio on optimal power performance. A swept area of 168m2 and the NACA0012 aerofoil data are used in all
comparisons. For a range of aspect ratios (L/R), the power coefficient is maximised over a range of solidities (Nc/R). This generates a theoretical idealized Cp-lamda curve. The effective lift to drag ratio, occurring at the optimal λ for a Cp-lamda curve, is indicative of that curve. Subsequently the aerofoil drag data is artificially altered by an incremental amount and the same procedure followed to generate a new ideal Cp-lamda curve for a different lift to drag ratio.
II. Influence of solidity on H-rotor performance
The subsequent investigation builds on the previous one by extending it to a range of turbine solidities. For each solidity in the range [0.12, 0.24] with an increment of 0.2, the steps from the previous investigation were followed and the set of optimal Cp and associated optimal λ are stored. Thus for each solidity, a pair (λopt, Cpmax) exists for each effective lift to drag ratio. Letting solidity vary leads to a family of these curves. This permits a concise demonstration of how effective lift to drag ratio and solidity affect optimal VAWT
aerodynamic performance.
III. Influence of coning angle on V-rotor performance
The V-rotor concept is inherently less
aerodynamically efficient than the H-rotor due to the coning angle, γ, measured from the vertical. The effect of γ on V-rotor power performance is investigated. The torque contribution per unit length from a V-rotor blade segment is
[ ( ) ( ) ] (1)
where r is local radius, W is effective wind speed at the blade segment and α is the angle of attack. For any particular lift to drag ratio and σ, the V-rotor will not be able to attain the same
aerodynamic efficiency as an H-rotor. The reason for this is that W has a component tangential to the aerofoil and an orthogonal component normal to the aerofoil. When γ is introduced, the normal component is reduced. This attenuates both W and α. This reduces the torque generated by reducing the lift generated and reducing the factor in equation (1).
The following optimization procedure is
undertaken to demonstrate the effect of lift to drag ratio and γ on optimal aerodynamic performance for the V-rotor concept. Lift and drag vary along the blade at every azimuthal position due to the variation in radius and the blade tip is selected for calculating both the effective lift to drag ratio and σ. For the chosen swept area of 168m2 the choice of radius at the root and γ dictate the length of the blades. Allowing γ to vary in the optimisation of rotor geometry would drive it to zero to resemble an H-rotor; therefore a coning angle of 30o was selected for the base case VAWT. An optimisation of turbine geometry to maximise Cp resulted in an extremely small L/R ratio with very short blades and instead a root radius of 4m was selected. Rotor solidity clearly plays a crucial role in VAWT aerodynamic performance, however the focus of this investigation is the effect of γ so c = 0.8m was selected for all simulations. This is the optimal solidity for the base case of γ = 30o.
4. Results
4.1 Influence of lift to drag ratio
on H-rotor performance
The first investigation is a demonstration of how aerodynamic performance varies for an H-rotor VAWT as effective lift to drag ratio varies. The dimensions of the rotor are provided in table 1.
Number of
blades Radius (m) Chord (m) Length (m) Blade
[image:3.595.309.547.685.732.2]3 7 0.3 12
Table 1: Optimal H-rotor
simulation attains a Cpmax of 0.39 at λopt of 4.75. The infinite lift to drag case attains Cpmax of 0.53 which is an increase of 36%. The lowest lift to drag case results in a very low Cp-λ performance curve with negative Cp up to λ=3 and Cpmax of only 0.13. The lift to drag ratio has a significant effect on the maximum Cp that can be attained by an H-rotor VAWT. Furthermore increasing the effective lift to drag ratio from 14 up to 130 increases λopt from 4 up to 4.75. It is clear that increasing the lift to drag ratio increases the optimal rotational speed.
Figure 2: Optimized power coefficient against tip speed ratio for H-rotor VAWTs for a range of lift to drag ratios.
The base case has no artificial alteration of the NACA0012 data.
One of the benefits of an investigation into lift to drag ratio is that it allows direct comparison with HAWT performance. An important observation is that the drag coefficients had to be reduced by 0.01 to attain an effective lift to drag ratio in the region of 120, the normal operating L/D for HAWTs [1]. This artificial reduction in drag
corresponds to a 50% decrease in the largest drag coefficient for all angles of attack lower than 10o.
4.2 Influence of solidity on
H-rotor performance
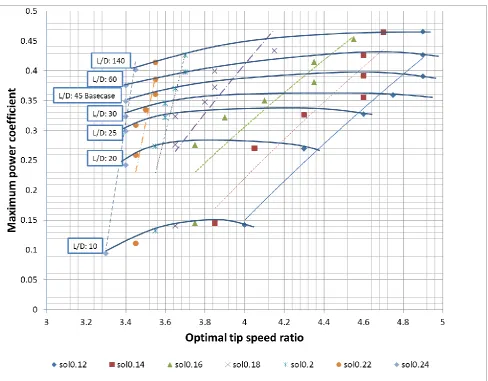
A key factor affecting wind turbine aerodynamic performance is rotor solidity. The relationship of solidity, lift to drag ratio and optimal aerodynamic
performance is presented in figure 3. Each data point is pair (λopt, Cpmax) for a specific σ and effective lift to drag ratio. The plot is parameterised by effective lift to drag ratio and linear trend lines are superimposed for each solidity.
The orientation of the curvature of the lines of constant effective lift to drag ratio indicate that there is an optimal solidity for each lift to drag ratio. With high drag (L/D 10) the Cpmax that can be attained is 0.15 at λ = 3.85 which occurs for σ = 0.13. As effective lift to drag ratio is increased, both λopt and Cpmax increase. However, the optimal solidity remains in the proximity of 0.13. When effective lift to drag ratio is unrealistically large for VAWTs (L/D 140) Cpmax attained is 0.47 at λopt = 4.9.
The variation in the gradient of the trend lines show that for lower solidities, λopt is more sensitive to effective lift to drag ratio.
4.3 Influence of coning angle on
V-rotor performance
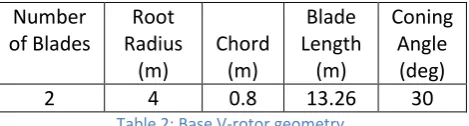
A similar procedure as the previous investigation is used to illustrate the effect of γ on V-rotor VAWT performance. The dimensions of the base rotor are provided in table 2.
Number
of Blades
Root
Radius
(m)
Chord
(m)
Blade
Length
(m)
Coning
Angle
(deg)
2
4
0.8
13.26
30
Table 2: Base V-rotor geometry
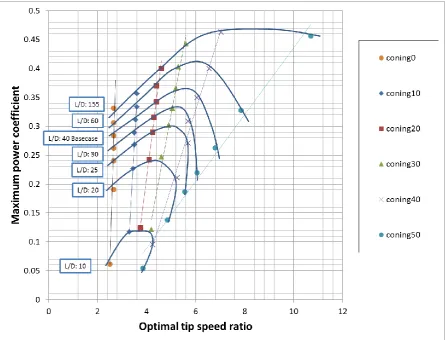
[image:4.595.313.548.457.520.2]At a low effective lift to drag ratio (L/D 10) Cpmax attained is 0.12 at λopt of 3.75 while operation with a high effective lift to drag ratio (L/D 155) can attain a Cpmax of 0.46 at λopt of 7.05. As before, increasing effective lift to drag ratio significantly increases the Cpmax that can be attained by a V-rotor. Moreover λopt at which the maximum in power coefficient occurs increases significantly when γ is increased. For the base case V-rotor operating in the base case effective lift to drag ratio, optimal performance occurs at λ = 6. This is relatively close to rotational speeds for HAWTs. The advantage of higher rotational speeds is that drive trains are lighter and hence cheaper. The gradients of the trend lines show that for higher γ, the value of λopt is much more sensitive to effective lift to drag ratio.
The maxima in the curves for constant effective lift to drag ratio suggest that there is an optimal γ.
However, this is simply a consequence of variable rotor solidity. Swept area and chord were kept constant as coning angle was varied. Accordingly rotor solidity decreased with increasing γ. The chord was selected to ensure optimal solidity for the base case. The base case with σ = 0.13 attains Cpmax of 0.39 at λopt of 4.75. It can be seen from figure 3 that an H-rotor with the same solidity has a much lower λopt and approximately 5% higher Cpmax.
5. Discussion
[image:5.595.55.544.76.457.2]between overall optimum aerodynamic performance and design parameters.
An investigation into the effect of lift to drag ratio on performance of a base case H-rotor revealed that the metric has a significant impact on maximum attainable power coefficient. Furthermore an increase in lift to drag ratio increased the optimal operating rotational speed by an incremental amount. Subsequently the effect of rotor solidity was examined. With the definition σ = Nc/R the optimal solidty for an H-rotor was found to be 0.13. This was found to be
independent of effective lift to drag ratio. Finally the influence of coning angle on V-rotor aerodynamic performance was analysed. This confirmed the significant impact of lift to drag ratio on peak power coefficient attainable. There was a much wider range in λopt as both coning angle and lift to drag ratio varied. Additionally, it was
demonstrated that an H-rotor with the same solidity as a V-rotor will operate optimally at a
much lower rotational speed and attain a higher power coefficient.
This work was supported by EPSRC Grant No. EP/G037728/1, Centre for Doctoral Training in Wind Energy Systems.