Edge Detection in SAR Images using Phase Stretch Transform
Christos V Ilioudis
∗, Carmine Clemente
∗, Mohammad H Asghari
†, Bahram Jalali
†and John J Soraghan
∗∗Center for Excellence in Signal and Image Processing, University of Strathclyde, Glasgow, UK Email: [email protected], [email protected], [email protected]
†Department of Electrical Engineering, University of California Los Angeles, Los Angeles, CA 90095, USA Email: [email protected], [email protected]
Keywords: Edge Detection; Phase Stretch Transform (PST); Synthetic Aperture Radar (SAR).
Abstract
In this work a novel approach to edge detection on Synthetic Aperture Radar (SAR) images is introduced. The proposed method uses an optics inspired transform which emulates the diffraction of an image through a medium with nonlinear dis-persive properties. The experimental results show that the out-put of the introduced Phase Stretch Transform (PST) in con-junction with further morphological operations can be effec-tively used for image edge detection.
1
Introduction
Edge detection is defined as the identification of patterns in an image correlated to abrupt changes of brightness or colour [1]. In image processing it is common for the results of edge de-tection to be post-processed and used for object dede-tection and classification [2]. Another use of performing edge detection on an image is reducing its size while preserving crucial informa-tion contained in it.
Optical and Synthetic Aperture Radar (SAR) imaging are used extensively in remote sensing. SAR imaging overcomes many disadvantages of optical as it can operate in almost every weather conditions both day and night. Additionally as some radar signals can partially penetrate the soil and vegetation, SAR images can also provide subsurface information. How-ever, SAR images are usually corrupted by speckle which re-duces its contrast and thus causing an impact on texture based analysis on the images [3]. Many speckle noise reduction tech-niques have been proposed [4]. Those techtech-niques can be ap-plied prior to edge detection to reduce speckle in the image. However this usually results in thick edges and low accuracy in edge localisation. Traditional algorithms such as Canny de-tector [5] are not suitable to address the edge detection problem due to the heterogeneous nature of SAR images. Thus it is re-quired for more specialised methods to be used.
Recent edge detection techniques can be classified in three main categories: methods based on the ratio of averages (ROA) of image intensities [6], methods based on Likelihood Ratio
(LR) [7] and methods based on wavelet analysis [8]. In this work a physics-inspired digital image transformation is em-ployed that emulates the propagation of electromagnetic waves through a diffractive medium with a dielectric function that has warped dispersive (frequency dependent) property [9]. In pre-vious work a similar approach has been employed for signal and SAR image compression [10], [11]. In later work and with some variations a new operation called Phase Stretch Trans-form (PST) was developed [9]. In [9] it was shown that the thresholded output of the PST along with further morphologi-cal operations can be used for edge detection. In this work an enhanced algorithm for SAR image edge detection based on the PST is introduced, while its performance is experimentally validated using real SAR images.
The remainder of the paper is organised as follows. In Sec-tion 2 the PST is introduced. The proposed edge detector de-sign is discussed in Section 3. Experimental results on real SAR images are presented in Section 4. Finally conclusions of this work are drawn in Section 5.
2
Phase Stretch Transform (PST)
The Phase Stretch Transform (PST) of a 2-D arrayB[n, m]is defined as:
A[n, m] =IFFT2{K˜[p, q]·FFT2{B[n, m]}} (1)
where n and m are the two dimensional spatial variables, A[n, m]is the output phase image,·is the angle operator,
FFT2andIFFT2are the 2-D Fast Fourier Transform and its inverse operation respectively,pandqare the two dimensional frequency variables, andK˜[p, q]is the phase kernel described by a frequency dependent phaseφ[p, q]as follows:
˜
K[p, q] = ejφ[p,q] (2)
Although there is no restriction on the applied phase kernel
˜
φ[p, q] =φpolar[r, θ] =φpolar[r] =S W ·r·tan−1(W ·r)−12ln
1 + (W ·r)2 W·rmax·tan−1(W ·rmax)−1
2ln (1 + (W ·rmax)2)
(3)
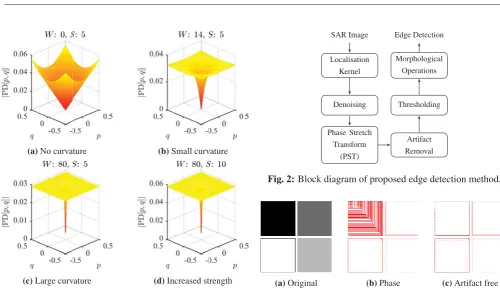
(a)No curvature (b)Small curvature
(c)Large curvature (d)Increased strength
Fig. 1: Phase derivative profiles comparison for four different kernels.
S andW in (3) are real numbers related to the Strength (S) and Warp (W) of the phase profile applied to the image. Those values will determine the phase derivative of the kernel and therefore the amount of phase applied to each frequency. In Fig. 1 four representative derivative profiles are illustrated along with their respectiveSandW values. As it can be seen in Fig. 1a choosing near zero value forWreturns a linear phase derivative profile. Increasing the value ofW will produce a small curvature on the kernel, while for very high values ofW the curvature increases even more as it can be seen in Fig. 1b and Fig. 1c respectively. Finally the value ofS scales the to-tal phase derivative profile as it can be seen comparing Fig. 1c and Fig. 1d. The way that those two parameters can be used to extract edges will be discussed in the next section.
3
Edge Detection Based on PST
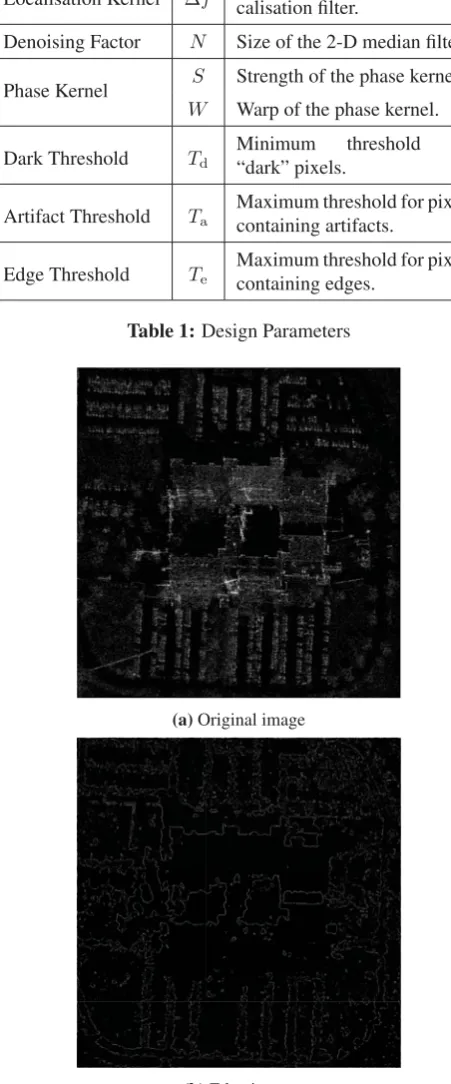
The different steps of the proposed edge detection method are shown in Fig. 2. In the first step the SAR image is smoothed by applying a localisation kernel. A Gaussian localisation fil-ter with variable bandwidth is used in this work. In the next step the smoothed image is denoised to reduce the undesired speckle noise. In this case a 2-D Median filter is applied. After-wards the denoised image is passed through the PST, which re-turns a phase image. The amount of phase applied to each pixel
SAR Image
Localisation Kernel
Denoising
Phase Stretch Transform
(PST)
Artifact Removal Thresholding Morphological
[image:2.595.41.542.111.401.2]Operations Edge Detection
Fig. 2:Block diagram of proposed edge detection method.
(a)Original (b)Phase (c)Artifact free
Fig. 3:Example of (a) a grayscale image with extended “dark” areas (black color) and the PST output phase image with the intensity of red color representing the inten-sity of the phase (b) including artifacts and (c) after removing the artifacts.
of the image is frequency dependent meaning that a higher amount of phase is applied to higher frequency features of the image. Since image edges contain higher frequency features, PST emphasises the edge information in the image by applying more phase to higher frequency features [9].
1 1 1
1 9 1
[image:3.595.304.555.80.249.2]1 1 1
Fig. 4:Kernel used to determine the number of “dark” neigh-bours surrounding a “dark” pixel.
“dark” neighbours which after the thresholding will result to a
3×3block of ones. After convolving the thresholded binary image with the given kernel, the examined centre pixel will have a value of9 + 8 = 17. It can be easily derived that for a pixel to be “dark” it must have a value equal or greater than
9(see centre element in kernel presented in Fig 4). If a value is greater than9then by abstracting9from the total value, the number of “dark” neighbours can also be found. Therefore, in the resulted from the convolution image a new threshold can now be applied that will determine if a pixel is “dark” and if it has enough “dark” neighbours to not contain edge informa-tion. This threshold must be at least9to ensure that the exam-ined pixel is “dark” while higher values will determine the least number of “dark” neighbours that the pixel must have to not be an edge. Using the resulting binary image as a mask we force the selected pixels in the phase image to have minimum phase (−π) and as a result clear the artifacts(compare the inside of the top left square in Fig. 3b and Fig. 3c). The resulting image is finally thresholded and morphologically filtered in order to form the edges. In this work four morphological operations are used. First an edge thinning is performed on the binary image [12]. Then a perimeter calculation using 4-connected neighbourhood is applied [13]. Isolated pixels removal is also performed where individual ones that are surrounded by zeros are removed [12]. Finally object outlining is applied by setting a pixel to zero if all its 4-connected neighbours are one [12]. The parameters of the proposed design are summarised in Ta-ble 1. The parameterΔf defines the width of the Gaussian filter applied and therefore the frequencies that PST will later be applied on. The parameterN defines theN-by-N neigh-bourhood window of the 2-D Median filter applied to denoise the image from speckle noise. Higher values ofN will result to better noise reduction but will blur the image and loose res-olution in exchange. The strength (S) and wrap (W) of the phase kernel will determine its phase derivative profile. In principle, values ofW resulting in medium warp have better noise performance, while large values ofS provide less edge noise, but also reduce the resolution [9]. The dark threshold Tddetermines the intensity above of which a pixel in the de-noised image is considered “dark”. For convenience Td will be expressed as a percentage of the maximum intensity in the image. The artifact thresholdTacontrols the minimum num-ber of “dark” neighbours that a “dark” pixel must have not to be considered as an edge and therefore may contain only arti-facts. Finally the edge threshold Te sets the minimum phase that a pixel must have to be considered as an edge.
Localisation Kernel Δf Bandwidth of the Gaussian lo-calisation filter.
Denoising Factor N Size of the 2-D median filter.
Phase Kernel S Strength of the phase kernel. W Warp of the phase kernel.
Dark Threshold Td Minimum“dark” pixels.threshold for
Artifact Threshold Ta Maximum threshold for pixelscontaining artifacts.
[image:3.595.309.535.98.641.2]Edge Threshold Te Maximum threshold for pixelscontaining edges.
Table 1:Design Parameters
(a)Original image
[image:3.595.346.509.277.647.2](b)Edge image
Fig. 5:Edge detection performance of the proposed technique on a sample from the Coherent Change Detection Chal-lenge data set, (a) Original sample, (b) Detected edges using the proposed method with parameters: Δf =
4
Experimental Results
In this section the performance of the method proposed in Section 3 is experimentally evaluated. For the experimental results two datasets were used. First the proposed technique is applied on the X-band data from the Coherent Change Detection Challenge dataset acquired by the AFRL [14]. The data are in the form of focused complex images with range and cross-range resolution of 0.3 m and with the original size of the image being 4501×4501pixels. The proposed method was also applied in C-band data from the Vancouver, BC dataset included in RADARSAT-2 sample dataset [15]. In this case the original size of the image is5954×7930pixels and has a cross-range resolution of3m. In this work only one acquisition from each dataset is utilised using the intensity of the SAR image to form a gray-scale image. Additionally due to the large size of the original images, smaller samples are used for edge detection.
The performance of the proposed method in the CCDC data set is illustrated in Fig. 5. As it can be seen in Fig. 5a the original image does not suffer from high level of white noise and therefore a large value of Δf = 1.8 is used for small smoothing in the image. Moreover a median filter ofN = 12 is applied to reduce the high speckle noise. The values of strength and wrap are tuned atS= 5andW = 14to provide good resolution along with edge noise reduction. The dark threshold is set at Td = 3.3% of the maximum intensity while the artifact threshold is Ta = 16 implying that only “dark” pixels with all their neighbours being “dark” will be masked for artifact removal. Finally the edge threshold is set atTe= 0.2. The resulting edge image is illustrated at Fig. 5b. As it can be seen the proposed method is able to extract most of the edges in good resolutions while removing most of the noise.
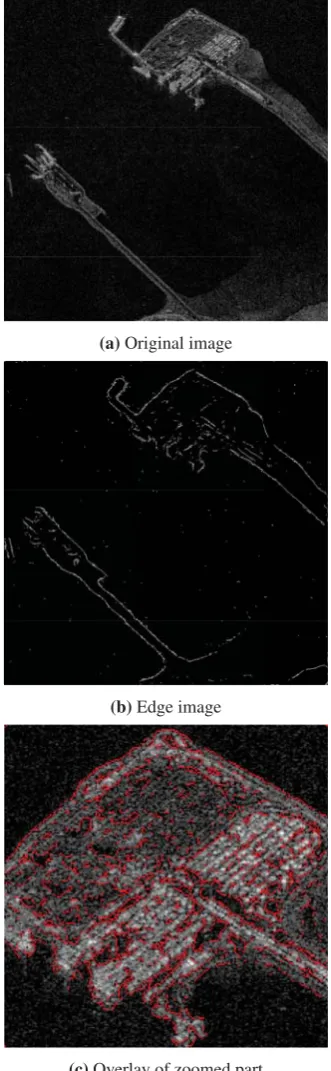
[image:4.595.343.509.82.619.2]The performance of the proposed method in the Vancouver, BC dataset is illustrated in Fig. 6. The original image is shown in Fig. 6a. In contrast with the CCDC dataset here the image suffers from high levels of white noise. For this reason a smaller bandwidthΔf = 0.12is used to smooth the image. A median filter ofN= 14is applied to reduce the speckle noise. In the PST kernelS = 0.7andW = 10are used to provide better resolution in exchange of higher edge noise. The dark threshold is set atTd= 3.3%of the maximum intensity while the artifact threshold isTa = 16. Finally the edge threshold is set atTe = 0.2. The resulting edge image is illustrated at Fig. 6b. It is noted that while this image is more challenging from the one presented in Fig 5 due to the presence of the sea, the proposed method can still extract most of the edges while keeping the noise levels low. Furthermore in Fig. 6c an overlay of a smaller part of the sample image with the detected edges is illustrated. In this case different setting are used to provide more details for the smaller area. The bandwidth is set atΔf = 0.2and the size of the median filter isN = 5so more details can be preserved. For the PST kernelS = 0.7 andW = 10 are used to provide finer resolution. The dark threshold is set atTd = 33%. The reason thatTdis set much
(a)Original image
(b)Edge image
(c)Overlay of zoomed part
Fig. 6:Edge detection performance on a sample from the Van-couver, BC dataset(a) Original sample, (b) Detected edges using the proposed method with parameters:
higher than previously is to also remove the parts of the image were the sea is located at and therefore remove its noise along with the artifacts. It should be mentioned that here theTdis used mainly as a morphological operation since the artifacts appear in pixels with much lower intensities. Finally the artifact threshold and the edge threshold are set at Ta = 16 andTa = 0.008respectively. Considering Fig. 6c, it can be observed that more details can be preserved, while removing completely the noise from the sea areas.
5
Conclusion
In this paper an algorithm for edge detection in SAR images has been introduced. This method uses a digital image trans-form originated from optics, which emulates the propagation of electromagnetic waves through a diffractive medium with nonlinear dispersive properties. It is shown that the imple-mented Phase Stretch Transform (PST) can achieve good per-formance in detecting the edge of an image. The algorithm reduces the noise effects and removes image artifact, while Phase Stretch Transform (PST) emphasises the edge informa-tion applying more phase to higher frequency features. As a consequence the edge detection of the provided image can be effectively improved. Experimental results demonstrate that thresholding and further morphological operation leads to the edge extraction despite the noise presence into the provided image. The high-accuracy edge detection has been tested and verified experimentally using two real datasets.
Acknowledgment
This work was partially supported by the Engineering and Physical Sciences Research Council (EPSRC) Grant number EP/K014307/1 and the MOD University Defence Research Collaboration in Signal Processing and partially supported by the Office of Naval Research (ONR) MURI program on Opti-cal Computing.
References
[1] D. Marr and E. Hildreth, “Theory of edge detection,” Proceedings of the Royal Society of London B: Biologi-cal Sciences, vol. 207, no. 1167, pp. 187–217, 1980.
[2] R. C. Gonzalez, R. E. Woods, and B. R. Masters, “Dig-ital image processing,” Journal of Biomedical Optics, vol. 14, no. 2, p. 9901, 2009.
[3] R. K. Raney, “Radar fundamentals: technical perspec-tive,” Principles and applications of imaging radar, vol. 2, pp. 9–130, 1998.
[4] M. Mansourpour, M. Rajabi, and J. Blais, “Effects and performance of speckle noise reduction filters on active radar and sar images,” inProc. ISPRS, 2006, pp. 14–16.
[5] J. Canny, “A computational approach to edge detection,” Pattern Analysis and Machine Intelligence, IEEE Trans-actions on, vol. PAMI-8, no. 6, pp. 679–698, Nov 1986.
[6] R. Touzi, A. Lopes, and P. Bousquet, “A statistical and geometrical edge detector for sar images,”Geoscience and Remote Sensing, IEEE Transactions on, vol. 26, no. 6, pp. 764–773, Nov 1988.
[7] C. Oliver, D. Blacknell, and R. White, “Optimum edge detection in sar,” Radar, Sonar and Navigation, IEE Proceedings -, vol. 143, no. 1, pp. 31–40, Feb 1996.
[8] P. S. Prasad, B. P. Rao, and P. Chandrasekhar, “En-hanced edge detection technique for sar images,” In-ternational Journal of Computer Applications, vol. 77, no. 1, pp. 6–10, 2013.
[9] M. H. Asghari and B. Jalali, “Edge detection in digi-tal images using dispersive phase stretch transform,” In-ternational journal of biomedical imaging, vol. 2015, 2015.
[10] M. Asghari and B. Jalali, “Anamorphic time stretch transform and its application to analog bandwidth com-pression,” inGlobal Conference on Signal and Informa-tion Processing (GlobalSIP), 2013 IEEE, Dec 2013, pp. 1013–1016.
[11] M. Asghari, C. Clemente, B. Jalali, and J. Soraghan, “Synthetic aperture radar image compression using dis-crete anamorphic stretch transform,” inSignal and In-formation Processing (GlobalSIP), 2014 IEEE Global Conference on, Dec 2014, pp. 345–349.
[12] MathWorks, “Morphological operations on binary images,” http://uk.mathworks.com/help/images/ref/ bwmorph.html, Accessed at: 2015-08-13.
[13] MathWorks , “Perimeter of objects in binary image,” http://uk.mathworks.com/help/images/ref/bwperim. html, Accessed at: 2015-08-13.
[14] S. M. Scarborough, L. Gorham, M. J. Minardi, U. K. Majumder, M. G. Judge, L. Moore, L. Novak, S. Jaroszewksi, L. Spoldi, and A. Pieramico, “A chal-lenge problem for sar change detection and data com-pression,” inSPIE Defense, Security, and Sensing. In-ternational Society for Optics and Photonics, 2010, pp. 76 990U–76 990U.