Residential exposure to solar ultraviolet radiation and incidence of childhood
hematological malignancies in France
Astrid Coste1, Stéphanie Goujon1,2, Mathieu Boniol3, Fabienne Marquant1, Laure Faure1,2, Jean-François Doré4, Denis Hémon1, Jacqueline Clavel1,2
1
Epidemiology and Biostatistics Sorbonne Paris Cité Center (CRESS), INSERM, UMR 1153, Epidemiology of childhood and adolescent cancers research group (EPICEA), Paris Descartes University, F-75014 Paris, France
2
French National Registry of Childhood Hematological Malignancies (NRCH), Villejuif, France
3
University of Strathclyde Institute of Global Public Health at iPRI, International Prevention Research Institute, Lyon, France
4
Cancer Research Center of Lyon (CRCL), INSERM UMR 1052 CNRS 52B6, Centre Léon Bérard, 28 rue Laënnec, F-69373 Lyon Cedex 08, France
Abbreviations:
UV: ultraviolet; CHM: childhood hematological malignancies; AL: acute leukemia; ALL: acute lymphoblastic leukemia; AML: acute myeloid leukemia; PBC-ALL: precursor B-cell acute lymphoblastic leukemia; NHL: Non-Hodgkin’s lymphoma; HL: Hodgkin’s lymphoma
Key words: ultraviolet radiation; sun exposure; children; hematological malignancies
Correspondence:
Astrid Coste, PhD student, Epidemiology of childhood and adolescent cancers research group (EPICEA), Epidemiology and Biostatistics Sorbonne Paris Cité Center (CRESS), INSERM, UMR 1153, Paris Descartes University, F-75014 Paris, France, Tel:+33145595292, Fax: +33145595151, E-mail:astrid.coste@inserm.fr
2/22
Abstract 246 Words
Purpose Few studies have investigated the relationship between solar ultraviolet radiation (UV) and childhood hematological malignancies (CHM). This study addresses the associations between residential UV exposure at diagnosis and the incidence of types and subtypes of CHM, by age and gender, in France, over a long period, on the fine scale of the 36,326 Communes that constitute mainland France. Methods The 9,082 cases of acute leukemia (AL) and 3,563 cases of lymphoma diagnosed before the age of 15 years from 1990 to 2009 were provided by the French National Registry of Childhood Hematological Malignancies. The incidence of CHM was calculated by
Commune, year, age and gender and expressed as the standardized incidence ratio (SIR). UV data from 1988 to 2007 were extracted from the EUROSUN database. Results The annual daily average UV exposure of the children ranged from 85.5 to 137.8 J/cm2. For each additional 25 J/cm2 there was a significant increase in precursor B-cell acute lymphoblastic leukemia (PBC-ALL) in children aged less than 5 years (SIR: 1.18; 95%CI: 1.10-1.27). Further analysis of PBC-ALL in the young children suggested a better fit of models with a threshold, with the risk increasing above 100 J/cm2, for which the SIR was 1.24 (95%CI: 1.14-1.36) for a 25 J/cm² increase. The results remained stable in analyses stratifying by deprivation index or degree of urbanization of the Communes. Conclusion The study suggests that higher residential UV exposure may be positively associated with a higher incidence of PBC-ALL in early childhood.
I. Introduction
Acute leukemia (AL) and lymphoma are the most frequent childhood hematological malignancies (CHM). Several genetic diseases and polymorphisms[1], and non-genetic exposures (including ionizing radiation and, for Hodgkin’s and Burkitt’s lymphoma, Epstein Barr virus) are known risk factors. Some factors related to early immune stimulations and environmental exposures (pesticide use at home and, for AL, extremely low frequency electromagnetic fields) are also suspected[2, 3]. Solar ultraviolet (UV) radiation, UVA (315 - 400 nm) and UVB (280 - 315 nm), exposures are ubiquitous with marked gradients within and between countries.
Solar UV radiation, a known risk factor for skin cancers[4], plays a role in vitamin D synthesis and, through this mechanism, has also been identified as a potential protective factor for some cancers[5, 6]. UV radiation, especially UVB radiation, may also induce systemic immune suppression. Animal study findings have raised the question of whether UV radiation may influence the development of hematological malignancies by means of its immunosuppressive effect[7–9].
subtypes: ‘lymphoid leukemia’ and ‘other malignant neoplasms of lymphoid and histiocytic tissue’[21].
To the authors' knowledge, four studies, with different designs and sample sizes, on the association between childhood hematological malignancies and UV radiation exposure have been published. Three studies found a negative association, for leukemia [22,24] and/or NHL [23,24], while the fourth study [25] showed an increased risk of lymphoblastic leukemia in 2-4-year-old children during the light season (April-September).
In that context, the objective of the present study was to analyze the association between population exposure to UV radiation and the incidence of types and subtypes of CHM, over a long time period.
II. Materials and Methods
The association between the UV exposure of the subjects' places of residence at the time of diagnosis and the incidence rates of CHM was studied. For this purpose, quantitative estimates of average annual exposures to UV radiation for the 1988-2007 period of the 36,326 French Communes, the smallest administrative subdivisions of the country, were associated with the incidence data of the corresponding Communes of France by year, age and gender.
Cases, time period, geographic units and population counts
The CHM cases were provided by the French National Registry of Childhood Hematological Malignancies (NRCH)[26]. Since 1990, the registry has included all the malignant or borderline hematological diseases occurring in children aged less than 15 years residing in mainland France at the time of diagnosis. For each case, the registry provided the date of birth, date of diagnosis and address where the child was living at the time of diagnosis. All the CHM cases diagnosed between 1990 and 2009 and having a known residential Commune at diagnosis were included (99.9% of the cases). For the study period (1990-2009), 9,082 cases of AL and 3,563 cases of lymphoma were included.
An incidence study was performed at the Commune level over the study period. The cases consisted in all children diagnosed with AL or lymphoma before the age of 15 years and registered in the NRCH during the period. The annual national CHM incidence rates estimated by the NRCH, by age and gender, were used as reference rates. The annual estimates of the Commune populations, by year of age and gender, were provided by the French National Institute for Statistics and Economic Research (INSEE) for the census years: 1990, 1999, 2006, 2007, 2008 and 2009. For the other years, the estimates for the Communes were interpolated using the annual estimates provided by INSEE for the 96 French mainland Départements (larger administrative units with an average of 360 Communes per
Département).
UV radiation exposure at the time of diagnosis
4/22
Commune was therefore the daily average UV (UVA+UVB) radiation exposure over the period 1988-2007.
Statistical analysis
All analyses were implemented with SAS v9.3 software.
The standardized incidence ratio (SIR) was used to characterize the spatial differentials of incidence over the study period. The SIR was calculated as the ratio of the observed number of cases to the corresponding expected number of cases obtained from the Commune numbers of at-risk person-years (PY), by age (1 year) and gender, and the national annual age- and gender-specific incidence rates.
Poisson regressions were fitted for all the analyses using the Communes of residence at diagnosis as the basic statistical unit, with their expected number of cases (Ei) as the offsets and observed number of cases (Oi) as the observations. As most of the analyses which were performed on this small scale led to under-dispersion, Communes were grouped using the decile of the covariate of interest. Since there were no prior hypotheses with regard to the shape of the relationship between leukemia or lymphoma incidence and sun exposure, two models were compared using the log-likelihood test to determine the degree of adequacy of a log-linear association. In the first model, the UV radiation exposure variable was qualitative and categorized to obtain UV radiation based geographic zoning, which consisted of 10 groups of Communes (“deciles”) Dk, k=1,…,10 with equal pediatric populations (0-14 years):
, In which:
- E(Ok) is the expected value of the observed number of cases (Ok) in decile Dk of the Communes, and Ek is the expected number of cases,
- Xh is an indicator variable with a value of 1 for decile Dh and 0 for the other deciles, and ßh is the corresponding regression coefficient.
For the second model, a semi-quantitative discrete UV radiation variable was built:
,
in which is the pediatric population weighted average value of the UV radiation exposure in decile Dk . In this model, estimated the SIR variation with an increase of 1 UV radiation unit. In this
study, one UV radiation unit is equal to an increase of 25 J/cm², which is about half of the UV radiation range for the Communes.
A value of the deviance/degrees of freedom ratio greater than 2 was considered to indicate an over-dispersed model. In the event of over-dispersion that was not explained by a more adequate model, a negative binomial error was used instead of the Poisson error.
Considering the shape of some of the associations between and the SIR, even when log-linearity was not formally rejected, a model with a segmented linear regression with one change point ( ) was also fitted to some observed CHM counts:
in which is the pediatric population weighted average value of the UV radiation exposure in the decile, Dk, is the positive part of which takes the value zero if ≤ and ( - ) otherwise. In order to determine whether there was convincing evidence of a change point and determine the best change point, segmented linear regressions were fitted to the observations with values of every 2 J/cm² and the AIC criterion was used to identify the best model.
The regression models included no term of spatial autocorrelation even though exposures to UV are spatially correlated, since previous analyses of the data had not shown any spatial auto-correlation between CHM rates in France[28–30].
Analyses were performed by type and subtype of CHM, by age group and gender. The study had a statistical power of 80% for underlying exact SIR less than 0.85 or greater than 1.15 for most types of CHM with a two-sided Poisson test at the 5% level for a general pediatric population exposure frequency of 10%.
The stability of the results was first assessed by examining their consistency across three time periods (1990-1996, 1997-2003, 2004-2008) and five large geographic subdivisions of France (Paris area, North-West, North-East, South-East, South-West).
In order to account for potential confounding or effect modification, analyses were repeated after stratification by, or adjustment for, the urban status and socio-demographic characteristics of the
Communes extracted from the 1999 census data. The French deprivation index FDep99[31] was defined as the first component (68% of the total variation) of a principal component analysis of four census variables: median income of the households, proportion of blue-collar workers, proportion of unemployed and proportion of baccalaureate (high school diploma) holders.
In a parallel analysis, the correlation between Commune sun exposure at birth and at diagnosis was estimated with data from two national population-based case-control studies conducted by the authors' team. The ESCALE study was conducted between 2003 and 2004 and included 763 AL cases and 1,681 controls [32]. The ESTELLE study was conducted between 2010 and 2011 and included 747 AL cases and 1,421 controls [33].
III. Results
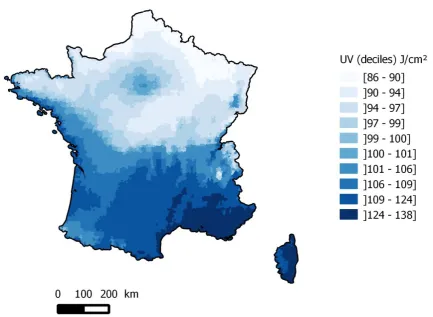
UV (UVA+UVB) radiation exposure varied between 85.5 and 137.8 J/cm² with a median of 100.2 J/cm². A clear north-south gradient of UV radiation exposure was observed, together with locally slightly higher UV radiation exposures in the Paris area and Alsace region (Figure 1).
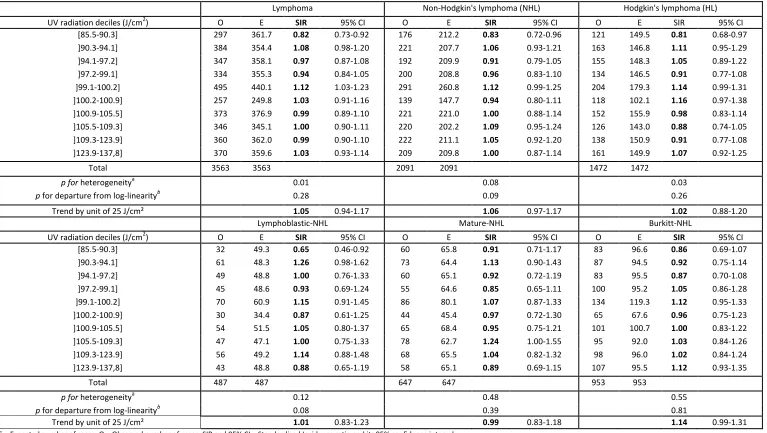
The main subtypes of leukemia were acute lymphoblastic leukemia (ALL), which accounted for 82.0% of all AL and acute myeloid leukemia (AML), which accounted for 16.3% of all AL (Table 1). The lymphomas consisted in 58.7% non-Hodgkin’s lymphoma (NHL) and 41.3% Hodgkin’s lymphoma. UV radiation exposure was positively associated with the incidence of AL (Table 2), with a significant log-linear trend. The association was limited to ALL, with a 9% increase in SIR (SIR=1.09;95%CI [1.03-1.14]) for an increase of 25 J/cm². A positive linear trend was found and was borderline significant for NHL, particularly the Burkitt subtype. However, the overall heterogeneity test for the ten deciles of exposure was clearly not significant (Table 3).
6/22
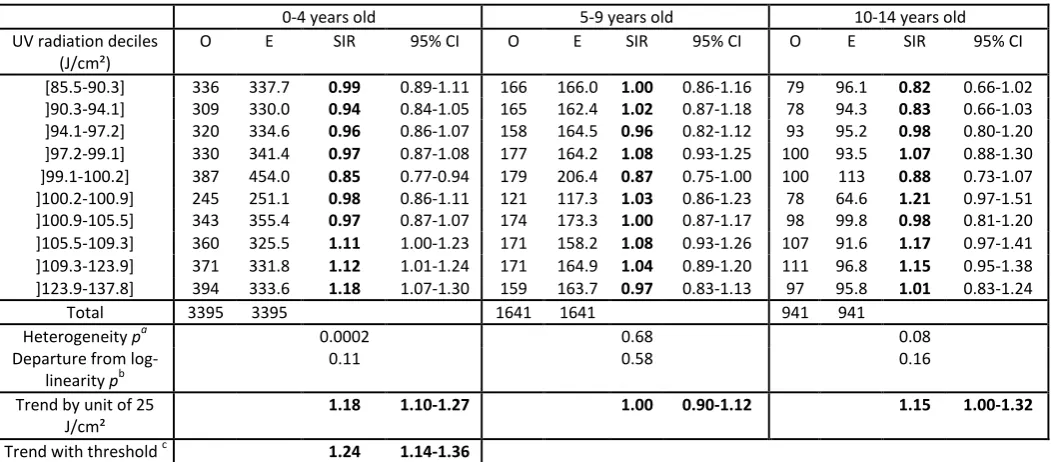
The results were also heterogeneous across the three main subtypes of ALL (p=0.036). A positive and still very highly significant association only remained for PBC-ALL, the most common ALL subtype with 5,977 cases (Table 2). The modifying effect of age at diagnosis also remained significant for PBC-ALL (p=0.035) (Table 4). A positive linear trend, borderline significant, was found for the 10-14 years age group. However, the heterogeneity test was not significant and the shape of the association was quite different from that of the 0-4 years age group.
The association between UV radiation exposure and the incidence of PBC-ALL in young children did not seem to be linear over the whole range of UV radiation exposure since the SIR were significantly greater than 1 only in the last three UV radiation exposure deciles (Table 4). Threshold log-linear Poisson regressions were adjusted with various possible values of the threshold and the clearly bestfit with the data was obtained with a threshold value of 100 J/cm². The corresponding SIR was 1.24 (95%CI [1.14-1.36]) for a 25 J/cm² difference in UV exposure among Communes exposed to 100 J/cm² or more (Table 4 and Supplementary figure).
The associations observed between residential UV radiation exposure and PBC-ALL diagnosed before age 5 years in the three time periods (1990-1996, 1997-2003, 2004-2009) were very similar, and no modifying effect of time period on the association between UV radiation exposure and PBC-ALL diagnosed before age 5 years was observed (Table 5).
Analyzing this association across 5 large French regions (North-East, Paris area, North-West, South-West, South-East) showed that it was positive and significant in the South-East region (SIR = 1.25; 95%CI [1.07, 1.45]), where UV radiation exposure is both greater on average than in the other regions and more variable (Table 5). In the South-West and North-West, the association was positive but not statistically significant. The UV radiation exposure variability in the Paris area was so limited that it could not be considered separately. This was also practically the case for the North East region, where the population exposed to more than 100J/cm² was very small (2.7%). However, when the South-East was excluded, the association between PBC-ALL diagnosed before age 5 years and UV radiation exposure was positive and significant (SIR: 1.46; 95%CI [1.14-1.87] for a 25-unit increase in UV above 100 J/cm²). Overall, there was no statistically significant modifying effect of the UV radiation PBC-ALL association by region (p=0.63).
A significant log-linear trend between PBC-ALL incidence and a French deprivation index (Fdep) was observed, with a slightly higher incidence of PBC-ALL before age 5 years in less deprived Communes
(p=0.03). No modifying or confounding effect of this variable on the association between Commune
UV radiation exposure and PBC-ALL diagnosed before age 5 years was evidenced. Sensitivity analyses on the South East of France, the region with the highest and most variable UV radiation exposure, which was also the region where the Fdep was most associated with PBC-ALL, did not show any modifying effect of Fdep on the association between UV radiation exposure and PBC-ALL (data not shown).
No association between PBC-ALL and urban status was observed (p=0.51). No modifying or confounding effect of urban status on the association between UV radiation exposure and PBC-ALL before age 5 years was observed (data not shown).
IV. Discussion
There was a positive association between the Commune spatial variability of UV radiation exposure and that of the incidence of PBC-ALL for the children aged less than 5 years in France for the period 1990-2009. No significant association was evidenced for the other CHM or at other ages. The association observed was the same for both genders, and was not modified by time period. No regional heterogeneity was observed. Stratification by, or adjustment for, a French deprivation index (Fdep99) and an urban unit variable did not significantly change the association between UV radiation exposure and the incidence of PBC-ALL in young children.
The power of the comparisons was evaluated a priori to be greater than 80% for SIR less than 0.85 or greater than 1.15 for most types of CHM, for a frequency of exposure of 10%. Even though multiple comparisons were performed by studying the association for each type of CHM, subtype of leukemia, age group, gender, and some potential confounding factors, the statistical significance level of the association and its consistency with respect to several stratifications do not suggest a random association.
The strengths of this study consist in the objectivity of the sun exposure data, available on a fine scale (Communes), and the exhaustiveness and high quality of the incidence data, and the long time period studied, which enabled large numbers of CHM cases to be studied by type and subtype. The population studied was relatively homogeneous and lived over a large area with a fairly wide distribution of UV radiation exposures.
Because of the very high spatial correlation between UVA and UVB, it was not possible to distinguish their associations with CHM.
Although the Commune UV radiation exposures were highly auto-correlated, an auto-correlated structure for the observed Poisson count was not considered relevant as the dependent variable was not spatially auto-correlated in any of the studies conducted in France. The small yearly variations in CHM incidence that had previously been observed[34] were taken into account in the estimates of the expected number of cases for each Commune.
As a result of the highly auto-correlated and smooth continuous spatial variation of Commune sun exposure, the sun exposure in the Commune of residence at inclusion in the study for the controls, was very closely correlated with that of the Commune of birth in two large population based case-control studies conducted by the authors' team on the same population of children (ESCALE: 2003-2004 and ESTELLE: 2010-2011). It is therefore unlikely that the findings of this study are dependent on considering the Commune at birth rather than the Commune at diagnosis. As a result, the association observed cannot be specifically related to a particular exposure time window for the children or their parents: before conception, during pregnancy, at birth, since birth, around diagnosis.
The present study detected a positive spatial correlation between a population exposure index,
Commune sun exposure, and Commune PBC-ALL incidence in young children. Even though it is likely that this association does exist in the French pediatric population it may be either a direct individual association or, alternatively, reflect the effect of some other unknown individual or Commune
characteristics, which are related to residential sun exposure and influence the incidence of this particular group of ALL. This is not the case for the increased incidence of children leukemia that has been observed in France in the close vicinity of nuclear power plants[35] or high voltage power lines[3]. Both increased incidences are very localized spatially and cannot explain the trend association found in this study.
8/22
international study conducted by Musselman and Spector [22] found an inverse association between sun exposure and leukemia (lymphoid and acute non-lymphocytic leukemia), and, after adjusting on a socioeconomic index, no significant association with lymphoma, as in the present study. The exposure was assessed by the absolute latitude and by an annual solar radiation measurement based on NASA data. The study was conducted on a very large scale, in 57 countries (some partially covered), located on different continents. The Greek study [23] found an inverse association between NHL and individual sun exposure. The study was based on interviews and measured individual sun exposure in a country with a very different level of UV radiation exposure to that in France. In addition, the association reported was based on a limited number of subjects (87 NHL cases, 164 controls). A large Finnish study [25], which included 7,423 cases between 1964 and 2003, both adults and children, found, in a subgroup analysis, lower numbers of ALL in the dark season among children aged 2-4 years. The results were quite similar to those of the present study.
The study[24] most similar to the present study in terms of methods and power was a large Californian study, which included 10,476 cases and 207,568 controls. The exposure assessment was ecological and obtained from a geostatistical model that estimated ground level UV radiation from UV radiation measurement station data. An inverse relationship was found for ALL and Non-Hodgkin’s lymphoma for children 0-5 years old. In contrast, the present study showed a significant positive association between sun exposure at diagnosis and PBC-ALL in young children (less than 5 years old) and no significant association with lymphoma. The Californian study analyzed sun exposure at birth and it may be that the correlation between sun exposure at birth and at diagnosis for the Californian children is not as strong as that observed in France. Furthermore, California has a different level of UV radiation exposure than France, as the maximum yearly average residential exposure to sun in France (137.8 J/cm2) is less than the first quartile of exposure in the Californian study (148.4 J/cm2). In addition, large fractions of the Californian population have different skin pigmentations and lifestyles. These may also contribute to explaining the different results. The Californian study recorded data on ‘ethnicity’ and the authors found a negative association with UV radiation exposure for children with Hispanic mothers (Hispanics were the largest ethnic group in the study) and African-American mothers, but not for children with Caucasian mothers. In the present study, no information on ‘ethnicity’ was available, but the majority of the French population is of Caucasian origin.
V. Conclusion
VI. Acknowledgments
VII. References
1. Orsi L, Rudant J, Bonaventure A, et al. (2012) Genetic polymorphisms and childhood acute lymphoblastic leukemia: GWAS of the ESCALE study (SFCE). Leukemia 26:2561–2564. doi: 10.1038/leu.2012.148
2. Rudant J, Menegaux F, Leverger G, et al. (2007) Household Exposure to Pesticides and Risk of Childhood Hematopoietic Malignancies: The ESCALE Study (SFCE). Environ Health Perspect 115:1787–1793. doi: 10.1289/ehp.10596
3. Sermage-Faure C, Demoury C, Rudant J, et al. (2013) Childhood leukaemia close to high-voltage power lines – the Geocap study, 2002–2007. Br J Cancer 108:1899–1906. doi: 10.1038/bjc.2013.128
4. INTERNATIONAL AGENCY FOR RESEARCH ON CANCER (1992) IARC monographs on the evaluation of carcinogenic risks to humans. Solar and ultraviolet radiation. IARC Monogr Eval Carcinog Risks Hum.55:1-316
5. Autier P, Boniol M, Pizot C, Mullie P (2014) Vitamin D status and ill health: a systematic review. Lancet Diabetes Endocrinol 2:76–89. doi: 10.1016/S2213-8587(13)70165-7
6. Doré J-F, Chignol M-C (2014) Vitamin D and Cancer. OCL 21:D306. doi: 10.1051/ocl/2013058 7. INTERNATIONAL PROGRAMME ON CHEMICAL SAFETY (1994) Ultraviolet radiation. EHC
Monographs 160
8. Jiang W, Ananthaswamy HN, Muller HK, et al. (2001) UV irradiation augments lymphoid malignancies in mice with one functional copy of wild-type p53. Proc Natl Acad Sci U S A 98:9790–9795. doi: 10.1073/pnas.171066498
9. Puebla-Osorio N, Miyahara Y, Coimbatore S, et al. (2011) Induction of B-cell lymphoma by UVB Radiation in p53 Haploinsufficient Mice. BMC Cancer 11:36. doi: 10.1186/1471-2407-11-36 10. Freedman DM, Zahm SH, Dosemeci M (1997) Residential and occupational exposure to sunlight
and mortality from non-Hodgkin’s lymphoma: composite (threefold) case-control study. BMJ 314:1451. doi: 10.1136/bmj.314.7092.1451
11. Kricker A, Armstrong BK, Hughes AM, et al. (2008) Personal sun exposure and risk of non Hodgkin lymphoma: A pooled analysis from the Interlymph Consortium. Int J Cancer 122:144–154. doi: 10.1002/ijc.23003
12. Wong K-Y, Tai B-C, Chia S-E, et al. (2012) Sun exposure and risk of lymphoid neoplasms in Singapore. Cancer Causes Control 23:1055–1064. doi: 10.1007/s10552-012-9974-1
13. Cahoon EK, Pfeiffer RM, Wheeler DC, et al. (2015) Relationship between ambient ultraviolet radiation and non-Hodgkin lymphoma subtypes: A U.S. population-based study of racial and ethnic groups. Int J Cancer 136:E432–E441. doi: 10.1002/ijc.29237
14. Bentham G (1996) Association between incidence of non-Hodgkin’s lymphoma and solar ultraviolet radiation in England and Wales. BMJ 312:1128–1131. doi: 10.1136/bmj.312.7039.1128
15. Grandin L, Orsi L, Troussard X, et al. (2008) UV radiation exposure, skin type and lymphoid malignancies: results of a French case-control study. Cancer Causes Control CCC 19:305–315. doi: 10.1007/s10552-007-9093-6
16. Bertrand KA, Chang ET, Abel GA, et al. (2011) Sunlight exposure, vitamin D, and risk of non-Hodgkin lymphoma in the Nurses’ Health Study. Cancer Causes Control CCC 22:1731–1741. doi: 10.1007/s10552-011-9849-x
17. Grant WB, Garland CF (2006) The Association of Solar Ultraviolet B (UVB) with Reducing Risk of Cancer: Multifactorial Ecologic Analysis of Geographic Variation in Age-adjusted Cancer Mortality Rates. Anticancer Res 26:2687–2699.
18. Boscoe FP, Schymura MJ (2006) Solar ultraviolet-B exposure and cancer incidence and mortality in the United States, 1993–2002. BMC Cancer 6:264. doi: 10.1186/1471-2407-6-264
12/22
20. Monnereau A, Glaser SL, Schupp CW, et al. (2013) Exposure to UV radiation and risk of Hodgkin lymphoma: a pooled analysis. Blood 122:3492–3499. doi: 10.1182/blood-2013-04-497586 21. Uehara M, Takahashi K, Hoshuyama T, et al. (2003) Geographical correlation between ambient
UVB level and mortality risk of leukemia in Japan. Environ Res 92:78–84. doi: 10.1016/S0013-9351(03)00034-3
22. Musselman JRB, Spector LG (2010) Childhood cancer incidence in relation to sunlight exposure. Br J Cancer 104:214–220. doi: 10.1038/sj.bjc.6606015
23. Petridou ET, Dikalioti SK, Skalkidou A, et al. (2007) Sun exposure, birth weight, and childhood lymphomas: a case control study in Greece. Cancer Causes Control 18:1031–1037. doi: 10.1007/s10552-007-9044-2
24. Lombardi C, Heck JE, Cockburn M, Ritz B (2013) Solar UV radiation and cancer in young children. Cancer Epidemiol Biomark Prev Publ Am Assoc Cancer Res Cosponsored Am Soc Prev Oncol 22:1118–1128. doi: 10.1158/1055-9965.EPI-12-1316
25. Timonen T, Näyhä S, Koskela T, Pukkala E (2007) Are sunlight deprivation and influenza epidemics associated with the onset of acute leukemia? Haematologica 92:1553–1556. doi: 10.3324/haematol.10799
26. Lacour B, Guyot-Goubin A, Guissou S, et al. (2010) Incidence of childhood cancer in France: National Children Cancer Registries, 2000–2004: Eur J Cancer Prev 19:173–181. doi: 10.1097/CEJ.0b013e32833876c0
27. Blanc P, Gschwind B, Lefèvre M, Wald L (2011) The HelioClim Project: Surface Solar Irradiance Data for Climate Applications. Remote Sens 3:343–361. doi: 10.3390/rs3020343
28. Bellec S, Hémon D, Rudant J, et al. (2006) Spatial and space–time clustering of childhood acute leukaemia in France from 1990 to 2000: a nationwide study. Br J Cancer 94:763–770. doi: 10.1038/sj.bjc.6602980
29. Faure C, Mollié A, Bellec S, et al. (2009) Geographical variations in the incidence of childhood acute leukaemia in France over the period 1990–2004: Eur J Cancer Prev 18:267–279. doi: 10.1097/CEJ.0b013e32832bf43a
30. Demoury C, Goujon-Bellec S, Guyot-Goubin A, et al. (2012) Spatial variations of childhood acute leukaemia in France, 1990–2006: global spatial heterogeneity and cluster detection at “living-zone” level. Eur J Cancer Prev 21:367–374. doi: 10.1097/CEJ.0b013e32834e31d8
31. Rey G, Jougla E, Fouillet A, Hémon D (2009) Ecological association between a deprivation index and mortality in France over the period 1997 – 2001: variations with spatial scale, degree of urbanicity, age, gender and cause of death. BMC Public Health 9:33. doi: 10.1186/1471-2458-9-33
32. Amigou A, Sermage-Faure C, Orsi L, et al. (2011) Road Traffic and Childhood Leukemia: The ESCALE Study (SFCE). Environ Health Perspect 119:566–572. doi: 10.1289/ehp.1002429 33. Ajrouche R, Rudant J, Orsi L, et al. (2014) Maternal reproductive history, fertility treatments and
folic acid supplementation in the risk of childhood acute leukemia: the ESTELLE Study. Cancer Causes Control 25:1283–1293. doi: 10.1007/s10552-014-0429-8
34. Goujon-Bellec S, Mollié A, Rudant J, et al. (2013) Time trends and seasonal variations in the diagnosis of childhood acute lymphoblastic leukaemia in France. Cancer Epidemiol 37:255– 261. doi: 10.1016/j.canep.2013.01.001
Table 1: Distribution of childhood hematological malignancies, by age and gender (France 1990-2009)
Boys Girls Both
0-4 years 5-9 years 10-14 years Total 0-4 years 5-9 years 10-14 years Total 0-4 years 5-9 years 10-14 years Total
Leukemia
ALL 2030 1321 832 4183 1746 953 561 3260 3776 2274 1393 7443
PBC-ALL 1765 849 498 3112 1630 792 443 2865 3395 1641 941 5977
B-ALL 72 115 63 250 27 39 19 85 99 154 82 335
T-ALL 164 345 262 771 72 111 92 275 236 456 354 1046
AML 351 171 226 748 343 175 210 728 694 346 436 1476
NOS AL 45 28 29 102 30 18 13 61 75 46 42 163
Total 2426 1520 1087 5033 2119 1146 784 4049 4545 2666 1871 9082
Lymphoma
NHL 293 621 569 1483 132 216 260 608 425 837 829 2091
Lymphoblastic 75 121 145 341 44 40 62 146 119 161 207 487
Burkitt 167 357 239 763 46 85 59 190 213 442 298 953
Mature 51 143 184 378 42 90 137 269 93 233 321 647
HL 56 255 551 862 10 81 519 610 66 336 1070 1472
Total 349 876 1120 2345 142 297 779 1218 491 1173 1899 3563
14/22
Table 2: Incidence of childhood leukemia (ages 0-14) by decile of UV radiation exposure (France, 1990-2009)
Acute Leukemia (AL) Acute lymphoblastic leukemia (ALL) Acute myeloid leukemia (AML) UV radiation deciles (J/cm²) O E SIR 95% CI O E SIR 95% CI O E SIR 95% CI
[85.5-90.3] 923 913.4 1.01 0.95-1.08 751 748.6 1 0.93-1.08 159 148.6 1.07 0.92-1.25 ]90.3-94.1] 888 893.4 0.99 0.93-1.06 725 732.2 0.99 0.92-1.06 140 145.3 0.96 0.82-1.14 ]94.1-97.2] 888 904 0.98 0.92-1.05 705 741.2 0.95 0.88-1.02 159 146.7 1.08 0.93-1.27 ]97.2-99.1] 919 909.6 1.01 0.95-1.08 739 745.6 0.99 0.92-1.07 166 147.7 1.12 0.97-1.31 ]99.1-100.2] 1082 1170.5 0.92 0.87-0.98 861 958.1 0.9 0.84-0.96 198 191.3 1.04 0.90-1.19 ]100.2-100.9] 633 654.9 0.97 0.89-1.04 534 537.1 0.99 0.91-1.08 91 106.1 0.86 0.70-1.05 ]100.9-105.5] 920 955.2 0.96 0.90-1.03 774 783.2 0.99 0.92-1.06 129 154.8 0.83 0.70-0.99 ]105.5-109.3] 938 874.8 1.07 1.01-1.14 771 716.8 1.08 1.00-1.15 145 142.3 1.02 0.87-1.20 ]109.3-123.9] 925 903.6 1.02 0.96-1.09 778 740.7 1.05 0.98-1.13 140 146.6 0.96 0.81-1.13 ]123.9-137,8] 966 902.7 1.07 1.00-1.14 805 739.6 1.09 1.02-1.17 149 146.7 1.02 0.86-1.19
Total 9082 9082 7443 7443 1476 1476
p for heterogeneitya 0.03 0.01 0.24
p for departure from log-linearityb 0.11 0.09 0.19
Trend by unit of 25 J/cm² 1.06 1.01-1.11 1.09 1.03-1.14 0.97 0.86-1.08
Precursor B-cell ALL (PBC-ALL) Burkitt-cell Leukemia (B-ALL) T-cell ALL (T-ALL)
UV radiation deciles O E SIR 95% CI O E SIR 95% CI O E SIR 95% CI
[85.5-90.3] 581 599.8 0.97 0.89-1.05 40 33.8 1.18 0.87-1.61 122 106.2 1.15 0.96-1.37 ]90.3-94.1] 552 586.8 0.94 0.87-1.02 52 33.1 1.57 1.20-2.06 109 103.9 1.05 0.87-1.27 ]94.1-97.2] 571 594.3 0.96 0.89-1.04 27 33.5 0.81 0.55-1.18 98 104.9 0.93 0.77-1.14 ]97.2-99.1] 607 599.1 1.01 0.94-1.10 24 33.5 0.72 0.48-1.07 97 104.5 0.93 0.76-1.13 ]99.1-100.2] 666 773.8 0.86 0.80-0.93 47 42.4 1.11 0.83-1.48 136 131 1.04 0.88-1.23 ]100.2-100.9] 444 433 1.03 0.93-1.13 25 23.9 1.05 0.71-1.55 61 74.1 0.82 0.64-1.06 ]100.9-105.5] 615 628.5 0.98 0.90-1.06 40 35.4 1.13 0.83-1.54 112 110.4 1.01 0.84-1.22 ]105.5-109.3] 638 575.2 1.11 1.03-1.20 24 32.4 0.74 0.50-1.11 101 101 1.00 0.82-1.21 ]109.3-123.9] 653 593.4 1.1 1.02-1.19 27 33.7 0.8 0.55-1.17 93 105.3 0.88 0.72-1.08 ]123.9-137.8] 650 593.1 1.1 1.01-1.18 29 33.5 0.87 0.60-1.25 117 104.7 1.12 0.93-1.34
Total 5977 5977 335 335 1046 1046
p for heterogeneitya <0.0001 0.02 0.43
p for departure from log-linearityb
0.31 0.06 0.34
E = Expected number of cases; O = Observed number of cases; SIR and 95% CI = Standardized Incidence ratio and its 95% confidence interval
a
16/22
Table 3: Incidence of childhood lymphoma (ages 0-14) by decile of UV radiation exposure (France, 1990-2009)
Lymphoma Non-Hodgkin's lymphoma (NHL) Hodgkin's lymphoma (HL)
UV radiation deciles (J/cm2) O E SIR 95% CI O E SIR 95% CI O E SIR 95% CI [85.5-90.3] 297 361.7 0.82 0.73-0.92 176 212.2 0.83 0.72-0.96 121 149.5 0.81 0.68-0.97 ]90.3-94.1] 384 354.4 1.08 0.98-1.20 221 207.7 1.06 0.93-1.21 163 146.8 1.11 0.95-1.29 ]94.1-97.2] 347 358.1 0.97 0.87-1.08 192 209.9 0.91 0.79-1.05 155 148.3 1.05 0.89-1.22 ]97.2-99.1] 334 355.3 0.94 0.84-1.05 200 208.8 0.96 0.83-1.10 134 146.5 0.91 0.77-1.08 ]99.1-100.2] 495 440.1 1.12 1.03-1.23 291 260.8 1.12 0.99-1.25 204 179.3 1.14 0.99-1.31 ]100.2-100.9] 257 249.8 1.03 0.91-1.16 139 147.7 0.94 0.80-1.11 118 102.1 1.16 0.97-1.38 ]100.9-105.5] 373 376.9 0.99 0.89-1.10 221 221.0 1.00 0.88-1.14 152 155.9 0.98 0.83-1.14 ]105.5-109.3] 346 345.1 1.00 0.90-1.11 220 202.2 1.09 0.95-1.24 126 143.0 0.88 0.74-1.05 ]109.3-123.9] 360 362.0 0.99 0.90-1.10 222 211.1 1.05 0.92-1.20 138 150.9 0.91 0.77-1.08 ]123.9-137,8] 370 359.6 1.03 0.93-1.14 209 209.8 1.00 0.87-1.14 161 149.9 1.07 0.92-1.25
Total 3563 3563 2091 2091 1472 1472
p for heterogeneitya 0.01 0.08 0.03
p for departure from log-linearityb 0.28 0.09 0.26
Trend by unit of 25 J/cm² 1.05 0.94-1.17 1.06 0.97-1.17 1.02 0.88-1.20
Lymphoblastic-NHL Mature-NHL Burkitt-NHL
UV radiation deciles (J/cm2) O E SIR 95% CI O E SIR 95% CI O E SIR 95% CI [85.5-90.3] 32 49.3 0.65 0.46-0.92 60 65.8 0.91 0.71-1.17 83 96.6 0.86 0.69-1.07 ]90.3-94.1] 61 48.3 1.26 0.98-1.62 73 64.4 1.13 0.90-1.43 87 94.5 0.92 0.75-1.14 ]94.1-97.2] 49 48.8 1.00 0.76-1.33 60 65.1 0.92 0.72-1.19 83 95.5 0.87 0.70-1.08 ]97.2-99.1] 45 48.6 0.93 0.69-1.24 55 64.6 0.85 0.65-1.11 100 95.2 1.05 0.86-1.28 ]99.1-100.2] 70 60.9 1.15 0.91-1.45 86 80.1 1.07 0.87-1.33 134 119.3 1.12 0.95-1.33 ]100.2-100.9] 30 34.4 0.87 0.61-1.25 44 45.4 0.97 0.72-1.30 65 67.6 0.96 0.75-1.23 ]100.9-105.5] 54 51.5 1.05 0.80-1.37 65 68.4 0.95 0.75-1.21 101 100.7 1.00 0.83-1.22 ]105.5-109.3] 47 47.1 1.00 0.75-1.33 78 62.7 1.24 1.00-1.55 95 92.0 1.03 0.84-1.26 ]109.3-123.9] 56 49.2 1.14 0.88-1.48 68 65.5 1.04 0.82-1.32 98 96.0 1.02 0.84-1.24 ]123.9-137,8] 43 48.8 0.88 0.65-1.19 58 65.1 0.89 0.69-1.15 107 95.5 1.12 0.93-1.35
Total 487 487 647 647 953 953
p for heterogeneitya 0.12 0.48 0.55
p for departure from log-linearityb 0.08 0.39 0.81
Trend by unit of 25 J/cm² 1.01 0.83-1.23 0.99 0.83-1.18 1.14 0.99-1.31
E = Expected number of cases; O = Observed number of cases; SIR and 95% CI = Standardized Incidence ratio and its 95% confidence interval
Table 4: Association between UV radiation exposure and incidence of PBC-ALL by age group at diagnosis (France, 1990-2009)
0-4 years old 5-9 years old 10-14 years old UV radiation deciles
(J/cm²)
O E SIR 95% CI O E SIR 95% CI O E SIR 95% CI
[85.5-90.3] 336 337.7 0.99 0.89-1.11 166 166.0 1.00 0.86-1.16 79 96.1 0.82 0.66-1.02 ]90.3-94.1] 309 330.0 0.94 0.84-1.05 165 162.4 1.02 0.87-1.18 78 94.3 0.83 0.66-1.03 ]94.1-97.2] 320 334.6 0.96 0.86-1.07 158 164.5 0.96 0.82-1.12 93 95.2 0.98 0.80-1.20 ]97.2-99.1] 330 341.4 0.97 0.87-1.08 177 164.2 1.08 0.93-1.25 100 93.5 1.07 0.88-1.30 ]99.1-100.2] 387 454.0 0.85 0.77-0.94 179 206.4 0.87 0.75-1.00 100 113 0.88 0.73-1.07 ]100.2-100.9] 245 251.1 0.98 0.86-1.11 121 117.3 1.03 0.86-1.23 78 64.6 1.21 0.97-1.51 ]100.9-105.5] 343 355.4 0.97 0.87-1.07 174 173.3 1.00 0.87-1.17 98 99.8 0.98 0.81-1.20 ]105.5-109.3] 360 325.5 1.11 1.00-1.23 171 158.2 1.08 0.93-1.26 107 91.6 1.17 0.97-1.41 ]109.3-123.9] 371 331.8 1.12 1.01-1.24 171 164.9 1.04 0.89-1.20 111 96.8 1.15 0.95-1.38 ]123.9-137.8] 394 333.6 1.18 1.07-1.30 159 163.7 0.97 0.83-1.13 97 95.8 1.01 0.83-1.24
Total 3395 3395 1641 1641 941 941
Heterogeneity pa 0.0002 0.68 0.08
Departure from log-linearity pb
0.11 0.58 0.16
Trend by unit of 25 J/cm²
1.18 1.10-1.27 1.00 0.90-1.12 1.15 1.00-1.32
Trend with threshold c 1.24 1.14-1.36
E = Expected number of cases; O = Observed number of cases; SIR and 95% CI = Standardized Incidence ratio and its 95% confidence interval
ap-value of the test for heterogeneity of the SIR observed across the 10 strata of UV radiation exposure; bp-value of the test for departure
from log-linearity of the SIR; cTrend with threshold: the threshold value which achieved the best fit to the data was 100 J/cm2, the UVT variable is therefore the excess of UV radiation (in units of 25 J/cm2) above 100 J/cm2, that is: UVT = 0 if UV ≤ 100 J/cm2, UVT = (UV-
18/22
Table 5: Association between UV radiation exposure and incidence of PBC-ALL diagnosed before age 5 years in France 1990-2009, by time period and in 5 French regions
Variable Strata Mina P10a Mediana P90a Maxa % pop (<5 years old) >100 J/cm² O E SIR 95% CI
Periods 1990-1996 85.5 90.3 100.0 123.4 137.8 50.0 1176 1176 1.20 1.03-1.39
1997-2003 85.5 90.4 100.2 123.6 137.8 51.0 1145 1145 1.29 1.11-1.49
2004-2009 85.5 90.5 100.2 123.6 137.8 51.7 1074 1074 1.24 1.06-1.45
Geographic areas South-East 93.8 103.5 116.5 130.8 137.8 96.0 852 784.5 1.25 1.07-1.45
South-West 96.9 103.2 109.2 113.7 123.7 97.5 426 394.8 1.67 0.88-3.20
Paris areab 97.3 99.1 100.2 100.9 101.7 54.8 -
North-West 88.2 93.0 97.6 104.4 117.8 26.3 685 682.5 1.12 0.59-2.11
North-East 85.5 88.7 91.2 98.1 112.1 2.7 800 828.2 0.29 0.003-24.53
Overall association France 1990-2009 85.5 90.3 100.2 123.5 137.8 50.9 3395 3395 1.24 1.14-1.36
O = Observed number of cases; E = expected number of cases; SIR = Estimated trend in SIR by unit of a 25 J/cm2 above 100 J/cm2 obtained from the slope of the adjusted Poisson regression of Observed over
Figure 1: UV radiation: spatial variations in France, 1988-2007 (J/cm²) a
a
20/22
Supplementary table A: Association between UV radiation exposure and ALL incidence by age group at diagnosis (France, 1990-2009)
0-4 years old 5-9 years old 10-14 years old
UV radiation deciles (J/cm²)
O E SIR 95% CI O E SIR 95% CI O E SIR 95% CI
[85.5-90.3] 380 375.9 1.01 0.91-1.12 236 230.3 1.02 0.90-1.16 135 142.4 0.95 0.80-1.12 ]90.3-94.1] 353 367.2 0.96 0.87-1.07 238 225.3 1.06 0.93-1.20 134 139.7 0.96 0.81-1.14 ]94.1-97.2] 354 372.2 0.95 0.86-1.06 210 228.0 0.92 0.80-1.05 141 141.0 1.00 0.85-1.18 ]97.2-99.1] 362 379.7 0.95 0.86-1.06 239 227.6 1.05 0.93-1.19 138 138.4 1.00 0.84-1.18 ]99.1-100.2] 442 504.8 0.88 0.80-0.96 261 285.7 0.91 0.81-1.03 158 167.7 0.94 0.81-1.10 ]100.2-100.9] 265 279.2 0.95 0.84-1.07 159 162.4 0.98 0.84-1.14 110 95.5 1.15 0.96-1.39 ]100.9-105.5] 380 395.2 0.96 0.87-1.06 243 240.1 1.01 0.89-1.15 151 147.9 1.02 0.87-1.20 ]105.5-109.3] 399 361.9 1.10 1.00-1.22 224 219.2 1.02 0.90-1.17 148 135.7 1.09 0.93-1.28 ]109.3-123.9] 403 368.9 1.09 0.99-1.20 230 228.5 1.01 0.88-1.15 145 143.2 1.01 0.86-1.19 ]123.9-137.8] 438 371.0 1.18 1.08-1.30 234 227.0 1.03 0.91-1.17 133 141.6 0.94 0.79-1.11
Total 3776 3776 2274 2274 1393 1393
Heterogeneity p=a
0.0004 0.79 0.83
Departure from log-linearity p=b
0.12 0.71 0.76
Trend by unit of 25 J/cm²
1.16 1.08-1.25 1.02 0.93-1.11 1.00 0.89-1.13
E = Expected number of cases; O = Observed number of cases; SIR and 95% CI = Standardized Incidence ratio and its 95% confidence interval; ap-value of the test for heterogeneity of the SIR observed across the 10 strata of UV radiation exposure; bp-value of the test for
Supplementary table B: Association between UV radiation exposure and childhood ALL incidence by gender (France, 1990-2009)
Boys Girls
UV radiation deciles
O E SIR 95% CI O E SIR 95% CI
[85,5-90,3] 429 422.0 1.02 0.92-1.12 322 326.6 0.99 0.88-1.10 ]90,3-94,1] 423 411.7 1.03 0.93-1.13 302 320.6 0.94 0.84-1.05 ]94,1-97,2] 390 416.5 0.94 0.85-1.03 315 324.7 0.97 0.87-1.08 ]97,2-99,1] 426 418.8 1.02 0.93-1.12 313 326.8 0.96 0.86-1.07 ]99,1-100,2] 484 536.4 0.90 0.83-0.99 377 421.7 0.89 0.81-0.99 ]100,2-100,9] 286 300.8 0.95 0.85-1.07 248 236.3 1.05 0.93-1.19 ]100,9-105,5] 439 440.5 1.00 0.91-1.09 335 342.7 0.98 0.88-1.09 ]105,5-109,3] 403 403.3 1.00 0.91-1.10 368 313.5 1.17 1.06-1.30 ]109,3-123,9] 440 416.9 1.06 0.96-1.16 338 323.8 1.04 0.94-1.16 ]123,9-137,8] 463 416.3 1.11 1.02-1.22 342 323.3 1.06 0.95-1.18
Total 4183 4183 3260 3260 Heterogeneity p=a 0.10 0.03
Departure from log-linearity p=b
0.30 0.10
Trend by unit of 25 J/cm²
1.08 1.01-1.16 1.09 1.01-1.18
E = Expected number of cases; O = Observed number of cases; SIR and 95% CI = Standardized Incidence ratio and its 95% confidence interval; ap-value of the test for heterogeneity of the SIR observed across the 10 strata of UV radiation exposure; bp-value of the test for
22/22
Supplementary figure: Standardized Incidence Ratio (SIR) of PBC-ALL diagnosed before age 5 years in France, 1990-2009, as a function of the UV radiation exposure of the Commune of residence at diagnosis
Observed SIR with 95% CI by UV radiation decile and SIR predicted from the fitted threshold linear model
a
Vertical bars: Observed SIR and 95% confidence limits
b