City, University of London Institutional Repository
Citation
:
Tyler, C.W. (2012). Spatial Form as Inherently Three Dimensional. In: Spatial
Form as Inherently Three Dimensional. (pp. 1-17). Oxford University Press. ISBN
0195172884
This is the accepted version of the paper.
This version of the publication may differ from the final published
version.
Permanent repository link:
http://openaccess.city.ac.uk/7054/
Link to published version
:
http://dx.doi.org/10.1093/acprof:oso/9780195172881.003.0006
Copyright and reuse:
City Research Online aims to make research
outputs of City, University of London available to a wider audience.
Copyright and Moral Rights remain with the author(s) and/or copyright
holders. URLs from City Research Online may be freely distributed and
linked to.
City Research Online:
http://openaccess.city.ac.uk/
[email protected]
Shape Processing as Inherently Three-Dimensional
Christopher W. Tyler
The Inherently Three-Dimensional Demand Characteristics of Visual Encoding
In order to plan and coordinate actions for foraging, procreation and self-preservation, organisms need a functional representation of the three-dimensional scene layout and of the spatial configuration and dynamics of the objects within it both in the picture plane and in depth. A primary goal of visual encoding is, there-fore, to determine the inherently three-dimensional shape structure and motion tra-jectories of the objects in the surrounding environment.
These demand characteristics pose a problem, however, in relation to the prop-erties of the visual array, which have an entirely different metric structure from those of the spatial configuration of the objects. The laws governing the spatial re-lationships within these two domains, the physical array and the visual array, are strikingly incompatible. Physically, objects consist of aggregates of particles that cohere together, with empty space (or non-coherent media, such as air or water) between them. Objects may be rigid or flexible, but in either case, a given object is formed from the same set of particles with invariant connectivity. The visual cues that convey the presence of objects to the brain or to artificial sensing systems, however, share none of these properties. The visual cues may change in luminance or color, and they may be disrupted by reflections or disappear entirely from oc-clusion by intervening objects. Moreover, the information carried by the multiplic-ity of visual cues about different aspects of an object, such as edge contours, bin-ocular disparity, color, shading, texture, and motion vector fields, may even be non-coherent or disjunctive across the different cues.
In particular, any of these cues may be sparse, with missing information about the object structure across gaps where there are no edge or texture cues to carry in-formation about the object shape; or ambiguous, where the cue inin-formation is con-sistent with multiple interpretations of the object shape. Nevertheless, despite the sparse, inconsistent, and variable nature of the local cues, we perceive the shape of solid, three-dimensional (3D) objects by interpolating the sparse depth cues into coherent spatial structures generally matching the physical nature of the objects.
strik-ing example of 3D shape completion is the tetrahedral pyramid that can be seen in the occluded white space in Fig. 1. Within the enclosed white area in this figure, there is no information, either monocular (shading, texture gradient, etc.) or bin-ocular (disparity gradient) about the object structure. Yet our perceptual system performs a compelling reconstruction of the 3D shape of the pyramid, based on the monocular cues of the spherical border shapes. This example illustrates the flexibility of the surface-completion mechanism in adapting to the variety of un-expected demands for shape reconstruction. Developing a means of representing the proliferation of 3D object shapes in the world around us is therefore a key stage in the neural representation of the object structure.
It is important to stress that the 3D shape reconstruction of Fig. 1 provides a perceptually valid sense of depth and en-courages the view that the 3D surface representation is the primary cue to ob-ject structure (Likova and Tyler, 2003; Tyler, 2006). Objects in the world are typically defined by contours and local features separated by featureless regions (such as the design printed on a beach ball, or the smooth skin between facial features). Surface representation is an important stage in the visual coding of shape. The concept of 3D shape repre-sentation requires a surface interpolation mechanism to represent the surface shape in regions of the field where the infor-mation is undefined. Such interpolation is analogous to the “shrink-wrapping” of
a protective membrane around an irregular object such as an item of food or do-mestic hardware. It takes the information available at defined points and extends a membrane across the regions of empty space between these anchor points. This is the natural way to overcome the sparseness of the representation of object shape on the basis of the available cues to its depth.
Theoretical Analysis of Shape Representation as Surface Manifolds
It may seem self-evident that the shape of objects is three-dimensional, but it is striking that current computational analysis is largely limited to the 2D projection of object outlines for shape recognition (e.g., Chum et al., 2007; Ovsjanikov et al., 2009). This may be somewhat understandable in applications involving the recognition of static 2D images, such as Internet image search algorithms, but it is even the case for 3D applications in robotics, such as object manipulation routines.
Even in these inherently 3D tasks, the requirement to grasp arbitrary object shapes is often addressed by the brute-force approach of storing arrays of large numbers of possible 2D views of the likely forms of objects for viewpoint recognition.
With a sufficiently large number of 2D profile representations of the shape, it may seem that they amount to an effective 3D representation, but this is not the case. Each profile is treated as an independent sample of the object and the one best fitting the current image is the sole current representation, with no formal means of combining it with past best fits. This is very different from a full 3D rep-resentation of the object form, which would involve an understanding of the solid-angle relationships among the surfaces, not just their cross-sectional cuts. Indeed, the truly complete 3D representation would include the array of values of material density at every point in space, as in an MRI scan. However, although this voxel array provides the full 3D data representing the object structure, it does not do so in a form that could be considered a shape representation. ‘Shape’ is some ab-stracted subset of this full 3D array of structure information, since shape is largely defined by the surface boundary of the structure, which inherently forms a 2D manifold in 3D.
In general, then, the primary meaning of the term ‘shape’ may thus be con-ceptualized as the properties of a manifold embedded in a higher-dimensional space. In common usage, it is applied either to one-dimensional manifolds (or loop structures) in two- or higher-dimensional spaces, or to 2D surface manifolds in three or higher-dimensional spaces. In more complex or metaphorical informa-tional representations, such as in the phrase “the shape of things to come”, it may be extended to higher dimensional manifolds in the full space of the cultural do-main that we inhabit.
Neural Aspects of 3D Shape Representation
been used to generate the complex object surfaces from the sparse depth cue in-formation, specification of the 3D object shape requires the relevant shape features to be identified and to be localized relative to each other. Only when the shape features have been both identified and localized can the shape be said to have been encoded.
Need for the Surface Representation of 3D Shape
If the neural shape representation takes the form of representing shapes in terms of their surface structure, surfaces should play a key role in organizing the perceptual inputs into a coherent shape representation. Such shape recognition is particularly challenging under conditions where the objects could be considered as "sampled" by overlapping noise or partial occlusion - the tiger behind the trees, the face behind the window-curtain. Similarly, the edge features of typical objects, such as the form of a face or the edges of a computer monitor, may be separated by blank regions of many degrees. These situations require interpolation, and low-level filter integration can only account for interpolation behavior up to the tiny range of 2-3 arc min in foveal vision (Morgan & Watt, 1982), scaling proportion-ately with eccentricity. This limitation raises the “long-range depth interpolation problem” that is still largely unrecognized, although there has been much recent interest in relation to the position coding for extended stimuli, such as Gaussian blobs and Gabor patches (Morgan and Watt, 1982; Hess and Holliday, 1992; Levi, Klein, and Wang, 1994; Likova and Tyler, 2003). Thus, the interpolation required for specifying the shape of most objects is well beyond the range of the available filters.
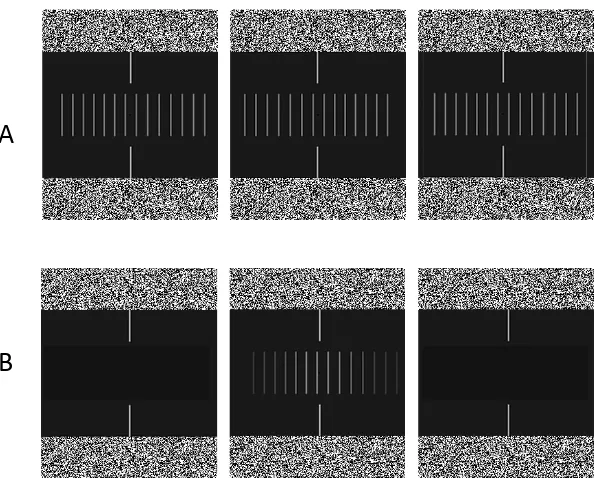
Fig. 2. Free-fusion stereogram (three-panel) depicting the sampled Gaussian bulge used by Li-kova and Tyler (2003) to study the depth surface interpolation process. The panels are defined for stereoscopic viewing across pairs of panels, providing both crossed and uncrossed disparity for either a crossed or an uncrossed vergence angle. A. Disparity-defined bulge, seen as forward in one panel and recessed in the other, depending on whether vergence is crossed or uncrossed. B. Luminance-defined (non-stereoscopic) bulge, arranged for monocular viewing with a black field in the non-viewing eye. Note the strong perceived depth despite the lack of disparity infor-mation (or even in the presence of zero-disparity inforinfor-mation when viewed directly).
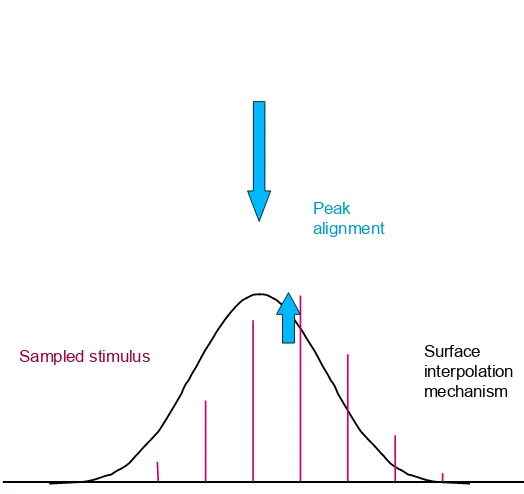
The localization task is depicted in Fig. 3. The bars depict the local depth in-formation in the sample bars, and the continuous curve depicts the Bayesian mod-el of the interpolated Gaussian surface that needs to be localized by access to the local depth information, relative to the fiducial markers. (Inspection of Fig. 2 should make it clear that the depth is experienced as a floating surface interpola-tion.) Note that this is effectively a cyclopean stimulus (Julesz, 1971), in the sense that the bars contain no visible information as to the form of the Gaussian bulge when viewed monocularly. It is only when they are viewed stereoscopically that the form and its depth sign become apparent.
The task was to assess whether, on any given trial, the interpolated surface peaked to the left or right of the fiducial marker (regardless of the position of the samples). Localization accuracy from disparity alone was as fine as 1-2 arc min, requiring accurate interpolation to localize the peak of the function between the samples spaced 16 arc min apart. This performance contrasted with that for pure luminance profiles, which was about ten times worse.
DISPARITY PROFILE ONLY DISPARITY PROFILE ONLYDISPARITY PROFILE ONLY
LUMINANCE PROFILE ONLY LUMINANCE PROFILE ONLY
[image:6.595.137.434.160.399.2]Fig. 3. Schematic of the surface interpolation task. The vertical bars represent the sampled depth information (luminance, disparity, or both). The Gaussian curve represents the perceptual model of the expected surface to be interpolated onto the stimulus. The up arrow represents the optimal interpolated location for the peak of the Gaussian, and the down arrow represents the fiducial marker against which the peak location needs to be judged.
The implication to be drawn from these basic results is that some long-range in-terpolation mechanism is required to determine the shape of extended objects be-fore us. The ability to encode shape is degraded once the details fall outside the range of the local filters. However, the location was still specifiable to a much fin-er resolution than the sample spacing, implying the opfin-eration of an intfin-erpolation mechanism to determine the location of the peak of the Gaussian despite the fact that it was not consistently represented within the samples.
Perhaps the most startling aspect of the results was that position discrimination in sampled profiles could be completely nulled by the addition of a slight disparity profile to null the perceived depth from the luminance variation. It should be em-phasized that the position information from disparity was identical to the position information from luminance on each trial, so addition of the second cue would be expected to reinforce the ability to discriminate position if the two cues were pro-cessed independently. Instead, the nulling of the luminance-based position infor-mation by the depth signal implies that the luminance target is processed exclu-sively through the depth interpretation. Once the depth interpretation is nulled by the disparity signal, the luminance information no longer supported position dis-crimination.
This evidence suggests that depth surface reconstruction is the key process in the accuracy of the localization process. It appears that visual patterns defined by
Sampled stimulus
Peak alignment
different depth cues are interpreted as objects in the process of determining their location. Only an interpolation mechanism operating at the level of a generic depth representation can account for the data. Specifically, a depth interpolation mechanism accounts for the impossibility of position discrimination at the cancel-lation point and the asymmetric shift of the cancelcancel-lation point by the luminance cue (Fig. 2). The fine resolution of the performance when disparity information is present clearly implies that an interpolation process is involved in the perfor-mance, because it is about eight times better than could be supported by the loca-tion of the samples alone (even assuming that the sample nearest the peak could be identified from the luminance information; see Likova and Tyler, 2003).
The conclusions from this work are that (1) the interpolation mechanism was inefficient for larger sample numbers, because it used information from only two to three samples even though up to 10 times as many samples were available; (2) the interpolation mechanism could operate over long range to determine the shape and location of the implied object to substantially higher precision than the spac-ing of the samples (~6 arc min); and (3) the mechanism was not a simple integra-tor over the samples within any particular range.
Evidently, the full specification of objects in general requires extensive interpo-lation to take place, even though some textured objects may be well defined by lo-cal information alone. The interpolated position task may therefore be regarded as more representative of real-world localization of objects than the typical Vernier acuity or other line-based localization tasks of the classic literature. It consequent-ly seems remarkable that luminance information, per se, is unable to support local-ization for objects requiring interpolation. The data indicate that it is only through the interpolated depth representation that the position of the features can be recog-nized. One might have expected that positional localization would be a spatial form task depending on the primary form processes (Marr, 1982). The dominance of a depth representation in the performance of such tasks indicates that the depth information is not just an overlay to the 2D sketch of the positional information. Instead, it seems that a full 3D depth reconstruction of the surfaces in the scene must be completed before the position of the object is known.
Hypercyclopean Form Analysis
basis, in the sense of having properties specific to the disparity-selective neurons in the cyclopean retina, but would perform a hypercyclopean analysis of the spa-tial and temporal form of the depth image. Hypercyclopean receptive fields would have characteristics defined in terms of the figural properties of the cyclopean im-age, but independent of its specific disparity characteristics, i.e., which particular disparity is stimulated at any given retinal location.
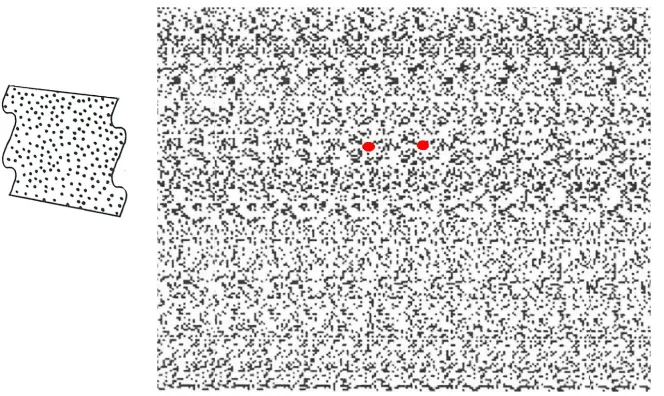
Fig. 4. Cyclopean autostereogram of depicting sinusoidal furrows in depth (from Tyler, 1983).
Fuse the two red dots to see one binocular dot flanked by two monocular dots and allow visual processing to operate on the rest of the field while maintaining fixation on the binocular dot.
A simple example of a cyclopean stimulus is provided in Fig. 4, which is an au-tostereogram of a sinusoidal stereograting originally published by Tyler (1983). Free-fusion of the red dots give the percept of one binocular dot flanked by two monocular dots will reveal the stereograting embedded in the repeated dot pattern. For those experiencing difficulty with free fusion, a couple of cycles of the stere-ograting are depicted graphically at left. Again, note that the sterestere-ograting is cy-clopean in the sense that there is no information defining it in the non-fused dot array. The furrows could be of any orientation or spatial pitch with no visible trace in the dot array when directly viewed.
[image:9.595.140.472.240.438.2]Hyper-9
cyclopean specificity for adaptation to the spatial frequency content of the cyclo-pean image was demonstrated by Tyler (1975) and Schumer and Ganz (1979), for orientation specificity in a cyclopean tilt aftereffect by Tyler (1975) and for mo-tion specificity in the form of a momo-tion aftereffect to momo-tion of the purely cyclope-an depth image by Papert (1964).
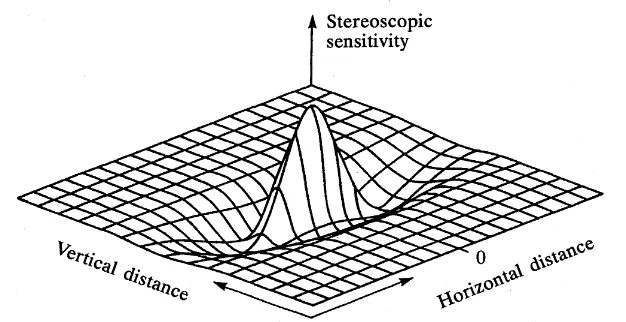
The structure of the hypercyclopean form processing channels was measured directly by Tyler and Kontsevich (2001) by means of a spatial summation para-digm. They were found to be well-approximated by one-cycle Gabor functions that were generally elongated along the orientation of the cyclopean stimulus (Fig. 5), although the summation was isotropic for vertical oriented cyclopean bar stim-uli. The detection functions were tuned to the peak frequency of about half a cy-cle per degree (as expected from the range of sensitivity to cyclopean stimuli; Ty-ler, 1974). This depth processing capability was evaluated by Hibbard (2005), who used notch cyclopean noise to determine the hypercyclopean orientation band-widths and found them to be isotropic, implying that the elongated summation fields must follow a (high-level) processing nonlinearity of some kind. These few studies represent only the beginning of the exploration of the hypercyclopean pro-cessing domain, which can form the basis for a full paradigm of extended high-level processing investigations.
Fig. 5. Hypercyclopean processing field in the form of a horizontally-oriented single-cycle Ga-bor function operating on the cyclopean depth image.
Another approach to the 2D organization of hypercyclopean processing is to measure stereoscopic (2D) shape discrimination in the form of the just-noticeable difference in aspect ratio rectangles defined entirely by disparity. With this para-digm, Regan and Hamstra (1994) found that aspect ratio discrimination was
dif-distinct class of dynamic stereomechanisms. Evidence has shown this class to include
separate mechanisms with different properties for achromatic and chromatic depth
motions, again as reviewed in Tyler (1993).
1.5
Global interactions
The third cortical stage of the model is the site of the global interactions between the
local disparity detectors that serve to refine the representation of the disparity image
from its initial crude array of stimulated points to a coherent representation of the
3-D surfaces present in the field of view. A variety of such processes have been
proposed by Julesz and others over the years, summarized in Julesz (1971, 1978) and
Tyler (1983, 1991b).
Mechanisms in this class of global interactions use either conventional positional
disparity information from the two retinae or specialized disparity information, but
respond on the basis of some global aspect of the disparity field. Examples of such
interactions are globality, cooperativity, and perceptual hysteresis.
Globality
refers to the neural processes that restrict depth perception to a single
perceived depth along any line of sight. Its operation is represented by the
unique-ness constraint, which requires the ability to solve the binocular-correspondence
problem, ie to identify a unified percept of a coherent depth image from the cloud of
possible correspondences between all the dots projecting to one eye and all the dots
projecting to the other eye.
Cooperativity
is defined as any type of mutual interaction between the processing for
different spatial regions of the stereo image. Such lateral cooperativity may also be
involved in solving the correspondence problem effectively; it may well include such
interactions as lateral inhibition between disparity detectors (figure 4), disparity-specific
pooling or facilitation, the disparity-gradient limitation on the upper limit for depth
reconstruction, coarse-to-fine matching processes for building up the depth image
from the monocular information, and so on. These processes all may be conceived as
taking place within the locus of global interactions depicted by (c) in figure 1,
follow-ing the interocular-matchfollow-ing or disparity-detection stage but precedfollow-ing the generation
of a unified global depth image from the plethora of available disparity information.
Perceptual hysteresis
is a difference in sensitivity for a change between two states
according to the direction of the change. It may be termed catabolic hysteresis if the
change is an order - disorder transition that occurs far more readily for increases in
disorder, or entropy, in the stimulus than for the opposite transitions, decreases in
entropy. An example for the neural binocular system occurs in the formation and
A Stereoscopic
sensitivity
[image:10.595.138.451.408.569.2]ferent for crossed and uncrossed disparities, first decreasing and then leveling out as its disparity increased from zero, while the perceived depth of the rectangle in-creased smoothly and approximately linearly. The lowest value of aspect ratio dis-crimination threshold (3%) was the same for both crossed and uncrossed dispari-ties, and occurred at the disparity limit for the onset of diplopia. The implication here is that larger disparities improved the signal/noise ratio for the shape cue, while diplopia degraded it due to the presence of the double images and the result-ing binocular rivalry. Interestresult-ingly, the shape discrimination threshold had a preci-sion better than 1 arcmin — an order of magnitude better than the (cyclopean) ste-reograting resolution. This performance seems to reflect the fact that stereoscopic vision can integrate over long edges to determine detailed shape information even though the local form processing is relatively coarse.
Metric constraints on 3D shape perception
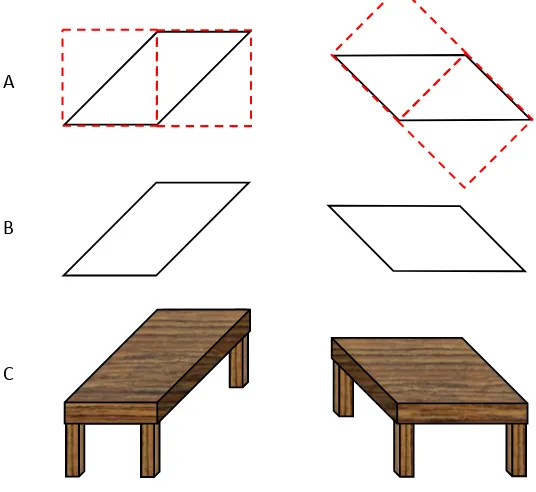
Fig. 6. Development of an enhanced version of the Shepard table-top illustration (modified from Tyler, 2011). The metric structure of the parallelograms is maintained throughout the figure, as can be verified with a ruler, despite the strong perceived distortion when incorporated as table tops. The distortion illustrates the power of the depth interpretation to modify perceived shape.
In terms of the three-dimensional shape, a 3D interpretation can give rise to marked illusions in the perceived 2D shape of even simple figures. A striking ex-ample is the Shepard table-top illusion analyzed in Fig. 6 (modified from Tyler, 2011). Two parallelograms of the identical 2D shape are shown with a relative 45 deg rotation. Fig. 6A illustrates the construction geometry of each parallelogram from two right triangles with hypotenuse-to-side ratios of √2:1. When viewed ro-tated, there is already some shape distortion (Fig. 6B), but when the identical shapes are given strong 3D depth cues in the form of box sides and table legs (Fig 6C), the depth illusion generates perceived distortion of the order of √2 (~40%), such that the lefthand tabletop seems to have about a 2:1 aspect ratio while the righthand one looks like an oblique square (rhombus). The illustration can be checked with a ruler to ensure that this is a fully perceptual effect and not some fakery in the illustration!
Quantitatively, the two tabletops would need to be slanted in depth by a 45º di-hedral angle relative to the orientation of the page (or monitor surface) in order to generate the observed degree of shape distortion. The implication is that the 45º angle of the parallelogram sides would need to translated to the same angle in depth in order to account for the strength of the illusion. Moreover, the shape has
to be assessed as if viewed from directly above the surface, as though we had ro-tated our position in space by the same angle as the surface rotation to assess the intrinsic shape of the two tabletops independent of their physical orientation.
Note all these depth compensation processes are taking place despite the fact that the tabletop images have conflicted perspective cues, in that the receding sides remain parallel rather than converging, as should be expected by the rules of linear perspective. The tabletops are thus subject to the ‘Chinese perspective’ dis-tortion that the rear edges appear wider than the front edges. It might be expected that the perceived aspect-ratio distortion would be even stronger if perspective were introduced, but this would violate the format requirement that the two shapes remain identical. (Note, conversely, that the legs seem to be subject to the opposite
illusion of seeming shorter in the back, a novel effect analyzed by Tyler, 2011). The general point is that this illusion is a strong example of what Gregory (1963) termed ‘inappropriate constancy scaling’. It is ‘inappropriate’ in the sense that the explicit task is a 2D shape evaluation, while the depth cues force a slanted 3D interpretation that intrudes into the process to scale the perceived shape as though it were slanted in 3D. What is surprising is that we do not see the image as having much of an explicitly 3D slant. It is very clearly being displayed in a flat, 2D format on the printed page (or computer monitor). Even if asked to suspend the knowledge that the image is displayed on the printed page, most viewers would say that they look like cardboard cutouts with a depth of about a quarter of the height, not nearly enough to account for the illusion. Unlike the Johnston (1991) 3D shape experiment, therefore, the perceived depth does not appear to be sufficient to account for the strength of the illusory shape distortion. The implica-tion is that there is some intermediate stage of ‘pictorial depth’ at which the depth structure of images is understood but not perceived. This is not the same process as the cognitive assessment of the physical depth of the display being viewed, or as the perceptual assessment of the local depth actually invoked in the region of the image being queried.
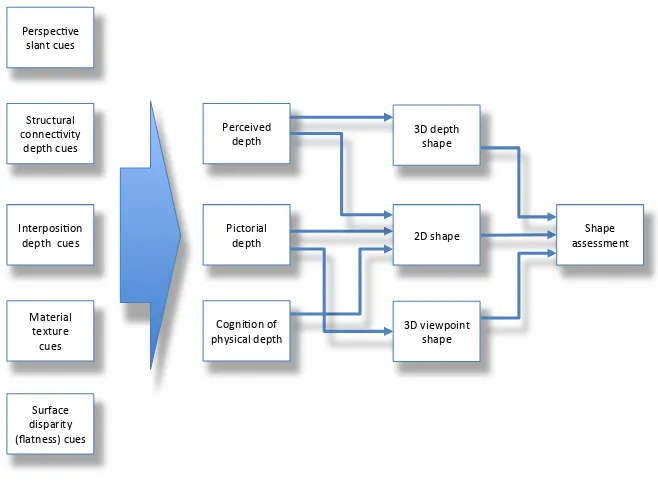
This triple conceptualization of human depth processing is encapsulated in the diagram of Fig. 7. This diagram begins with the early processing modules for five types of depth cue, which are treated as feeding with differential weights into mid-level modules for three types of depth processing: the perceived depth experienced by the viewer, the pictorial depth understanding in viewing pictures and photo-graphs, and the cognitive understanding of the physical depth of flatness (or oth-erwise) of the image support medium (the paper, wall, canvas or screen displaying the image). Under optimal viewing conditions, the cognitive understanding of flatness may be overcome by the strength of the depth cues such that the image is experienced as having physical depth. This achievement is termed trompe l’oeil
Fig. 7. Schematic of the three-level processing scheme required to account for the perceptual experience of illusions such as that in Fig. 6. Differential weights from the array of depth cues (large arrow) form the input to three types of depth processing: perceived depth, pictorial depth and the cognition of physical depth (or physical distance structure). These depth encoding pro-cesses in turn feed the estimation of three aspects of 3D shape processing: depth shape, 2D frontal shape and projected perpendicular viewpoint shape, each of which can be quantitatively assessed for the requisite psychophysical task.
In terms of the shape assessment task that is the explicit processing goal, three types are identified in the above discussion. (1) One is the assessment 3D depth shape, as for the cylinders of Johnston (1991), which depends purely on the ceived depth derived from the concatenation of the various depth cues (and per-haps others not mentioned). (2) The effects of depth variables on the assessment of 2D shape is an old issue going back to at least the Holway and Boring (1941) study of the perceived (projected, or retinal) shape of an obliquely-viewed circle. There the emphasis was on the fact that this assessment is affected not only by the perceived depth and the knowledge of the physical depth (i.e., that it is lying on a physically flat floor), but is also influenced by the perspective and other pictorial depth cues even when the perceived depth is relatively nullified by various cues to flatness, as in the case of the Shepard illusion in Fig. 6. Note that this interpreta-tion implies that the same array of initial depth cues may be processed with differ-ent weights into the perceived depth and pictorial depth compondiffer-ents of the system. (3) The final form of shape assessment is of the 3D viewpoint shape, i.e., the ‘true’ physical shape assessed from a viewpoint perpendicular to its surface. To determine this from the optic array requires a veridical assessment of its depth,
Perspec've) slant)cues)
Structural) connec'vity))
depth)cues)
Interposi'on) depth))cues)
Material) texture)
cues)
Surface) disparity) (flatness))cues)
Perceived) depth)
Pictorial) depth)
Cogni'on)of) physical)depth)
2D)shape) 3D)depth) shape)
3D)viewpoint) shape)
[image:14.595.130.459.145.387.2]and is often considered characteristic of children’s drawings and the Cubist ap-proach to 20th century painting, depicting shapes “as you know they are rather than
as you see them”. This is shown in Fig. 7 as having input from the pictorial depth component only, since it requires this level of reconstruction of the viewpoint shape, disregarding the physical form of the surface and the net perceived shape, but in practice it may have distorting influences from either or both of them. Overall, this scheme implies an extended array of quantitative studies to verify the existence of this triple scheme and the proposed interactions between them.
Cortical Organization of 3D Shape Representation
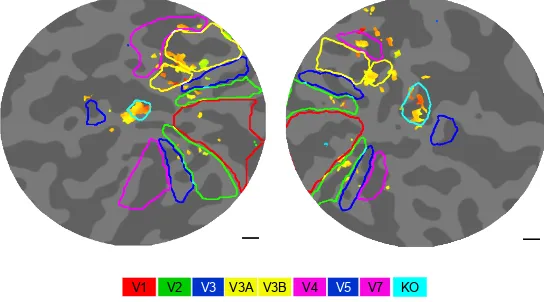
[image:15.595.162.434.490.641.2]A key question is which part of the visual hierarchy houses the neural apparatus for the various aspects of depth processing? One part of the answer is the repre-sentation of depth structure, which was provided by the results of a study of cy-clopean disparity structure by Tyler et al. (2006). An example of the activation to static bars of disparity (presented in a dynamic noise field, with a flat disparity plane in the same dynamic noise as the null stimulus) is shown in Fig. 8. Notice that the early retinotopic hierarchy delineated by the red, green and blue outlines is not differentially activated at all by this stimulus contrast, implying that it is equal-ly activated by both the test and null noise fields, regardless of the presence of disparity structure. The only patches of coherent activation (at the required statis-tical criterion level) are in the dorsal retinotopic areas V3A and V3B and in lateral cortex posterior to V5, in a cortical region identified as KO by the standard local-izer for kinetic borders (Van Oostende et al., 1997). Not shown here is the control stimuli for several kinds of luminance-defined borders, which did not activate KO but did activate the V3AB complex.
Fig. 8. Functional MRI flatmaps of the posterior pole of the two hemispheres of a typical subject showing the synchronized response to stereoscopic structure (yellowish phases) localized to fo-vealV3A/B (yellow outlines) and area KO (cyan outlines). (From Tyler et al., 2006)
V3 V5
V2 V3A V4 V7 KO
Why should the same area be activated by both motion-defined borders and (static) disparity-defined borders, but not luminance-defined borders? If it were responsive to border structure per se, it should respond to all three types of bor-ders, but that is the role played by the V3AB complex (as was also the case for purely dynamic texture-defined borders (Likova and Tyler, 2003). The KO region, on the other hand, was only activated by the motion- and disparity-defined bor-ders, which have neither motion nor disparity in common between them. Howev-er, the factor that they do have in common is perceived depth structure, since the motion-defined borders usually elicit a strong percept of depth separation between the two directions of motion. We are justified in concluding that this particular region of the lateral occipital complex is specialized for the processing of per-ceived depth structure per se (as distinct from motion structure, disparity structure or luminance structure). For this reason, we have proposed renaming it the Occipi-tal Depth Structure (ODS) region. What role it plays in 3D shape processing, and how it relates to the stages delineated in Fig. 6, however, remain to be determined.
Conclusion
propor-tions into the same shape descriptor. It is not the goal of the present remarks to at-tempt to resolve either the dimensionality or the neural processing structure of the domain of ‘3D shape’, but to point out that it seems to be a large-scale problem that few have attempted to address, and perhaps to stimulate further efforts in this direction.
Acknowledgments
Supported by FA9550-09-1-0678.
References
Chum O, Philbin J, Sivic J, Isard M, Zisserman A (2007) Total recall: Automatic query
expan-sion with a generative feature model for object retrieval. In Proc. ICCV, 2007.
Gerrits HJ, Vendrik AJ (1970) Simultaneous contrast, filling-in process and information
pro-cessing in man's visual system. Exp Brain Res 11:411–30.
Gregory RL (1963) Distortion of visual space as inappropriate constancy scaling. Nature
199:678-80.
Grossberg S, Kuhlmann L, Mingolla E (2007) A neural model of 3D shape-from-texture:
multi-ple-scale filtering, boundary grouping, and surface filling-in. Vision Res 47:634-72
Grossberg S, Yazdanbakhsh A (2005) Laminar cortical dynamics of 3D surface perception:
strat-ification, transparency, and neon color spreading. Vision Res 45:1725 1743.
Hess RF, Holliday IE (1992) The coding of spatial position by the human visual system: Effects
of spatial scale and contrast. Vision Res 32:1085-1097.
Hibbard PB (2005) The orientation bandwidth of cyclopean channels. Vision Res 45:2780-5.
Holway AE, Boring EG (1941) Determinants of apparent visual size with distance variant. Amer
] Psychol 51:21- 37.
Johnston EB (1991) Systematic distortions of shape from stereopsis. Vision Res 31:1351–1360.
Julesz B (1971) Foundations of Cyclopean Perception. University of Chicago Press, Chicago.
Kontsevich LK, Tyler CW (1998) How much of the visual object is used in estimating its
posi-tion? Vision Res 38:3025-3029.
Levi DM, Klein SA, Wang H (1994) Discrimination of position and contrast in amblyopic and
peripheral vision. Vision Res 34:3293-313.
Likova LT, Tyler CW (2003) Peak localization of sparsely sampled luminance patterns is based
on interpolated 3D surface representation. Vision Res 43:2649-57.
Marr D (1982) Vision: a Computational Investigation into the Human Representation and
Pro-cessing of Visual Information. W.H. Freeman and Company, NY.
Morgan MJ, Watt RJ (1982) Mechanisms of interpolation in human spatial vision. Vision Res
25:1661-74,
Ovsjanikov M, Bronstein AM, Bronstein MM, Guibas LJ (2009) ShapeGoogle: a computer
vi-sion approach for invariant shape retrieval, Proc. Workshop on Nonrigid Shape Analysis and
Deformable Image Alignment (NORDIA), 2009.
Papert S (1964) Stereoscopic synthesis as a technique for locating visual mechanisms MIT
Quar-terly Progress Report 73:239-243.
Paradiso MA, Nakayama K (1991) Brightness perception and filling-in. Vision Res 31:1221-36.
Regan D, Hamstra SJ (1994) Shape discrimination for rectangles defined by disparity alone, by
Scarfe P, Hibbard PB (2006) Disparity-defined objects moving in depth do not elicit
three-dimensional shape constancy. Vision Res 46:1599-610.
Schumer RD, Ganz L (1979) Independent stereoscopic channels for different extents of spatial
pooling. Vision Res 19:1303-14.
Tyler CW (1974) Depth perception in disparity gratings. Nature 251:140-142.
Tyler CW (1975) Stereoscopic tilt and size aftereffects. Perception 4:187-192.
Tyler CW (1983) Sensory processing of binocular disparity. In, Basic and Clinical Aspects of
Binocular Vergence Eye Movements. Schor C.M., Ciuffreda K.J. (Eds.), Butterworths, 199-295.
Tyler CW (2006) Spatial form as inherently three-dimensional. In Seeing Spatial Form, Jenkin
MRM, Harris LR (Eds). Oxford University Press: Oxford, 67-88.
Tyler CW (2011) Paradoxical perception of surfaces in the Shepard tabletop illusion.
i-Perception 2:137–141.
Tyler CW, Kontsevich LL (1995) Mechanisms of stereoscopic processing: stereoattention and
surface perception in depth reconstruction. Perception 24:127–153.
Tyler CW, Kontsevich LL (2001) Stereoprocessing of cyclopean depth images: horizontally
elongated summation fields. Vision Res 41:2235-43.
Tyler CW, Likova LT, Kontsevich LL, Wade AR (2006) The specificity of cortical area KO to
depth structure. NeuroImage 30: 228-38.
Van Oostende S, Sunaert S, Van Hecke P, Marchal G, Orban GA (1997) The kinetic occipital
(KO) region in man: an fMRI study. Cereb Cortex 7:690-701.