The Suitability of N, to Replace SF
6
in a Triggered
Spark-Gap Switch for Pulsed Power Applications
G. Stewart, M.P. Wilson,LV.Timoshkin, M.J. Given, S.J. MacGregor Dept. EEE, University of Strathclyde, Glasgow, UK
M.A. Sinclair, K.J. Thomas AWE Aldermaston, Reading, UK
Abstract-Thehigh dielectric strength of sulphur hexafluoride
(SF6) when compared with other gases, coupled with safety
benefits such as non-flammability and non-toxicity, has seen the
widespread use of SF6 for the insulation of switching
components. However, SF6is now widely recognised as a highly
damaging greenhouse gas, and investigations of the switching
properties of alternative gases to replace SF6within the bounds
of existing system topologies are required. In the present paper, a comparative study has been carried out on a triggered spark-gap of type presently deployed in industrial pulsed-power
machines, to determine the suitability of nitrogen (N2) to replace
SF6 as the switching medium, without compromising on
functionality. Experiments were performed with fast-rising
trigger pulses to minimise the delay time to breakdown and jitter, and three distinct operational regimes have been identified for both gases as the pressure inside the switch is increased. The static breakdown characteristics and upper pressure boundaries of operation have been determined for both gases at a range of de charging voltages. Measurements of the time to breakdown
have shown jitters as low as 1.3 ns when operating in N2,
highlighting the potential of N2to replace SF6without the need
for re-design or replacement of the presently used switch.
Index Terms-Dielectric breakdown, gas insulation, jitter,
nitrogen, pulse power system switches, SF6'spark gaps.
L INTRODUCTION
Like gas-insulated switchgear [1] and some transformers [2] and circuit breakers [3] in the power industry, high-voltage switching components throughout the pulsed-power industry are generally insulated with sulphur hexafluoride (SF6) . The high-dielectric strength of SF6 when compared
with other gases, coupled with safety benefits such as non-flammability and non-toxicity, has lead to the widespread use of SF6 for the insulation of switching components, both
internally as a switching medium and externally to prevent flashover and external breakdown events. However, SF6 is
now widely recognised as a highly damaging greenhouse gas, and it looks increasingly likely that legislation may be implemented to force the eventual replacement of SF6with a
more environmentally friendly alternative.
In the case of future systems where the design phase has yet to be entered, the system could be designed using air as an external insulation, albeit at the expense of a larger-volume system, or oil-insulated to maintain a compact system design, and with switches designed to use an alternative working medium. For existing components and systems however, any legislation forbidding the use of SF6 could necessitate a
complete re-design and replacement of switching
components. Considering the case of Mogul-D [4], a 280-tonne pulsed-power machine used for flash X-ray radiography at AWE Aldermaston, this could necessitate the replacement of tens of existing triggered spark-gap switches in the Marx generator section of the pulse-forming network, that have been designed to operate in SF6. Investigations of the
switching properties of alternative gases to replace SF6within
the bounds of the existing system topology are therefore required.
Triggered spark-gap switches are usually designed in two main forms: mid-plane spark gaps, where the trigger electrode, usually in the form of a ring with a sharp edge to provide field enhancement, is located halfway between two main electrodes; and spark gaps with the trigger electrode located within the earthed main electrode. Such switches are used in synthetic test circuits in the power industry to test high-voltage circuit breakers [5].
Osmokrovic et al. [6] have previously performed tests on both types of spark gap discussed above, and found that the characteristics of the trigger pulse are just as important as spark-gap topology for these types of switch. Measurements were taken for different triggering conditions in vacuum, nitrogen (N2), and SF6. Delay times were measured by monitoring the voltage waveform on the trigger electrode, and both the delay time and statistical dispersion of the delay time were found to decrease with increasing rate-of-rise of the trigger pulse in all three switching media. Different electrode materials were tested and the authors concluded that the mid-plane spark gap, with copper electrodes and operating in SF6,
offered superior performance in terms of overall switching characteristics.
The objective of the present work was to compare the switching characteristics ofN, with those of SF6, when used
as the working medium for a mid-plane triggered spark gap of the type used in AWE's Marx generators, to determine the suitability of N2to replace SF6, preferably without the need for re-design or replacement. The breakdown mechanisms involved in closing of a mid-plane spark-gap switch are discussed in [7].
Important switching characteristics include the rate of voltage collapse between the main electrodes, the delay time to breakdown, and the jitter in the delay time (Le. the standard deviation of the time to breakdown between repeated switching events). Due to the number of switches involved in AWE' s Marx generator systems, and the fact that they are all required to close almost simultaneously to ensure that the
Marx generator produces the optimal output for X-ray pulse generation, the jitter in the delay time to breakdown was investigated as the most significant switching parameter to be compared for each gas.
Type
~
CURSOR M Pos: n OOns
IBIReady
Tek .n,
oj.
by the same 100-kV de supply and charging resistor arrangement, with the charging voltage monitored using the de voltage divider and multimeter. Trigger pulses were supplied to the central trigger electrode via an inverting, double-Blumlein arrangement. The Blumlein was charged by a 50-kV, Glassman high-voltage de supply, via another 33 Mn, oil-immersed, charging resistor chain, and switched via a Samtech Ltd. PCS(S)-O1 self-closing switch. The inter-electrode gap on this switch was - 9mm, giving a self-breakdown voltage of 25 kV when insulated by atmospheric air. The input impedance of the generator is 500. and the output impedance is 2000., meaning that an output pulse of 4x the magnitude of the de charging voltage can be achieved into an open circuit load. The design and construction of the generator is described in [8].
The trigger pulse voltage waveform was monitored using a Samtech Ltd. DE(LRP)-O1 liquid-resistive voltage divider, capable of measuring voltages of up to 300 kV, with a response time of <5 ns. The waveform of the trigger pulse voltage is shown in Fig. 3. The delay time to breakdown was measured as the time difference between the application of
Fig. 2. Schematic diagram of the circuitry used for delay time to breakdown measurements. "Self Break Switch" is PCS(S)-Ol
self-c~o~ing switch; "Copper Sulphate Divider" is DE(LRP)-02 voltage divider; "Current Probe" is DE(CP)-Ol resistive current shunt; and "Voltage Probe" is custom-built de voltage divider.
IVoltageprobel
Rc
II. EXPERIMENTAL ARRANGEMENT
To provide a baseline to allow comparisons to be made, an existing AWE switch was first characterised using SF6as the
working medium. Tests were then performed using N2as the
working medium for comparative purposes . Three types of measurement were conducted to provide information about the switching characteristics in both SF6and N2: the first type
involved finding the static breakdown (de hold-off) voltages associated with breakdown of one half of the symmetrical switch (trigger electrode earthed) at a range of pressures for each gas; the second involved determining triggering regimes and upper boundary pressures of operation ; and the third involved determining the jitter in operation at a range of pressures and de charging voltages. Although the switches are usually oil-immersed at AWE to prevent external breakdown events, lower values of de charging voltage and trigger pulse magnitude used in the present paper allowed the switch to be operated in atmospheric air.
A schematic diagram of the circuitry for de hold-off measurements is shown in Fig. 1. The upper main electrode was charged by a 100-kV, Glassman high-voltage de supply, via a 33-Mn, oil-immersed, charging resistor chain (R). Both the lower main electrode and the central trigger electrode were connected directly to earth for these measurements, and the voltage from the de supply was increased until self-breakdown of the gas in the gap between the upper main electrode and the trigger electrode occurred . The charging voltages were monitored by a custom-built 10,000:1 de voltage divider (R, & R2) , with the output
connected via a BNC connector to a digital multimeter (DMM).
The circuit shown in Fig. 2 was deployed for jitter measurements. The upper main electrode was again charged
CH2 \. -680mV CH2 1.00V M 2S.0ns
Source
m
Delta 3.24V Cursor 1
-3.24V Cursor 2
O.OOV
[image:2.595.314.539.58.220.2]Fig.1. Schematic diagram of the circuitry used for static breakdown (de hold-oft) measurements.
[image:2.595.51.275.536.697.2] [image:2.595.335.518.562.692.2]Fig. 5. Typical trigger pulse voltage and current waveforms obtained
for switching in SF6• Fig.5a: low-pressure regimes; Fig.5b:
intermediate-pressure regimes; Fig. 5c: high-pressure regimes;
Fig. 5d: no breakdown of switch. Note the varying time-base to shown the detail in each section of the figure.
CH1\.-640mV
CHl\.-800m'" CH12.fJO\1 CH2 5.0011 M100ns
CHl ".OOV [ HZ ...ow M 2SOns
amplitude of -75 kV. Two diagnostic tools were utilised: the Samtech DE(LRP)-Ol voltage probe, to measure the trigger pulse voltage waveform; and the Samtech DE(CP)-Ol current shunt, to measure the current flowing through the switch to earth. The full test circuit was as shown in Fig. 2.
Operation was first characterised in SF6,and the first sharp
rise in the current trace in Fig. 5a indicates breakdown occurring between the main electrodes, i.e. switch closure. It is apparent that breakdown has occurred on the rising edge of the trigger pulse, and this type of behaviour was witnessed in low-pressure regimes. As the gas pressure is increased, breakdown occurs after the trigger pulse has reached its peak amplitude, as the time between application of the trigger pulse and switch closure (i.e. the time to breakdown) increases. This behaviour in the intermediate-pressure regime is shown in Fig. 5b. Switching behaviour in high-pressure regimes is illustrated in Fig. 5c, where there is a long delay time between the application of the trigger pulse and closure of the switch,
CH12.00ll [ HZ S.OOV M2S.00s
Tek J} lBIReady
I4 tiOn
-~
' scoce ~Oint Of breakdown p,",I Button
'~~
Ft'
628.3kHz,~.::~"
+iii
Cursor' Select
, -1~ f ~
C Cursor 2 d Abou1
1.580JJ! Save An
Te k Jl.. lSIRNdy MPos:76.0l:Jns MSO R"ek JL ~ Re~ MPos: 152.1:KIS ClJ!SOO
+
!
Ii&l
+I ~current
traceUl5
,
~ ~J~1~~!At,~ '::." ~
~67~, ~1t'5?
• ",""H,i
'''i,~.~ \" ""., ,.,"',
A~ I~II\ ~ O.OOOs 0.0001
a PVVII h
the trigger pulse and current flowing to earth, monitored using a Samtech Ltd. DE(CP)-Ol resistive current shunt. The jitter in the delay time was then calculated, following the accepted defmition, as the standard deviation of the time to breakdown, with ten measurements taken for each data point. The trigger pulse and current waveforms were monitored using a Tektronix TDS2024 , 200 MHz, 2
oss,
digital storage oscilloscope, and recorded using the built-in flash drive.III. EXPERIMENTAL RESULTS
A. Static Breakdown Characteristics
The self-breakdown voltages of one half of the spark-gap switch were measured using the experimental arrangement shown in Fig. 1, to determine the relative de hold-off characteristics of the switch operating in both SF6 and N2• The switch was filled to the desired pressure for the gas to be tested, and the de supply voltage was increased until breakdown occurred, with the charging voltage reading being obtained from the multimeter display . The results displayed in Fig. 4 are for the application of positive de voltages . Three measurements were taken for each data point, and the results represent the mean values . As expected, the static breakdown voltage (Vs) increases linearly with increasing pressure for
both gases, and the gradient of the SF6curve in Fig. 4 is much
steeper than the N2curve, which implies that the switch will
need to be operated at higher gas pressures in N2• At
pressures where measurements could be made in both gases, the de hold-off of the switch when insulated with SF6 was
about 2.2 times greater than that when insulated with N2•
B. OperationalRegimes
On triggered operation of the complete switch in both gases, three distinct operational regimes were found, as indicated by the waveforms shown in Fig. 5 (SF6) and Fig. 6
(N2)' The waveforms shown in both of these figures were
obtained with a constant dc charging voltage of +50 kV applied across the main gap, and constant trigger pulse
Vs ~87. 9 P +10.8 ...SF6
./"N
z/
. /
J'
. /
Vs~34.5P + 8.3r
/
/
r:
.
CUlSOO
Type
lliill
DeI1" 8M00>
11.63MHr
CH1\.-64OhW
CH1\.-1.04\l
MPos: ~6.Ons SA'lEIPlC
Action
-I!iiI ~Ointof breakdown, "'NTButton3~S (
iii
.. 3.0l%MHz ..
Cursor' Stlect
-4.OOOos Foidef
~ror2 d ~
320.Ohs Save AI
CH1'\-120m'" CH12.00't' CH2 5.00'" M100ns
Tek .l\.
c
CH12.00I/ CH2 2.00v M 11)(lm
2 1.5
Absolu te Pre ssure, P (bar) 0.5
o o
~ 70
~60
,;
H50
~c 40
~ ~ 30
~
ee 20
."
S'" 10
[image:3.595.310.536.518.677.2]80
Fig. 4. Static breakdown (de hold-oft) voltages (Vs) versus absolute
pressure (P) for breakdown of one half of switch in both SF6(closed
squares) and N2 (closed triangles). The equations of the best-fit
straight lines are shown for both gases.
Fig. 6. Typical trigger pulse voltage and current waveforms obtained
for switching in N2. Fig. 6a: low-pressure regimes; Fig. 6b:
intermediate-pressure regimes; Fig. 6c: high-pressure regimes;
[image:3.595.50.275.530.683.2]Fig. 8. Average time to breakdown (t) versus absolute pressure (P) for operation in SF6with the upper main electrode charged to a de voltage
of 40 kV. An exponential function has been fitted to the data, and the equation is shown.
before application of the trigger pulse.
Ten breakdown events were analysed for each pressure, and the data points shown in Figs. 8 and 9 correspond to the average (mean) time to breakdown. The calculated jitter is represented by the error bars shown in Figs. 8 and 9, and the ± values quoted in the following analysis.
Fig. 8 shows that the average time to breakdown in SF6
increases exponentially with gas pressure, and varies from 10.8±1.7 ns at 0.4 bar to 42.6±1.6 ns at 0.7 bar. The values of jitter are very low, varying from 1.6-3.0 ns, with the lowest value of jitter being obtained at the highest pressure. The measurement range is limited due to self-closing of the switch at lower pressures, and non-operation at higher pressures.
A similar exponential relationship is observed for switching in N2, as shown in Fig. 9. The average times to breakdown were longer than those observed in SF6, partly due to the higher operating pressures required for the same level of de charging voltage, and the time to breakdown varied from 21.2±2.4 ns at 1.8 bar to 113.2±10.1 ns at 3.2 bar. The values
!
1 =1.77e44 71' / SF6
/
/ '
. / !
. Y
. - - - - .L
~
Absolute Pressure, P (bar)
0.8 0.7
0.6
0.5
0.4
,S, 40
,; 35 ~
'C 30
""
1
25;: 20 ~ ~ 15
~ 10
~ 5 o
OJ
50
45
which is indicated by the transient in the current waveform some 1.5 us after the trigger pulse begins to rise. This long delay time means that switch closure occurs after the trigger pulse voltage has risen to its peak and fallen to zero, and in this regime the switch is verging on the point of non-operation. With further increase of the gas pressure, the switch fails to close, as indicated in Fig. 5d.
The waveforms displayed in Fig. 6 show that the same three switching regimes were observed when operating in N2, albeit at higher operational pressures in each regime. The difference in pressure for the three different regimes when operating in N2 as compared with SF6 is discussed in
section C.
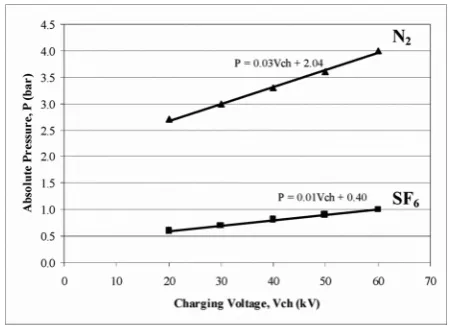
On establishment of these different operating regimes, measurements were performed to find the upper pressure boundary at which the switch could be reliably triggered (switch closure occurring every time triggering is attempted), and the results for a range of dc charging voltages in both SF6
and N2are displayed in Fig. 7. As expected due to the higher-dielectric strength of SF6,it is apparent that the gradient of the
N2curve is greater than that of the SF6 curve, and the upper
boundary pressure varies over a range of 1.3 bar in N2, compared to a range of 0.4 bar in SF6 for the same range of applied de charging voltages.
C. Operational Jitter
The circuit shown in Fig. 2 was used to measure the time to breakdown, again by analysing the trigger pulse voltage waveform and the current flowing to earth to determine the time difference between application of the trigger pulse and switch closure. For the results reported here, the de charging voltage was 40 kV, and the results pertaining to static breakdown voltages (Fig. 4) and upper pressure boundaries of operation (Fig. 7) were used to determine a range of operating pressure within which breakdown would occur upon application of each trigger pulse, but without self-breakdown of the gas occurring due to the high dc charging voltage
N
z~
p~O.OIVch+0.40 SF
6
.
-.
-
I-I=3.30e1.061'
/ '
N
z/ l
~
.:»>
4.5 4.0
~ 3.5
~
..c
0:: 3.0
,;
~ 2.5
~
c: 2.0
~
.; 15
1]
-e 10
0.5
0.0
o 10 20 30 40 50 70
140
~
.s
-
120,;
~ 100
0
'C
""~ 80
al ;: 60
e
1= 40
~ ~ 20
>
-.:
o
1.5 2.0 2.5 3.0 3.5
[image:4.595.49.278.516.679.2]C h ar gi ng Voltag e, Vc h (kV) Absolute Press ure, P( bar)
Fig. 7. Boundary pressures of operation (P) versus de charging voltage (Vch) in both SF6(closed squares) and N2(closed triangles).
The equations of the best-fit straight lines are shown for both gases.
Fig. 9. Average time to breakdown (t) versus absolute pressure (P) for operation in N2with the upper main electrode charged to a de voltage
[image:4.595.311.536.518.683.2]ofjitter were again very low, and similar to those observed in SF6• In the pressure range 1.8-2.8 bar, the jitter values were
all below 2.5 ns, with a minimum jitter of 1.3 ns at 2.0 bar. At higher pressures, the jitter increased to 6.1 ns at 3.0 bar and 10.1 ns at 3.2 bar, as the breakdown mechanism varied between inter-mediate pressure and high-pressure switching regimes.
Present environmental pressures mean that this is a significant result towards the replacement of SF6with a more
environmentally friendly alternative, within the bounds of an existing switch design.
Future work will include analysis of the voltage collapse across the main electrodes at breakdown, and analysis of the relative switching performance of other gases and gas mixtures in the present switch topology.
IV. DISCUSSION& CONCLUSIONS
ACKNOWLEDGEMENTS
REFERENCES
[1] S.Okabe, 1. Takami, and T. Tsuboi, "Breakdown voltage-time characteristics and insulation testing of gas insulated switchgear,"IEEE Trans. Dielectr. Electr. Insul.,vol. 15 (3), pp. 741-748,2008.
[2] K. Hiraishi, Y. Uwano, K. Shirakura, Y. Gotanda, M. Higaki, K. Endoo, M. Horikoshi, K. Mizuno, H. Hora, "Development and practical operation of perfluorocarbon immersed 275kV transformers with compressed SF6gas insulation,"IEEE Trans. Power Del.,vol. 10
(2), pp. 880-888, 1995.
[3] F. Buret, A. Beroual, "SF6dielectric behaviour in a high voltage circuit
breaker at low temperature under lightning impulses," IEEE Trans. Power Del.,vol. 11 (1), pp. 267-273, 1996.
[4] A. Stevens and M. Sinclair, "Mogul-D Marx generator upgrade and predicted output," lEE Pulsed Power Symposium 2005, pp. 22/1-3, 2005.
P. Osmokrovic, N. Arsic, Z. Lazarevic, and D. Kusic, "Numerical and experimental design of three-electrode spark gap,"IEEE Trans. Power Del.,vol. 9 (3), pp. 1444-1450, 1994.
[6] P.Osmokrovic, N. Arsic, Z. Lazarevic, and N. Kartalovic, "Triggered vacuum and gas spark gaps," IEEE Trans. Power Del., vol. 11 (2), pp. 858-864, 1996.
[7] H. Tang and V. Scuka, "The breakdown mechanism of a mid-plane triggered spark gap trigatron," IEEE Trans. Dielectr. Electr. Insul.,
vol. 3 (6), pp. 843-848, 1996.
[8] I.C. Somerville, SJ. MacGregor, and O. Farish,"Anefficient stacked-Blumlein HV pulse generator,"Meas. Sci. Technol.,vol. 1 (9), pp. 865-868, 1990.
The experimental work was conducted by G. Stewart as an individual undergraduate project during the 4th year of his MEng degree in Electrical & Mechanical Engineering. G. Stewart and M.P. Wilson thank AWE Aldermaston for fmancial support of the study.
A triggered spark-gap switch, of type presently employed in large-scale industrial pulsed-power machines, has been characterised in terms of static breakdown voltages, switching regimes, and jitter in the delay time to breakdown. Tests were conducted on a comparative basis, to determine the potential to replace the now widely recognised greenhouse gas SF6with N2•
For the fast-rising trigger pulses utilised in the study, three distinct operating regimes have been discovered in both gases: low-pressure regimes where switch closure occurred on the rising edge of the trigger pulses; intermediate-pressure regimes where the trigger pulse reached its peak magnitude before switch closure occurred; and high-pressure regimes where switch closure occurred after a significant time delay, after the trigger pulse had reached its peak amplitude and fallen back to zero.
Measurements have shown that while the delay times to breakdown in N2 are longer than those in SF6, partly due to the higher operating pressures required for the same level of [5] dc charging voltage, the jitter was very similar in both gases when operating in the correct regime. Jitter levels as low as 1.3 ns were observed in N2, highlighting the potential to