Athens, 8-11 July, 2015 © IC-EpsMsO
ANALYSIS ON NUMERICAL SIMULATIONS OF CO2 ABSORPTION PROCESS
OF CARBON SOLIDIFICATION SYSTEM
Peilin Zhou1 and Haibin Wang2*1- Professor of MarineEngineering 2- PhD candidate of Marine Engineering
Department of Naval Architecture, Ocean and Marine Engineering, University of Strathclyde Henry Dyer Building, 100 Montrose Street, University of Strathclyde, G4 0LZ, Glasgow, UK
*E-mail address: [email protected] Keywords: Marine emission control, CFD simulation, Absorption.
Abstract. Carbon dioxide (CO2) emission control has been a popular topic since global warming affects our living conditions on the planet. Carbon Capture and Storage (CCS) is a feasible solution for mitigating the global warming effect by capturing the CO2 from power stations and industrial processes and storing them underground. There are great many of active CCS projects onshore. International Maritime Organization (IMO) has adopted guidelines for CO2 emission control by improving ship energy efficiency. The project is aiming to apply CCS on ships by capturing the CO2 emission from the engine exhaust gases and solidifying them for easy storage. It will enable ships to comply with various regional and international CO2 emission regulations and also maintain the efficiency of waterborne transportation. The simulation of carbon absorption develops and investigates the multiphase reaction model in CFD software, focusing on bubble column effect with chemical reaction. This paper presents the analysis of the numerical simulation of the CO2 absorption process. Simulation results illustrate the pressure distribution of solution and gas path and velocity in solution. This numerical simulation results also indicates the impact of environment temperature on chemical reaction rate. A comparison between experiment and simulation results is presented to figure out the impact of initial NaOH solution concentration on gas absorption process. An optimized NaOH solution concentration is figured out and will be used for further practical design of absorption system for ships.
1. INTRODUCTION
Greenhouse gases (GHG) are the main reason for climate change. It leads to many of disasters to our human beings. Melting glaciers, rising sea levels and extinction of endangered species keep impacting our living conditions on the earth. These phenomena are resulting from the temperature rising continuously due to the thermal insulation effect of GHG. The heat received by earth cannot be rapidly released into the space and resulting in global warming. The GHG emission has to be reduced in order to guarantee the safety of our planet in the future. There are many kinds of GHG existing, such as carbon dioxide (CO2), methane, nitrous oxide and fluorinated gases. Among all the
GHG, presented in Figure 1, CO2 is the most influential one, which contributes 76.7% of the anthropogenic GHG
emissions to atmosphere [1]. Nowadays, there are a large number of research projects focusing on different methods
to mitigate the effect of global warming by reducing CO2 gas emission. One of the most effective and popular
methods is the carbon capture and storage (CCS). CCS is considered to be an effective way to mitigate and even eliminate the global warming effect through capturing the CO2 emission and storing them underground for Enhanced
Oil Recovery (EOR) or in deep seas [2]. However, CCS system currently is only applied on onshore power plants and
some industrial processes. There are few marine applications. About 1046 million tons of CO2 emission is estimated
from shipping and 870 million tons are contributed by international shipping in 2007 [3]. Although it is about 2.7% of
the global CO2 emissions, International Maritime Organization (IMO) has already taken actions to reduce GHG
emissions from ships, such as EEDI, EEOI and SEEMP, aiming to increasing the energy efficiency of ships [4].
By the end of the 2012, there have been 16 active CCS industrial projects on shore [5]. Det Norske Veritas (DNV)
has launched projects on maritime CCS applications and a report has indicated that, with CCS applications on ships, CO2 emission can be reduced by 65% [6]. It also proves that CCS is not only an excellent supplement of energy
improvement methods but also an effective CO2 emission reduction method. From previous work of the authors, it
indicates the feasibility of proposed CCS method to reduce marine CO2 emission by separating and storing them in a
solid form on ships. Case study have illustrated the proposed solidification processes is more cost effective than the traditional liquefaction method for CO2 storage onboard.
This paper presents the experiment conducted to estimate the effects of various factors on the CO2 absorption
results with that of simulation are also presented, leading to optimized operational factors for CO2 absorption. The
[image:2.612.171.452.110.243.2]numerical simulations will provide fundamentals of the design of a proto-type demonstration system on ships.
Figure 1. Contributions of different GHG gases to global emissions
2. CARBON SOLIDIFICATION PROCESSES
Carbon solidification processes only deal with part of exhaust gases from marine engines as the target is to comply with various regional and international CO2 emission regulations. Part of the exhaust gas is firstly bypassed
into a separation system to separate CO2 gas from other species in the exhaust gases. There are many separation
systems available to achieve the separation so this paper will focus on the processes dealing with concentrated CO2
gas after the separation. The concentrated CO2 gas after separation is fed into a reaction tank which contains alkaline
solution. Following the absorption of CO2 by the alkaline solution, calcium oxide (CaO) is added to solidify the
CO32- ions from the solution. The chemical reaction processes are presented below by Eqs. 1 and Eqs. 2[7][8]:
CO2 (g) + 2NaOH (l) = Na2CO3 (l) + H2O (l) - ΔH1 (1)
Na2CO3 (l) + Ca(OH)2 (s) = CaCO3↓(s) + 2NaOH (l) -ΔH2 (2)
There are two intermediate reactions containing in the above processes shown in Eqs. 3 and Eqs. 4 [9][10]:
CO2 (g) + 2H2O (l) = HCO3- + H3O+ - ΔH3 (3)
CaO (s) + H2O (l) = Ca(OH)2 - ΔH4 (4)
Sodium hydroxide (NaOH) solution is selected as the absorbent because it naturally reacts with acid gas (CO2,
SO2 and NO2). After sodium carbonate (Na2CO3) is generated, CO2 is captured in the form of CO32- ions in solution.
After adding in CaO, it firstly reacts with water to generate calcium hydroxide (Ca(OH)2). When Ca2+ meets with
CO32- in the solution, sediment calcium carbonate (CaCO3) is produced. The sediments are separated from the
solution and then dried for storage on ship. The sediment will be discharged off ship at end of a voyage in port. Calcium carbonate can be traded to a buyer as industrial materials afterwards. NaOH solution is regenerated during the precipitation (Eqs. 2) and can be reused as absorbent in the process in Eqs. 1.
3. SIMULATION METHODOLOGY
Chemical process comprises two main components: species transportation and multiphase flow. To simulate a chemical process with CFD tools, both components should be considered. Species transportation is considered in the numerical simulation by transferring masses, energy and momentum of reactants into products. Multiphase flow is simulated as bubble column effects due to the mixing of liquid and gas of reactants. CO2 and air are in a gas phase
and NaOH and Na2CO3 solutions are in liquid forms.
ANSYS Fluent [11] solves conservation equations for chemical species by predicting the local mass fraction of
each species, through the solution of a convection-diffusion equation for specified species as shown in the following:
Yi
vYi
Ji Ri Sit
(5) where Yi is the local mass fraction of each species. Ri is the net rate of production of species i by chemical
reaction and Si is the rate of creation from the dispersed phase and sources. Ji is the mass diffusion flux. 𝑣⃗ is the
overall velocity vector (m/s). t represents time and ρ is the density of species.
For an Eulerian multiphase model, the concept of phasic volume fractions is introduced and the volume of one phase can be defined as:
V
V
adV (6)The continuity equation for phase q is: 1
1
(
)
(
)
(
)
q nq q q q pq qp
p rq
a
a
v
m
m
t
(7)where ρrq is the phase reference density;vq is the velocity of phase q; mpqis the mass transferred from the phase
p to q and mqpis the mass transferred from phase q to phase p.
The conservation of momentum for a fluid phase is:
1
( )
N
q q q q q q q q q q pq p q pq pq qp qp
p q
p g
a v a v v a a K v v m v m v
t F
(8)where ρ is the density; p is the pressure shared by all phases; g is gravitational acceleration, K is the momentum exchange coefficient between fluid phases and
F
is external force on phase. is the stress-strain tensor of qth phase:
2 3T
q aq q vq vq aq q q v Iq
(9) where μq and λq are the shear and bulk viscosity of phase q and I is the unit tensor.
Reaction rate, k, between phases is estimated by using Arrhenius expression: kAT e E RT/
(10) where A is the pre-exponential factor; T is the temperature of reactants; β is the temperature exponent; E is the activation energy for reaction and R is the universal gas constant.
The surface tension is involved in modelling of the bubbling effect:
p 2 R
(11)
where Δpis the pressures difference between two sides of the surface; σ is the surface tension coefficient; and Ris the radius of bubbles.
Wall adhesion is also considered for bubbling effect and the surface normal at the live cell next to the wall is: nˆnˆ cosw wtˆwsinw (12)
where ˆnw and tˆware the unit vectors normal and tangential to the wall; θw is the tangent angle of the gas bubbles
[image:3.612.151.476.446.558.2]or liquid droplets to the wall as indicated in Figure 2.
Figure 2. Demonstration of contact angle between gas-solution surface and wall.
4. EXPERIMENT RIG AND CFD SIMULATIONS
4.1.Experiment rig setup
Based on the principles of absorption and solidification processes introduced above, two steps of experiment are designed: chemical absorption and precipitation, and physical filtration. Figure 3 is the experiment rig and the schematic diagram for absorption processes. High purity CO2 from a gas bottle is fed into a measuring cylinder as a
reaction tank which contains prepared NaOH solution. The gas goes through a gas regulator and a flow meter to adjust the gas pressure and input flow rate. Fitted with a pipe, a gas diffuser is installed to generate gas bubbles in order to increase the contact area between gas and solution. The mass changes of CO2 bottle and measuring cylinder
are monitored and measured by two scales for the measurements of CO2 gas supplied from gas bottle and absorbed in
Figure 3. Experiment rigs and schematic chart of absorption processes
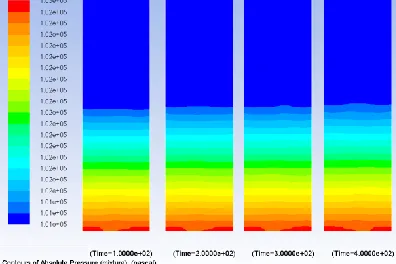
4.2.Pressure distribution
Figure 4 shows the pressure contour diagrams of the simulation which are derived from the Ansys Fluent software. The contour diagrams present how the pressure distributed and changed during the absorption process. A minor pressure fluctuation is found during the feeding and absorption. The pressure of CO2 gas at the inlet is the highest. In
order to estimate the gas pressure at the inlet, a surface monitor is applied at the inlet to monitor the real time pressure. Figure 5 gives a visual display of the variation of pressure at the gas inlet of the system. The pressure is rising at the gas inlet as time goes. The maximum pressure at gas inlet is about 102570 Pa during the absorption process. The rising of pressure over time is due to the progress of absorption reaction as explained by the following equation:
P = ρgh (13) where, ρ is the density of solution; g is the gravitational acceleration and h is the solution height.
Referring to Eqs. 13, the pressures ratio at two different times can be expressed as following:
P1/P2 = (ρ1×h1)/(ρ2×h2) (13-1)
Density can be expressed as the ratio of mass and volume. Volume is a proportional to solution height when the cross section area is constant. The equation can be expressed as:
P1/P2 = [(m1/v1)×h1]/[(m2/v2)×h2] = [(m1/h1)×h1]/[(m2/h2)×h2] = m1/m2 (13-2)
where, m is the mass of solution and h is the height of solution in column; the subscripts 1 and 2 present for different time of process.
Therefore, the pressure at gas inlet is proportional to the mass of solution in the column. Because the mass of solution is increasing as absorption progressing, the pressure at inlet is increased coordinately.
[image:4.612.212.410.478.610.2]Figure 5. Pressure variations at gas inlet over flow time
4.3.Concentration of solution
As the absorption process progressing, the solution of NaOH reacts with CO2 to generate Na2CO3. The CO2
absorbed at different time can be indicated by the mass of the solution. The increment of the mass of the solution represents the quantity of CO2 being absorbed. Since all the CO2 trapped in the solution will be in the form of ion
CO32-, the mass fraction of the Na2CO3 solution can also indicates the amount of CO2 gas absorbed. The mass
concentration of Na2CO3 at different time is presented in Figure 6. In this figure, the color code stands the mass
fraction of Na2CO3 in the solution. The color of solution turning from blue to red means the mass fraction of Na2CO3
increases from 0 to 100%. It illustrates the increase of the Na2CO3 mass fraction during the process of CO2
absorption.
Figure 6. Concentration contours of Na2CO3 in solution over flow time (at 0s, 100s, 200s, 300s and 400s).
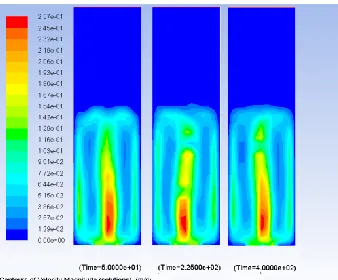
4.4.Velocity of gas and solution
Once CO2 is released from the diffuser to the solution, the gas will go upward to the free surface of the solution.
[image:5.612.201.425.346.485.2]Figure 7. Gas velocity contours over flow time (at 50s, 225s and 400s).
Figure 8. Solution velocity contours over flow time (at 50s, 225s and 400s).
4.5.Impact of operation temperature on absorption percentage
According to Eqs. 10, the environment temperature is one of the key factors affecting the reaction rate. In this section, the simulation results of absorption process under different environment temperatures will be presented. Assumption is made that the gas initial temperature is 298K.
[image:6.612.228.397.240.380.2]Figure 9 presents the simulation results under different environment temperature conditions. The range of temperature varies from 278 to 318K. Referring to Figure 9, the chemical reaction rate of the process is increasing as the temperature rises. According to Eqs. 10, the chemical reaction rate is affected by temperature. Due to heat exchange taking place between the atmosphere and the mixture of gas and solution, a high environment temperature leads to a high temperature of the mixture of gas and solution, resulting in a high reaction rate.
Figure 9. Simulated absorption rates under different operation temperatures
[image:6.612.171.457.517.643.2]the temperature is blow 298K, the time taken for a full reaction is significantly high. Therefore the environment temperature onboard ship for the system’s operation should be maintained above 298K.
Figure 10. Na2CO3 concentrations over time for different operation temperatures
4.6.Impact of initial NaOH concentration on gas absorption percentage
The effect of initial concentration of the NaOH solution on the gas absorption rate is examined under experiment scale. Gas from CO2 bottle is fed into the NaOH solutions of several different concentrations. The results of the
experiment are shown in Figure 11, compared with the simulation results. The comparison of the results indicates the simulation and experiment has a good agreement, including a similar tendency of gas absorption rate change over different initial concentrations of NaOH solution. The absorption rate of gas varies with the NaOH concentration. It reaches to the maximum value when the initial NaOH concentration is 15%.
Figure 11. Comparison of experimental and simulated gas absorption percentage with different concentrations of NaOH solution
[image:7.612.188.432.362.491.2]Figure 12. Na2CO3 concentrations over time for different initial concentration of NaOH solutions.
Figure 12 indicates CFD simulation results in the mass fraction of Na2CO3 changes over flow time under different
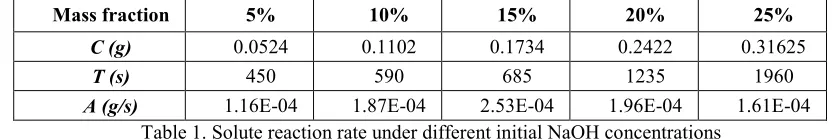
NaOH. When the initial concentration of NaOH solution is 5%, it only takes about 450s to achieve 100% of reaction (full reaction of NaOH solute). With the increase of NaOH concentration, more NaOH solute is available in the solution so the time taken to reach fully reaction becomes longer. Although the time spent for fully reaction is lowest when the concentration of NaOH solution is 5%, the actual gas absorbed is the least compared with other cases. To select the optimized initial concentration of NaOH solution, the NaOH solute reacted per second is considered. It presents the reaction rate with various concentration of NaOH solution. It can be derived with following equations:
A = C/t (14)
where, A is mass of NaOH solute reacted per second in unit volume; C is the mass of NaOH solute in unit volume of solution and t is the total time for fully reaction.
C = 1 × ρ × c (14-1)
where, ρ is the density of NaOH solution and c is the mass fraction of NaOH in the solution. Quantity 1 presents unit volume of NaOH solution. Unit volume is used to simplify the calculation as the volumes of all these cases are constant.
The NaOH solutes reacted per second for all concentration of NaOH solutions are derived and shown in Table 1. From the table, when the concentration of NaOH solution is 15%, the NaOH solute reacted per second is the highest. Together with the gas absorption rates shown in Figure 11, considering both gas absorption rate and solute reaction rate, 15% of NaOH initial concentration is an optimal value.
Mass fraction 5% 10% 15% 20% 25%
C (g) 0.0524 0.1102 0.1734 0.2422 0.31625
T (s) 450 590 685 1235 1960
A (g/s) 1.16E-04 1.87E-04 2.53E-04 1.96E-04 1.61E-04 Table 1. Solute reaction rate under different initial NaOH concentrations
5. CONCLUSIONS AND FURTHER STUDIES
This paper demonstrates the feasibility of using carbon solidification method for CO2 emission reduction from
[image:8.612.96.514.501.571.2]Acknowledgment
We are grateful to the Scottish Environmental Technology Network for providing laboratory facilities and the financial supports on the project from the Department of Naval Architecture and Marine Engineering of University of Strathclyde. Simulations results were obtained using the EPSRC funded ARCHIE-WeSt High Performance Computer (www.archie-west.ac.uk). EPSRC grant no. EP/K000586/1.
References
[1] Metz, B., O. Davidson, H. C. de Coninck, M. Loos, and L. A. Meyer (eds.) (Working Group III of the Intergovernmental Panel on Climate Change), 2007, IPCC Special Report on Carbon Dioxide Capture and Storage, Cambridge University Press, Cambridge, United Kingdom and New York, NY, USA, 442 pp.
[2] World Resources Institute (WRI), 2008, CCS Guidelines: Guidelines for Carbon Dioxide Capture, Transport, and Storage, Washington, DC: WRI. ISBN 978-1-56973-701-9. http://pdf.wri.org/ccs_guidelines.pdf
[3] Buhaug, Ø., Corbett, J.J., Endresen, Ø., Eyring, V., Faber, J., Hanayama, S., Lee, D.S., Lee, D., Lindstad, H., Markowska, A.Z., Mjelde, A., Nelissen, D., Nilsen, J., Pålsson, C., Winebrake, J.J., Wu, W., Yoshida, K, International Maritime Organization (IMO), 2009, Second IMO GHG Study 2009, London, UK, April 2009;.
[4] Marine Environment Protection Committee (MEPC), 2011, MARPOL Annex VI, Chapter IV.
[5] Global CCS Institute 2012, the Global Status of CCS: 2012, Canberra, Australia. ISBN 978-0-9871863-1-7.
http://decarboni.se/sites/default/files/publications/47936/global-status-ccs-2012.pdf
[6] DNV, 2013, DNV and PSE report on ship carbon capture & storage:
http://www.dnv.com/press_area/press_releases/2013/dnv_and_pse_report_on_ship_carbon_capture__storage.asp [7] Pflug, I.J., Angelini, P., Dewey, D.H., 1957, Fundamentals of Carbon Dioxide Absorption as They Apply to Controlled-atmosphere Storage, Department of Agricultural Engineering and Horticulture.
[8] M., Mahmoudkhani, D.W., Keith, 2009. Low-energy sodium hydroxide recovery for CO2 capture from
atmospheric air—Thermodynamic analysis, Energy and Environmental System Group, Institute for Sustainable Energy, Environment, Economy, University of Calgary, Canada.
[9] Chambers, C and Holliday, A.K., 1975, Modern inorganic chemistry-An intermediate text, Butterworth & Co (Publishers) Ltd 1975, 133pp. http://files.rushim.ru/books/neorganika/Chambers.pdf.
[10] Mohamad, H., 2009, An Overview of Lime Slaking and Factors that Affect the Process, Chemco Systems, L.P.