Nutrition and Physical Activity
Open Access
Research
Perceived characteristics of the environment associated with active
travel: development and testing of a new scale
David Ogilvie*
1,6, Richard Mitchell
†2, Nanette Mutrie
†3, Mark Petticrew
†4and
Stephen Platt
†5Address: 1Medical Research Council Social and Public Health Sciences Unit, Glasgow, UK, 2Section of Public Health and Health Policy, University
of Glasgow, Glasgow, UK, 3Department of Sport, Culture and the Arts, University of Strathclyde, Glasgow, UK, 4London School of Hygiene and
Tropical Medicine, London, UK, 5Research Unit in Health, Behaviour and Change, University of Edinburgh, Edinburgh, UK and 6Medical Research
Council Epidemiology Unit, Cambridge, UK
Email: David Ogilvie* - [email protected]; Richard Mitchell - [email protected];
Nanette Mutrie - [email protected]; Mark Petticrew - [email protected]; Stephen Platt - [email protected] * Corresponding author †Equal contributors
Abstract
Background: Environmental characteristics may be associated with patterns of physical activity. However, the development of instruments to measure perceived characteristics of the local environment is still at a comparatively early stage, and published instruments are not necessarily suitable for application in all settings. We therefore developed and established the test-retest reliability of a new scale for use in a study of the correlates of active travel and overall physical activity in deprived urban neighbourhoods in Glasgow, Scotland.
Methods: We developed and piloted a 14-item scale based on seven constructs identified from the literature (aesthetics, green space, access to amenities, convenience of routes, traffic, road safety and personal safety). We administered the scale to all participants in a random postal survey (n = 1322) and readministered the scale to a subset of original respondents (n = 125) six months later. We used principal components analysis and Varimax rotation to identify three principal components (factors) and derived summary scores for subscales based on these factors. We examined the internal consistency of these subscales using Cronbach's alpha and examined the test-retest reliability of the individual items, the subscale summary scores and an overall summary neighbourhood score using a combination of correlation coefficients and Cohen's kappa with and without weighting.
Results: Public transport and proximity to shops were the items most likely to be rated positively, whereas traffic volume, traffic noise and road safety for cyclists were most likely to be rated negatively. Three principal components – 'safe and pleasant surroundings', 'low traffic' and 'convenience for walking' – together explained 45% of the total variance. The test-retest reliability of individual items was comparable with that of items in other published scales (intraclass correlation coefficients (ICCs) 0.34–0.70; weighted Cohen's kappa 0.24–0.59). The overall summary neighbourhood score had acceptable internal consistency (Cronbach's alpha 0.72) and test-retest reliability (ICC 0.73).
Conclusion: This new scale contributes to the development of a growing set of tools for investigating the role of perceived environmental characteristics in explaining or mediating patterns of active travel and physical activity.
Published: 30 May 2008
International Journal of Behavioral Nutrition and Physical Activity 2008, 5:32 doi:10.1186/1479-5868-5-32
Received: 20 February 2008 Accepted: 30 May 2008
This article is available from: http://www.ijbnpa.org/content/5/1/32 © 2008 Ogilvie et al; licensee BioMed Central Ltd.
Background
A growing body of evidence suggests that certain charac-teristics of the physical environment may be associated with patterns of physical activity in general or with partic-ular types of physical activity such as walking or cycling as modes of transport. [1-7] Physical activity has been found to be associated with both 'objective' characteristics of the environment – such as those ascertained using observa-tions made by trained researchers, or using spatially refer-enced census and transport infrastructure data held and analysed in a geographical information system (GIS) – and with characteristics of the environment as perceived and reported by study participants. However, the cumu-lated evidence about the strength and direction of associ-ations with objective or perceived environmental characteristics is far from conclusive and is dominated by cross-sectional studies, mostly conducted in North Amer-ica and Australia. [4,6,8,9] Hypotheses about putative environmental correlates of physical activity therefore need to be tested in a wider range of settings and in longi-tudinal studies capable of establishing a temporal rela-tionship between exposure to particular environmental characteristics and consequent changes in behaviour.
We established a longitudinal study to examine changes in travel behaviour and physical activity associated with the opening of a new urban section of the M74 motorway (freeway) currently under construction in Glasgow, Scot-land. [10] In the cross-sectional (baseline) phase of the study, we wished to test the hypotheses that levels of 'active travel' (walking and cycling for transport) and over-all physical activity vary with demographic and socioeco-nomic characteristics, but not necessarily in the same way, and that these relationships may be partly explained by the perceived characteristics of the local environment in which people live – as well as by their objectively-assessed proximity to motorway and major road infrastructure. We also wished to be able to test, in the future, the hypothesis that this major modification to the urban built environ-ment will be associated with changes in active travel which may be partly explained or mediated by changes in the perceived characteristics of the local environment.
The development of valid and reliable instruments to measure perceived characteristics of the local environ-ment is still at a comparatively early stage. [3,11,12] For our purposes, it seemed important that the chosen instru-ment should satisfy three criteria. First, it should measure constructs shown (at least in some studies) to be related to physical activity in general or walking and cycling in particular and that could reasonably be expected to change as a result of the intervention. Second, it should have face validity in the local context. Third, it should be suitable for completion as part of a postal survey.
From a number of recent reviews, we identified seven con-structs that met the first criterion: aesthetics, green space, access to amenities, convenience of routes, traffic, road safety and personal safety. [1-7] However, instruments for measuring these constructs which have been validated and published typically also include items on non-modi-fiable characteristics which could not conceivably change as a result of the intervention, thereby failing our first cri-terion, or refer to irrelevant characteristics or use inappro-priate language for the urban setting in Glasgow, thereby failing our second criterion. To give two examples, the scale published by Humpel and colleagues includes one item on hilliness and four items on weather (both of which could be regarded as non-modifiable characteris-tics), and asks whether there is a lake or beach within walking distance (an irrelevant question in our study areas), [12] and the Neighbourhood Environment Walka-bility Scale (NEWS) is written in American English and asks about the presence of sidewalks, which are ubiqui-tous in Glasgow. [13] NEWS also illustrates the difficulties posed by our third criterion: in its original version it con-tains 83 items over seven pages, which we judged too long for inclusion in a 'cold-call' postal survey of the general population which also had to include instruments for measuring travel behaviour, physical activity, and health and wellbeing.
We therefore designed, piloted and established the test-retest reliability of our own instrument. In this paper, we report the development of this 'neighbourhood scale' in the context of an observational intervention study in a deprived urban population in the west of Scotland. This paper therefore underpins our companion paper, in which we report the result of our analyses of the personal and environmental correlates of active travel and physical activity (Ogilvie et al, submitted for publication), and contributes to the development of a growing set of tools which may be useful for researchers working in other set-tings.
Methods
Measures of perceived characteristics of the local environment
walking distance' (rs = 0.21), which we subsequently
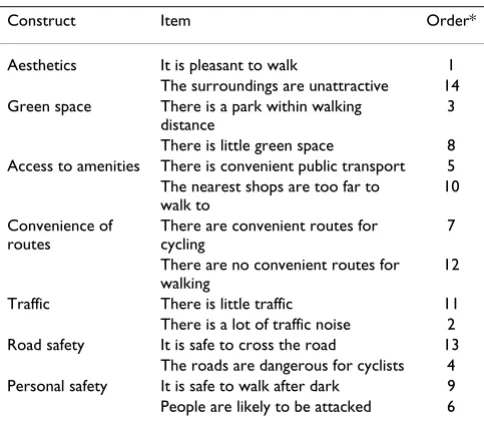
reworded to 'The nearest shops are too far to walk to'. In the final scale, the pair of items reflecting each construct comprised one positively-worded item and one nega-tively-worded item, and the 14 items were presented to respondents in such an order that positively worded items alternated with negatively worded items (Table 1). For comparison, we also asked respondents to indicate on a seven-point rating scale 'Which face shows best how you feel about living in your local area?' (Additional file 1, page 6).
Sampling and administration of survey
Main survey
The methods of sampling and data collection are described more fully in the accompanying paper (Ogilvie et al, submitted for publication). Briefly, we delineated three matching study areas on the basis of spatial and aggregate socioeconomic characteristics, identified a ran-dom sample of households in these areas using the Royal Mail Postcode Address File (PAF), and surveyed adults liv-ing in these households usliv-ing a postal questionnaire which included items on demographic and socioeco-nomic characteristics, health and wellbeing, perceptions of the local environment, travel behaviour and physical activity (Additional file 1). The 'neighbourhood scale' which we developed to assess perceptions of the local environment is the subject of this paper.
Test-retest reliability study
In order to establish the test-retest reliability of the neigh-bourhood scale, we sent a retest questionnaire to a strati-fied random sample of the original respondents on 16 March 2006 (approximately six months after the original
survey). The sampling frame for the retest survey com-prised all respondents to the original survey who had replied within one month, given their consent for follow-up and sfollow-upplied a full set of responses to the neighbour-hood scale; who did not live in one of a small number of streets selected for a separate qualitative interview study; and who did not live within 500 metres of any of four sites where we had identified a significant change to the local area occurring around or since the time of the original sur-vey (major housing development or the opening of a new railway station). We partitioned this sampling frame by sex and tertile of age and selected a stratified random sam-ple of 200 participants to receive the retest survey, which consisted of the neighbourhood scale and a question to confirm that respondents were still living at the same address. Respondents were offered the modest incentive of a £5 (€7; US$10) gift voucher in exchange for a com-pleted retest questionnaire. We compared selected charac-teristics of the achieved retest sample with those of the remainder of the achieved sample for the main survey using the chi-squared test.
Principal components analysis
We used principal components analysis to explore the underlying structure, and reduce the complexity, of the data obtained using the neighbourhood scale in the main survey. The principle of factor analysis is that by examin-ing correlations between a set of variables it may be possi-ble to identify a smaller number of underlying factors (components) which explain much of the variance in the original variables – either to confirm factors believed a pri-ori to be significant (confirmatory factor analysis), or (as in this case) in a situation where no such a priori belief is declared (exploratory factor analysis). Statistical packages such as SPSS offer numerous alternative methods for exploratory factor analysis. In the absence of any clear consensus in the literature as to which is most appropriate for the analysis of social data, we considered two alterna-tive methods: maximum-likelihood exploratory factor analysis, which some regard as the 'truest' method in sta-tistical terms, [14] and principal components analysis (PCA), which has more often been used in practice in this field. Preliminary maximum-likelihood exploratory factor analysis suggested that at least eight extracted factors would be required to fit the data adequately (data not shown). We did not consider this a useful reduction in complexity from the 14 original items in the scale. We therefore proceeded with PCA using the SPSS function
Factor Analysis: Extraction: Principal Components. To begin with, we did not specify the number of components to be extracted. We confirmed the suitability of the data for PCA using the Kaiser-Meyer-Olkin measure of sampling ade-quacy (a measure of the degree of common variance between the variables) and Bartlett's test of sphericity (a test of the null hypothesis that the variables are
com-Table 1: Items in neighbourhood scale
Construct Item Order*
Aesthetics It is pleasant to walk 1 The surroundings are unattractive 14 Green space There is a park within walking
distance
3
There is little green space 8 Access to amenities There is convenient public transport 5
The nearest shops are too far to walk to
10
Convenience of routes
There are convenient routes for cycling
7
There are no convenient routes for walking
12
Traffic There is little traffic 11 There is a lot of traffic noise 2 Road safety It is safe to cross the road 13
The roads are dangerous for cyclists 4 Personal safety It is safe to walk after dark 9 People are likely to be attacked 6
[image:3.612.55.297.509.721.2]pletely uncorrelated). We then considered the eigenvalues for the extracted components against standard criteria which can be used to select the 'important' components (those above the change in slope of the scree plot, or those with eigenvalues greater than one). Adapting the method used by Humpel and colleagues in their study of percevied environmental characteristics related to walking, [15] we then repeated the analysis applying Varimax rotation to simplify the interpretation, identified the correlation coef-ficients (loading factors) for each scale item on the com-ponents extracted, and considered whether the group of items most strongly correlated with each extracted com-ponent could be interpreted and labelled using a single overarching construct. Having selected the three most appropriate components (see results), we then calculated summary scores for each of three neighbourhood sub-scales, defined as the sum of the scores for the individual items most strongly correlated with each of the three prin-cipal components. We then described the distribution of summary scores for each subscale and calculated Cron-bach's α (a measure of internal consistency) and measures of test-rest reliability for each subscale and for the neigh-bourhood scale as a whole.
Test-retest reliability analysis
Different authors have used different measures to report the test-retest reliability of similar items in the published literature. In the interests of comparability, we therefore cross-tabulated the test and retest responses to each item on the neighbourhood scale and calculated several alter-native measures of reliability: the percentage exact agree-ment, the Pearson, Spearman and intraclass correlation coefficients, the chance-corrected agreement (Cohen's κ), and the chance-corrected agreement after collapsing each item from a five-point scale to a three-point scale – a weighted version of Cohen's κ to take account of the fact that, for example, a change in response from negative to zero, or from negative to positive, could be considered more significant than a change from -2 to -1.
Results
Characteristics of study participants
The characteristics of the study participants are described more fully in the accompanying paper (Ogilvie et al, sub-mitted for publication). Briefly, the main sample com-prised 1322 adults aged between 16 and 89 years (median age 48 years), of whom 61% were women; 47% were in full- or part-time employment, and 52% lived in owner-occupied accommodation; 48% had no household access to a car or van, and only 21% had access to a bicycle; 25% reported difficulty walking for a quarter of a mile, 39% reported a long-term health problem or disability, and 50% were overweight.
Most respondents were long-term residents of their local area (median duration of residence 14 years). As expected, duration of residence was correlated with age (rs = 0.56).
660 respondents met the criteria for inclusion in the sam-pling frame for the test-retest reliability study, of whom a random sample of 200 stratified by sex and tertile of age (cut-points 38 and 54 years) received the retest question-naire. Of these, 125 (63%) returned valid retest responses. The achieved retest sample had a balanced representation of men (n = 63) and women (n = 62) and an age distribu-tion similar to that of the initial sample (median age 47 years). There were no significant differences between retest respondents and the remainder of the achieved sam-ple for the main survey in the proportions who lived in owner-occupied households (57% vs 51%, P = 0.22), had access to a car (56% vs 52%, P = 0.35), reported active travel (29% vs 28%, P = 0.93) or reported sufficient phys-ical activity (43% vs 37%, P = 0.28).
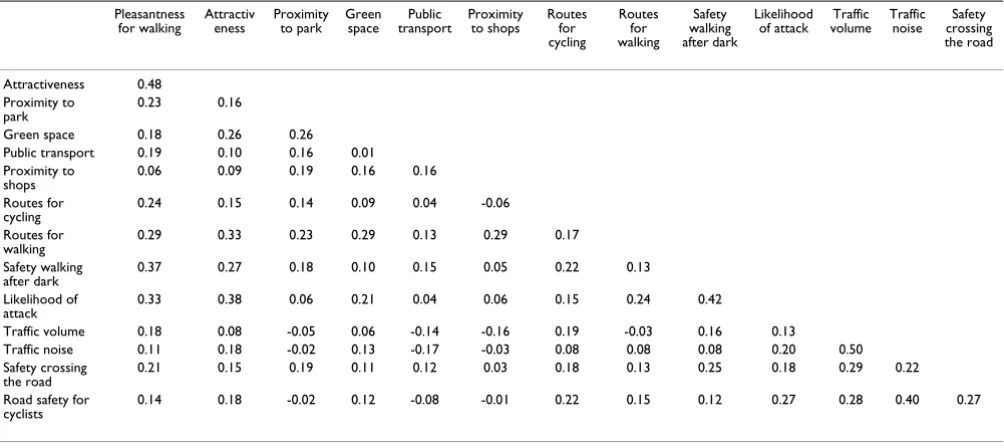
Perceived characteristics of the local environment The distributions of responses in the main survey to each of the 14 items on the neighbourhood scale are displayed with the responses to the negatively-worded items recoded so that for each item a value of +2 represents the most favourable response ('strongly agree' or 'strongly dis-agree', as appropriate), a value of -2 represents the least favourable response, and a value of zero represents a neu-tral response ('neither agree nor disagree') (Figure 1). The items which most often elicited the most favourable (+2) response were those on public transport and proximity to shops; the items which most often elicited the least favourable (-2) response were those on traffic volume, traffic noise and road safety for cyclists. There was little evidence of collinearity between the items: no pair of items had a correlation coefficient greater than 0.5, and most pairwise correlation coefficients were less than 0.2 (Table 2).
Summary scores
The average summary neighbourhood score (the sum of these 14 individual items) was zero (mean score 0.2, standard deviation 7.2; median score 0.0, interquartile range 10.0) and the internal consistency of this summary score was satisfactory (Cronbach's α = 0.72). [16] When asked 'Which face shows best how you feel about living in your local area?', 846 respondents (64%) selected one of the three smiling faces, i.e. a response category more favourable than the midpoint of the seven-point rating scale. There was a significant association between the ter-tile of summary neighbourhood score (cut-points ≤-3 and
≥4) and the response to the single item 'How do you feel about living in your local area?' (test for linear trend: χ2 =
Principal components analysis and development of subscales
Initial PCA extracted 14 components and returned satis-factory values for tests to confirm that the data were suita-ble for PCA (Kaiser-Meyer-Olkin measure of sampling adequacy 0.76; Bartlett's test of sphericity: χ2 = 3222.14, df
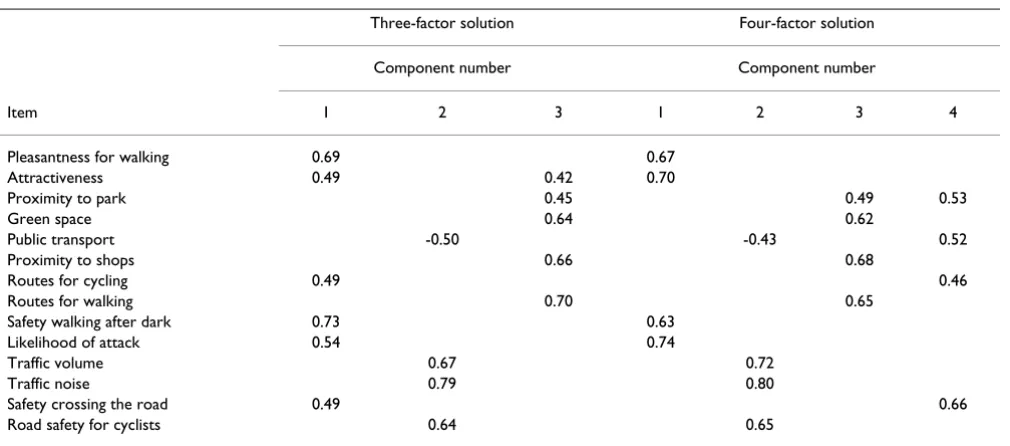
= 91; p < 0.001). The scree plot showed a flattening of the eigenvalue curve after the first three factors, which together explained 45% of the variance; on the other hand, the first four factors had an eigenvalue >1 and together explained 53% of the variance (Figure 2). We therefore repeated the analysis, specifying first a three-and then a four-factor solution three-and applying Varimax rotation (Table 3). The four items which 'loaded signifi-cantly' onto the first factor of the four-factor solution could more easily be interpreted and labelled using a sin-gle overarching construct ('safe and pleasant surround-ings') than the six items which 'loaded significantly' onto the first factor of the three-factor solution. In addition, there was no cross-loading of items between factors in the four-factor solution, whereas in the three-factor solution, attractiveness 'loaded significantly' onto both the first and third factors. We therefore defined the three principal components (factors) as those most strongly correlated with the first three factors of the four-factor solution, labelling these factors as factor 1, 'safe and pleasant sur-roundings'; factor 2, 'low traffic'; and factor 3, 'conven-ience for walking' (Table 4). There was little evidence of collinearity between the summary scores for these sub-scales (pairwise correlation coefficients -0.03, 0.17 and 0.34). The internal consistency of the subscale based on factor 1 ('safe and pleasant surroundings') was satisfactory (Cronbach's α = 0.70), whereas that of the subscales based
on factors 2 and 3 was lower (Cronbach's α = 0.58 and 0.55 respectively).
Test-retest reliability
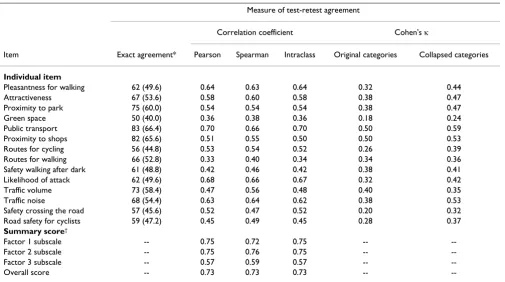
The test-retest characteristics of each item on the neigh-bourhood scale and of the summary scores are summa-rised in Table 5.
The proportion of respondents who gave exactly the same response to a particular item at test and retest ranged from 40% (for 'There is little green space') to 66% (for 'There is convenient public transport'). The constructs (pairs of items) most likely to elicit exactly the same response at retest were those concerned with access to amenities and with traffic; the constructs least likely to elicit a consistent response were those concerned with road safety and per-sonal safety. Test-retest correlation coefficients for each item ranged from 0.33 to 0.70 (Pearson), from 0.38 to 0.66 (Spearman), or from 0.34 to 0.70 (intraclass). The choice of method made little difference to the estimates of the coefficients; irrespective of method, the constructs (pairs of items) with the strongest test-retest correlations were those concerned with aesthetics and access to amen-ities, whereas the constructs with the weakest test-retest correlations were those concerned with green space and convenience of routes. The unweighted value of Cohen's
κ for the chance-adjusted test-retest agreement for each item ranged from 0.18 to 0.50. Thirteen items had a value of κ≥0.20 ('fair' agreement), while three had a value of
[image:5.612.57.559.101.325.2]κ≥0.40 ('moderate' agreement): these were the two items concerned with access to amenities (both κ = 0.50) and 'There is little traffic' (κ = 0.40). After collapsing the five response categories into three categories (positive, neutral
Table 2: Pearson correlation matrix for neighbourhood scale items
Pleasantness
for walking Attractiveness Proximity to park Green space transportPublic Proximity to shops Routes for cycling
Routes for walking
Safety walking after dark
Likelihood
of attack volumeTraffic Traffic noise crossing Safety the road
Attractiveness 0.48 Proximity to
park 0.23 0.16
Green space 0.18 0.26 0.26 Public transport 0.19 0.10 0.16 0.01 Proximity to
shops 0.06 0.09 0.19 0.16 0.16 Routes for
cycling 0.24 0.15 0.14 0.09 0.04 -0.06 Routes for
walking 0.29 0.33 0.23 0.29 0.13 0.29 0.17 Safety walking
after dark 0.37 0.27 0.18 0.10 0.15 0.05 0.22 0.13 Likelihood of
attack 0.33 0.38 0.06 0.21 0.04 0.06 0.15 0.24 0.42
Traffic volume 0.18 0.08 -0.05 0.06 -0.14 -0.16 0.19 -0.03 0.16 0.13
Traffic noise 0.11 0.18 -0.02 0.13 -0.17 -0.03 0.08 0.08 0.08 0.20 0.50 Safety crossing
the road 0.21 0.15 0.19 0.11 0.12 0.03 0.18 0.13 0.25 0.18 0.29 0.22 Road safety for
cyclists 0.14 0.18 -0.02 0.12 -0.08 -0.01 0.22 0.15 0.12 0.27 0.28 0.40 0.27
and negative), the recalculated values of Cohen's κ ranged from 0.24 to 0.59, with 8 of the 14 items having a recalcu-lated value of κ≥0.40 ('moderate' agreement).
The test-retest correlation coefficient for the summary neighbourhood score was 0.73, irrespective of the choice of method.
Discussion
Performance of scale
The neighbourhood scale devised for this study appeared to perform adequately for our purposes, although it should be noted that we have only assessed its perform-ance in one particular urban context. Further studies would be required to confirm its capacity to discriminate between a wider variety of types of neighbourhood and to determine whether the reliability of the items in the scale is generalisable between settings.
[image:6.612.96.510.92.530.2]Responses to individual items on neighbourhood scale Figure 1
First, the correlation matrix showed little evidence of col-linearity between the items, even within pairs of items. This suggests that, as intended, the different items were measuring different aspects of respondents' perceptions of their surroundings.
Second, although the test-retest reliability of the items was not as high as might appear desirable according to the cri-teria typically specified in statistical textbooks, the results of our reliability analyses were broadly comparable with those achieved in other studies of similar instruments which used four- or five-point rating scales – especially taking into account the long test-retest interval in this study (six months). We chose to analyse test-retest relia-bility using a variety of measures in order to maximise
comparability with other studies, which have tended to use the intraclass correlation coefficient (ICC) as a meas-ure of reliability. For example, in their assessment of a new 17-item module to assess perceptions of the local environment as an adjunct to the International Physical Activity Questionnaire (IPAQ) in a Swedish population, Alexander and colleagues reported test-retest ICCs for individual items ranging from 0.36 to 0.98; however, their test-retest interval was only one week, and the only two items with an ICC of greater than 0.9 involved asking questions which appeared considerably more concrete and objective than those addressed in our scale ('What is the main type of housing in your neighborhood?' and 'How many motor vehicles in working order are there in your household?'). [17] Similarly, in a study of three
ques-Table 3: Varimax-rotated component matrices
Three-factor solution Four-factor solution
Component number Component number
Item 1 2 3 1 2 3 4
Pleasantness for walking 0.69 0.67
Attractiveness 0.49 0.42 0.70
Proximity to park 0.45 0.49 0.53
Green space 0.64 0.62
Public transport -0.50 -0.43 0.52
Proximity to shops 0.66 0.68
Routes for cycling 0.49 0.46
Routes for walking 0.70 0.65
Safety walking after dark 0.73 0.63
Likelihood of attack 0.54 0.74
Traffic volume 0.67 0.72
Traffic noise 0.79 0.80
Safety crossing the road 0.49 0.66
Road safety for cyclists 0.64 0.65
[image:7.612.55.560.97.320.2]Correlation coefficients (loading factors) with absolute values <0.4 omitted in the interests of clarity
Table 4: Neighbourhood factors identified using principal components analysis
Factor Items contributing to factor Direction of correlation Label for factor
1 Pleasantness for walking Positive Safe and pleasant surroundings
Attractiveness Positive
Safety walking after dark Positive Likelihood of attack Positive
2 Public transport Negative Low traffic
Traffic volume Positive
Traffic noise Positive
Road safety for cyclists Positive
3 Proximity to park Positive Convenience for walking
Green space Positive
[image:7.612.55.558.550.728.2]tionnaires developed in the United States (the South Carolina and St. Louis instruments and the San Diego instrument, the latter now being known as NEWS) using a test-retest interval of one to three weeks, Brownson and colleagues reported ICCs for individual items comparable with those used in our scale ranging from 0.39 to 0.87, from 0.36 to 0.80 and from 0.18 to 0.78 in the three sites respectively. [11]
Although the precise ranking of the reliability of the indi-vidual items varied according to which of these metrics was used (e.g. using ICC compared with Cohen's κ), across all metrics the item which stood out as being the most reliable was that on access to public transport. This may reflect a greater degree of certainty (and therefore rel-ative lack of intra-subject variation) in respondents' assessment of their access to public transport, which might be interpreted in a more concrete way than their assessment of more subjective characteristics such as the attractiveness of their surroundings.
Third, the summary score obtained by summing the responses to the individual items in the scale was approx-imately symmetrically distributed about a mean of zero, had acceptable test-retest reliability, and exhibited a highly significant association with the alternative single-item rating scale 'How do you feel about living in your local area', suggesting acceptable concurrent validity in the terms within which this could be established in this context.
[image:8.612.58.293.88.232.2]Fourth, principal components analysis suggested three latent factors capable of being interpreted and labelled, and summary scores calculated by summing the scores for the items most significantly associated with each factor had acceptable internal consistency and test-retest relia-bility and did not exhibit significant collinearity.
Table 5: Test-retest relationships for neighbourhood scale items and summary scores
Measure of test-retest agreement
Correlation coefficient Cohen's κ
Item Exact agreement* Pearson Spearman Intraclass Original categories Collapsed categories
Individual item
Pleasantness for walking 62 (49.6) 0.64 0.63 0.64 0.32 0.44
Attractiveness 67 (53.6) 0.58 0.60 0.58 0.38 0.47
Proximity to park 75 (60.0) 0.54 0.54 0.54 0.38 0.47
Green space 50 (40.0) 0.36 0.38 0.36 0.18 0.24
Public transport 83 (66.4) 0.70 0.66 0.70 0.50 0.59
Proximity to shops 82 (65.6) 0.51 0.55 0.50 0.50 0.53
Routes for cycling 56 (44.8) 0.53 0.54 0.52 0.26 0.39
Routes for walking 66 (52.8) 0.33 0.40 0.34 0.34 0.36
Safety walking after dark 61 (48.8) 0.42 0.46 0.42 0.38 0.41 Likelihood of attack 62 (49.6) 0.68 0.66 0.67 0.32 0.42
Traffic volume 73 (58.4) 0.47 0.56 0.48 0.40 0.35
Traffic noise 68 (54.4) 0.63 0.64 0.62 0.38 0.53
Safety crossing the road 57 (45.6) 0.52 0.47 0.52 0.20 0.32 Road safety for cyclists 59 (47.2) 0.45 0.49 0.45 0.28 0.37 Summary score†
Factor 1 subscale -- 0.75 0.72 0.75 --
--Factor 2 subscale -- 0.75 0.76 0.75 --
--Factor 3 subscale -- 0.57 0.59 0.57 --
--Overall score -- 0.73 0.73 0.73 --
--n = 125. * Cou--nt (%). †Exact agreeme--nt a--nd Cohe--n's κ --not applicable to co--nti--nuous summary variables
[image:8.612.55.560.442.724.2]Scree plot of eigenvalues associated with principal compo-nents
Figure 2
Interpretation of findings
The contribution of the neighbourhood scale to under-standing the correlates of active travel and physical activ-ity in our study population is discussed in the accompanying paper (Ogilvie et al, submitted for publica-tion), which may be briefly summarised as showing that differences in perceptions of the local environment accounted for little additional variance in either active travel or physical activity after personal characteristics were taken into account. However, this more-or-less 'neg-ative result' for environmental correlates overall does not necessarily reflect poorly on the capacity of our neigh-bourhood scale to measure meaningful constructs.
As shown in Figure 1, the distribution of responses varied markedly between items on the scale. For some items, the peak of the distribution was at the midpoint of the scale (e.g. safety walking after dark and likelihood of attack) whereas for others, the distribution exhibited a clear skew towards positive responses (e.g. proximity to a park, pub-lic transport, proximity to shops and safety crossing the road) or negative responses (e.g. traffic volume, traffic noise and road safety for cyclists). In other words, although the average summary score for the scale was close to the midpoint (zero, representing a neutral response), this neutral aggregate opinion of the overall characteristics of the local environment conceals widely divergent aggregate opinions about specific characteris-tics. This suggests that it is likely to be important to attempt to measure these specific characteristics rather than relying on a simple overall rating of the local envi-ronment.
The skewness of the distribution of responses to some items is unsurprising; for example, it should come as no surprise that residents of a comparatively densely-devel-oped conurbation with an extensive bus network should tend to rate traffic volume, traffic noise, proximity to shops and the availability of public transport highly. On the other hand, we found an interesting divergence between a predominantly positive perception of road safety for pedestrians and a predominantly negative per-ception of road safety for cyclists. This may be a real diver-gence, possibly related to the low prevalence of access to bicycles in the study population, which could be explored further in a future qualitative study; however, it should be noted that these were the items with the poorest test-retest reliability.
Principal components analysis suggested that the items could be grouped into three more general factors reflect-ing the safety and pleasantness of the surroundreflect-ings, the lack of road traffic, and the convenience of routes and des-tinations for walking – all of which have some face valid-ity as being plausibly associated with active travel in the
local area. Despite the fact that none of these general fac-tors were shown to be significantly associated with active travel or physical activity (Ogilvie et al, submitted for pub-lication), our analysis highlights the possibility that differ-ent neighbourhoods may 'score highly' on one, but not all, of these apparently desirable characteristics – for example, neighbourhoods with comparatively little traffic may also be perceived as safe and pleasant but may not have local amenities which can be conveniently reached on foot.
Conclusion
We successfully developed and used a new, short (14-item) neighbourhood scale suitable for assessing resi-dents' perceptions of the local environment in the context of an observational study of the effects of a major modifi-cation to the urban built environment and transport infra-structure in a comparatively deprived urban population in the west of Scotland, and showed this scale to have accept-able test-retest reliability compared with that of related scales developed for use in other contexts.
This work therefore contributes to the development of a growing set of tools which may be useful for researchers investigating the role of perceived environmental charac-teristics, and changes in those characcharac-teristics, in explain-ing or mediatexplain-ing patterns of active travel and physical activity and how these are affected by interventions which change the physical environment.
Competing interests
This paper is based on material contained in the first author's PhD thesis.
Authors' contributions
DO had the original idea for the study, designed the study and the survey materials, applied for ethical approval, cleaned and coded the survey data, carried out all the anal-yses and wrote the paper. MP was DO's PhD supervisor. RM, NM, MP and SP constituted the steering group for the study, contributed to and advised on the design of the study and the interpretation of the emerging findings, contributed to the critical revision of the paper, and approved the final version.
Additional material
Additional file 1
Survey questionnaire. Click here for file
Publish with BioMed Central and every scientist can read your work free of charge
"BioMed Central will be the most significant development for disseminating the results of biomedical researc h in our lifetime."
Sir Paul Nurse, Cancer Research UK
Your research papers will be:
available free of charge to the entire biomedical community
peer reviewed and published immediately upon acceptance
cited in PubMed and archived on PubMed Central
yours — you keep the copyright
Submit your manuscript here:
http://www.biomedcentral.com/info/publishing_adv.asp
BioMedcentral
Acknowledgements
DO was funded by a Medical Research Council (MRC) special training fel-lowship in health of the public research (award reference no. G106/1203 67290; WBS no. U.1300.00.002.00010.01). MP, RM and SP were funded by the Chief Scientist Office of the Scottish Executive Health Department (now of the Scottish Government Public Health and Wellbeing Directo-rate). The opinions expressed here are those of the authors and not nec-essarily those of the funders. The study was approved by the University of Glasgow Medical Faculty Ethics Committee (project reference no. FM01304). We thank the survey team at the MRC Social and Public Health Sciences Unit for carrying out the survey and the local residents who took part.
References
1. Owen N, Leslie E, Salmon J, Fotheringham M: Environmental determinants of physical activity and sedentary behavior.
Exerc Sports Sci Rev 2000, 28:153-158.
2. Saelens B, Sallis J, Frank L: Environmental correlates of walking and cycling: findings from the transportation, urban design and planning literatures. Ann Behav Med 2003, 25:80-91. 3. Owen N, Humpel N, Leslie E, Bauman A, Sallis J: Understanding
environmental influences on walking: review and research agenda. Am J Prev Med 2004, 27:67-76.
4. Handy S: Critical assessment of the literature on the relationships among transportation, land use, and physical activity Washington, DC: Trans-portation Research Board and Institute of Medicine Committee on Physical Activity, Health, Transportation, and Land Use; 2004. 5. Badland H, Schofield G: Transport, urban design and physical
activity: an evidence-based update. Transport Res D 2005,
10:177-196.
6. Wendel-Vos W, Droomers M, Kremers S, Brug J, van Lenthe F:
Potential environmental determinants of physical activity in adults. In Environmental determinants and interventions for physical activity, nutrition and smoking: a review Edited by: Brug J, van Lenthe F. Rotterdam: Erasmus University Medical Centre; 2005.
7. Duncan M, Spence J, Mummery K: Perceived environment and physical activity: a meta-analysis of selected environmental characteristics. Int J Behav Nutr Phys Act 2006, 2:11.
8. Giles-Corti B, Donovan R: The relative influence of individual, social and physical environment determinants of physical activity. Soc Sci Med 2002, 54:1793-1812.
9. Bauman A: The physical environment and physical activity: moving from ecological associations to intervention evi-dence. J Epidemiol Community Health 2005, 59:535-536.
10. Ogilvie D, Mitchell R, Mutrie N, Petticrew M, Platt S: Evaluating health effects of transport interventions: methodologic case study. American Journal of Preventive Medicine 2006, 31:118-126. 11. Brownson R, Chang J, Eyter A, Ainsworth B, Kirtland K, Saelens B,
Sallis J: Measuring the environment for friendliness toward physical activity: a comparison of the reliability of three questionnaires. Am J Public Health 2004, 94:473-483.
12. Humpel N, Marshall A, Leslie E, Bauman A, Owen N: Changes in neighbourhood walking are related to changes in percep-tions of environmental attributes. Ann Behav Med 2004,
27:60-67.
13. Saelens B, Sallis J, Black J, Chen D: Neighborhood-based differ-ences in physical activity: an environment scale evaluation.
Am J Public Health 2003, 9:1552-1558.
14. Costello A, Osborne J: Best practices in exploratory factor analysis: four recommendations for getting the most from your analysis. Pract Assess Res Eval 2005, 10:7.
15. Humpel N, Owen N, Iverson D, Leslie E, Bauman A: Perceived environment attributes, residential location, and walking for particular purposes. Am J Prev Med 2004, 26:119-125.
16. Bland M, Altman D: Cronbach's alpha. BMJ 1997, 314:572. 17. Alexander A, Bergman P, Hagströmer M, Sjöström M: IPAQ
envi-ronmental module: reliability testing. J Public Health 2006,