City, University of London Institutional Repository
Citation:
Gucunski, N., Slabaugh, G. G., Wang, Z., Fang, T. and Maher, A. (2008). Impact echo data from bridge deck testing: Visualization and interpretation. TransportationResearch Record(2050), pp. 111-121. doi: 10.3141/2050-11
This is the accepted version of the paper.
This version of the publication may differ from the final published
version.
Permanent repository link:
http://openaccess.city.ac.uk/4392/Link to published version:
http://dx.doi.org/10.3141/2050-11Copyright and reuse: City Research Online aims to make research
outputs of City, University of London available to a wider audience.
Copyright and Moral Rights remain with the author(s) and/or copyright
holders. URLs from City Research Online may be freely distributed and
linked to.
City Research Online: http://openaccess.city.ac.uk/ [email protected]
VISUALIZATION AND INTERPRETATION OF IMPACT ECHO DATA FROM BRIDGE DECK TESTING
Submission Date: 8/1/2007
Total words: 4254 (Text) + 2750 (11 Figures) = 7004 Words.
Nenad Gucunski, Ph.D.*
Professor and Chair, Civil and Environmental Engineering Department Rutgers, the State University of New Jersey
623 Bowser Road, Piscataway, NJ 08854 Tel: 732-445-2232, Fax: 732-445-0577
Greg Slabaugh, Ph.D.
Research Scientist, Intelligent Vision and Reasoning Department Siemens Corporate Research
755 College Road East, Princeton, NJ 08540 Tel: 609-734-3350, Fax: 609-734-6565
Zhe Wang
Graduate Student, New Jersey Institute of Technology Intern, Intelligent Vision and Reasoning Department Siemens Corporate Research
755 College Road East, Princeton, NJ 08540 Tel: 609-734-2310, Fax: 609-734-6565
Tong Fang, Ph.D.
Program Manager, Intelligent Vision and Reasoning Department Siemens Corporate Research
755 College Road East, Princeton, NJ 08540 Tel: 609-734-3342, Fax: 609-734-6565
Ali Maher, Ph.D.
Director, Center for Advanced Infrastructure and Transportation (CAIT) Rutgers, the State University of New Jersey
100 Brett Road, Piscataway, NJ 08854 Tel: 732-445-0579, Fax: 732-445-0577
*Corresponding Author
ABSTRACT
Accurate assessment of the condition of bridges leads to their economic management. Ultrasonic seismic methods can be successfully used for this purpose by evaluating changes in material characteristics and detection of development of defects and zones of deterioration. The impact echo method is of special benefit in evaluation of corrosion induced deck delamination, due to its nondestructive nature, speed of evaluation and ability to detect delaminated zones at various stages of deterioration: from initial to progressed and developed. The traditional approach in condition assessment of bridge decks by impact echo based on review of individual test point records, and a new automated approach based on three dimensional data visualization are presented. The developed three dimensional visualization platform allows both the advanced presentation and interpretation of impact echo data. The data presentation is provided in terms three dimensional translucent visualizations of reflectors in a bridge deck section, and horizontal and vertical cross sections through all distinctive zones, including a zone of delamination. The associated interpretation platform allows both the overall assessment of the condition of the deck, through cumulative distributions and histograms of reflection intensity, and identification of deteriorated zones of the deck for repair or rehabilitation in an efficient and intuitive way. The visualization platform effectively enables an impact echo device to be used as some kind of a bridge deck sonar device.
INTRODUCTION
The condition of the transportation network in the United States is deteriorating and requires enormous financial and human resources for its maintenance and mitigation. According to the National Bridge Inventory (NBI) (Federal Highway Administration, 2004), about 25.4% out of 600,000 bridges in the United States are structurally deficient or obsolete. An important component of the inspection and rehabilitation of concrete bridges is the assessment of the bridge’s deck condition, whether the deterioration manifests itself through material degradation or defect generation. One of the most common problems in concrete bridge decks is a corrosion induced deck delamination. The current practice of deck inspection by chain dragging can be described as nondestructive and relatively rapid. However, the accuracy of chain dragging is significantly compromised by the fact that it can only be used to identify delaminations at stages where the deterioration has already progressed to such an extent that major rehabilitation measures are needed. The advent of nondestructive evaluation techniques has significantly aided this task, and several methods have been successfully utilized to detect common defects in concrete bridge decks. Among these methods, ultrasonic seismic techniques are one of the most widely used techniques.
Impact echo (IE), together with other ultrasonic seismic techniques, like ultrasonic body-wave (UBW) and ultrasonic surface-wave (USW), has been successfully implemented in comprehensive evaluation of bridge decks (1, 2, 3), in short and long term monitoring of pavement materials (4,5), and in evaluation of other infrastructure systems (6). It has been demonstrated that IE can detect and assess delaminations at various deterioration stages. While it is capable of detecting deck delaminations at various stages of deterioration progression, precise interpretation of the measured parameters has yet to be fully automated. Significant improvements to the automation of the evaluation process are expected to come from neural network algorithms developed using finite element simulations of ultrasonic testing on delaminated bridge decks (3), and improved data visualization.
An impact echo data visualization and interpretation framework for the assessment of concrete bridge decks is discussed in this paper. The first part of the paper discusses fundamental aspects of impact echo testing in bridge deck evaluation, its implementation in the field using one of the integrated ultrasonic seismic devices, the Portable Seismic Property Analyzer (PSPA), and the current data analysis and interpretation approach. Field implementation impact echo is illustrated using results from testing on two bridge decks in Virginia. The second part of the paper discusses IE data visualization and to it related interpretation techniques, which can be used to both enhance and simplify the interpretation of results of testing on delaminated bridge decks. Finally, the proposed data visualization provides practicing engineers a more intuitive approach to bridge deck evaluation, by effectively enabling IE devices to act as some kind of bridge deck sonar devices.
BRIDGE DECK CONDITION ASSESSMENT BY IMPACT ECHO
IE method is an ultrasonic seismic method that is in the case of bridge deck evaluation, often used in conjunction with other ultrasonic seismic methods. The following sections discuss the ultrasonic seismic methods typically used in bridge deck evaluation, their field implementation, explanation of the rationale behind the condition grading system, and the current practice of data presentation.
Ultrasonic Seismic Methods for Bridge Deck Testing
Thus, it is used to detect defects in the structure and can be thought of as a diagnostic tool in defect identification.
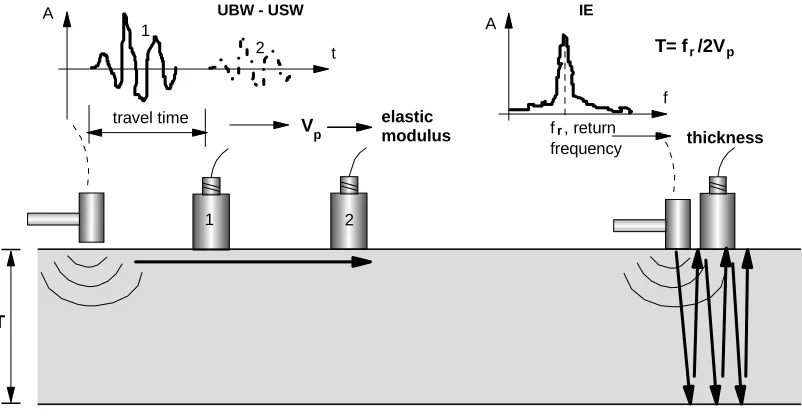
[image:5.612.111.512.334.544.2]Application of UBW, USW and IE techniques in the evaluation of a bridge deck is illustrated in Figure 1. In the first part of the evaluation, the UBW and USW tests are conducted using an impact source and two receivers. The UBW technique is used to measure the velocity of propagation of compression (P) waves. By measuring the travel time of the P-wave between two receivers, the first wave arrivals, the P-wave velocity (VP) is calculated. Because it is often difficult to identify P-wave arrivals in an automated way, a more reliable procedure to estimate the P-wave velocity is through a measurement of the surface (Rayleigh or R) wave velocity using the USW test. The USW test is identical to the SASW test (7,8), except that the frequency range of interest is limited to a narrow high frequency range where the velocity of the surface wave (phase velocity) does not vary significantly with frequency (9). Variation in the phase velocity would be an indication of variation of material properties (elastic moduli) with depth. Once the R-wave velocity is determined, it can be well correlated to both compression and shear (S) wave velocities, and thus to the Young’s and shear moduli. In the second part of the evaluation, the IE test is conducted using an impact source and a single nearby receiver. Because of a significant contrast in rigidity of concrete and air, the elastic wave is practically entirely reflected off the bottom of the deck back to the deck surface. The frequency of the reflection, called return frequency, can be identified in the response spectrum of the recorded signal. Finally, the depth of the reflector, in this case the deck thickness, can be obtained from the return frequency and the previously determined P-wave velocity, as illustrated in Figure 1.
FIGURE 1 Measurement of bridge deck elastic modulus and thickness by UBW and IE methods.
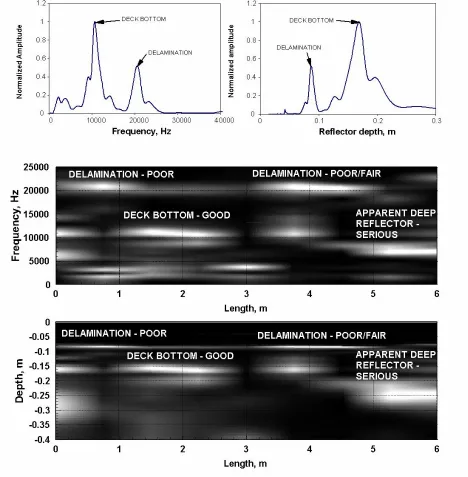
While the primary objective of IE testing is to determine dominant reflectors, according to the relationship described in Figure 1, a unique thickness or depth of the reflector can be correlated to every component of the frequency spectrum. This is illustrated in Figure 2 by a frequency spectrum, and the corresponding thickness spectrum. The thickness spectrum enables simple data interpretation, because positions of the dominant and secondary peaks describe clearly the pattern of energy partitioning, and thus the degree of delamination. Spectra for a set of points along a single test line can be combined to form spectral surfaces. As shown in the same figure, frequency spectra for one test line on a bridge deck are combined to form a frequency spectral surface and are converted into a corresponding thickness spectral surface. The following observations, regarding the advantages of the two surface types, can be made when linear scales are used for both frequencies and depths. The frequency spectral surface
travel time
t A
f
f , return frequency Vp
thickness
1 2
2
1 A
elastic modulus
T= f /2Vr p
r
T
emphasizes presence of shallow delaminations, while the thickness spectrum emphasizes presence of apparent deep reflectors, deck zones in a serious condition that will be discussed in the following section
[image:6.612.72.540.139.616.2](10). Because the thickness spectral surface represents a more natural choice for data viewing, a properly selected nonlinear depth scale can provide a well-balanced image for identification of all detected reflectors.
FIGURE 2 Frequency and thickness spectra and spectral surfaces.
Current Practice of Condition Assessment
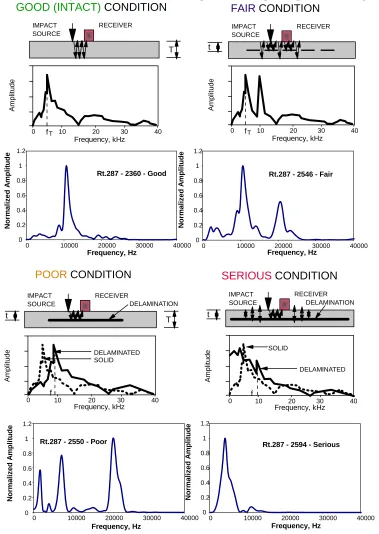
that particular section of a deck as a part of the condition assessment process. This is illustrated in Figure 3. In the case of a sound deck (good condition), a distinctive peak in the response spectrum corresponding
FIGURE 3 Grades for various degrees of deck delamination.
to the full depth of the deck, can be observed. This is illustrated by two spectra under the schematic of the bridge deck. The upper spectrum in the figure represents a schematic of the expected spectrum, while the lower spectrum is taken from actual field testing. Initial delamination (fair condition) is described as occasional separations between the two deck zones. It can be identified through the presence of two
FAIR CONDITION
Frequency, kHz 40 20 10 0 30 A m pl it ud e RECEIVER IMPACT SOURCE fT Frequency, kHz Frequency, kHz 0 10 20 30 40
Am pl it ud e DELAMINATION IMPACT SOURCE t f RECEIVER DELAMINATED SOLID
SERIOUS CONDITION
POOR CONDITION
40 20 10 0 30 A m p litu d e DELAMINATION IMPACT SOURCE t f RECEIVER T DELAMINATED SOLID Frequency, kHz 40 20 10 0 30 Am pl it ude RECEIVER IMPACT SOURCE T fT
GOOD (INTACT) CONDITION
Frequency, Hz N o rmal ize d A m pl it ud e
Rt.287 - 2550 - Poor
0 0.2 0.4 0.6 0.8 1 1.2
0 10000 20000 30000 40000
Frequency, Hz N o rmal iz e d A m pl it ud e Frequency, Hz Rt.287 - 2360 - Good
0 0.2 0.4 0.6 0.8 1 1.2
0 10000 20000 30000 40000
Rt.287 - 2546 - Fair
0 0.2 0.4 0.6 0.8 1 1.2
0 10000 20000 30000 40000
N o rmal ized A m pl it u d e
Rt.287 - 2594 - Serious
0 0.2 0.4 0.6 0.8 1 1.2
0 10000 20000 30000 40000
distinct peaks, indicating energy partitioning from two dominant wave propagation patterns. The first peak corresponds to reflections from the bottom of the deck, while the second corresponds to reflections from the delamination. Progressed delamination (poor condition) is characterized by a single peak at a frequency corresponding to a reflector depth that is shallower than the deck thickness, indicating that little or no energy is being propagated towards the bottom of the deck. Finally, in a very severe case of a wide delamination (serious condition), the dominant response of the deck to an impact is characterized by a low frequency response of flexural mode oscillations of the upper delaminated portion of the deck. This response is almost always in the audible frequency range, unlike response of the deck in the fair and poor condition that may be in the ultrasonic range. Because it is significantly lower than the return frequency for the deck bottom, it produces an apparent reflector depth that is larger than the deck thickness.
Field Implementation of Impact Echo and Condition Maps
[image:8.612.171.479.345.676.2]IE is commonly implemented in deck evaluations by conducting point testing on a grid of selected spacing. The testing is conducted using impact echo devices, which in some case integrate other ultrasonic seismic methods. One of such devices is PSPA with has a sole purpose of evaluation of surface pavement layers and bridge decks. The device integrates all three previously described ultrasonic techniques (UBW, USW, IE). The core of the PSPA system is a sensor box (Figure 4a), a box containing a solenoid type impact hammer and two high frequency accelerometers, 7.5 and 21.5 cm away from the hammer. All controls and data acquisition are in a computer that is connected by a serial cable to the sensor box. A new design of the PSPA (Figure 4c) has all data acquisition and control elements are a part of the unit. Field evaluation of bridge decks is typically done on grids of 0.6x0.6 m to 0.9x0.9 m (Figure
FIGURE 4 Older and newer versions of PSPA sensor box (a and c), and field implementation (b and d). (b)
(d) (c)
SENSORS SOURCE
4d). Testing using the PSPA is simple and for a single point takes less than 30 seconds. The sensor box is placed at the test point (Figure 4c), a series of impacts (6-10) of 50 μs duration are applied and acceleration histories are recorded. The testing is fairly insensitive to traffic induced vibrations because of the high frequency range used—typically between 2 and 30 kHz.
FIGURE 5 Condition assessment maps for Carter Creek Bridge (top) and Van Buren Bridge (bottom).
of initial delamination represents a significant advantage of the PSPA device (seismic ultrasonic testing) over the chain drag approach. It allows more accurate definition of boundaries of delaminated zones, better prediction of delamination progression, and leads to better assessment and timing for implementation of rehabilitation measures.
DATA VISUALIZATION AND INTERPRETATION
Significant enhancements in IE data interpretation can be achieved by using advanced data visualization techniques. This may include presentation of data for arbitrary vertical and horizontal cross sections in terms of spectral plots, or translucent three-dimensional plots of bridge deck sections. In all cases, the ultimate objective can be described as providing a view into the internal structure of the bridge deck and assessment of structural problems. Those may include delaminations, but IE is also suitable for detecting single or multiple scattering targets (11). In the proposed bridge deck inspection framework, the IE data set is visualized in 3D space for inspection by a user.
(a) (b)
[image:10.612.76.537.247.652.2](c) (d)
3D Visualization of Impact Echo Data
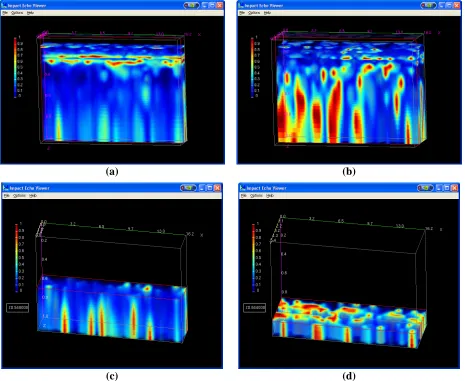
A 3D visualization platform for IE data was developed. The platform is written in C++ for Microsoft Windows, and depicted in Figures 6a and 6b for Carter Creek and Van Buren bridge decks. The IE data consists of a reflection value, normalized in the range [0, 1], and sampled on a discrete 3D grid of voxels. Using OpenGL, the data is rendered as a series of texture-mapped planes that slice through the volume, where the reflection strength is used as an index into a colormap look-up table that consists of red, green, blue, and alpha (transparency) values. The user can rotate and shift the camera position, enlarge or shrink the volume and observe the data from different viewing positions and angles. Additionally, as shown in Figures 6c and 6d, the user can interactively adjust the transparency so that weaker reflectors become more transparent, allowing better visualization of the strong reflectors. Similar to the observations in the previous section, in the visualizations provided in Figure 6 it can be noticed that the Carter Creek Bridge, visualized in 6a and 6c is in reasonably good condition. The primary reflections are coming from the bottom of the deck. In contrast, the Van Buren Bridge, visualized in Figures 6b and 6d, has a large number of reflections throughout the volume, indicating a highly deteriorated condition. Data presented in 3D viewer can be inspected as vertical and horizontal cross sections or slices, as illustrated in Figure 7.
(a) (b)
[image:11.612.73.538.276.657.2](c) (d)
FIGURE 7 Vertical (top row) and horizontal (bottom row) cross-sections through the data. Left: Carter Creek Bridge (vertical section for y=1.6 m (a) and horizontal for z=0.54 m (c)), Right: Van Buren Bridge
Data Analysis and Interpretation
While data visualization is very useful for the user to visually inspect the bridge deck data, this framework also provides analytical software tools that characterize the IE data and provide the overall
assessment of the condition of a bridge deck. The same tools are used to identify zones of the deck that
require repair or rehabilitation. The sections below describe these tools that are based on the distribution of reflection intensity. While a number of bridge decks were analyzed, results for Carter Creek and Van Buren bridge decks are presented herein to highlight the application of these analytical software tools.
Reflection Intensity vs. Depth Relationship
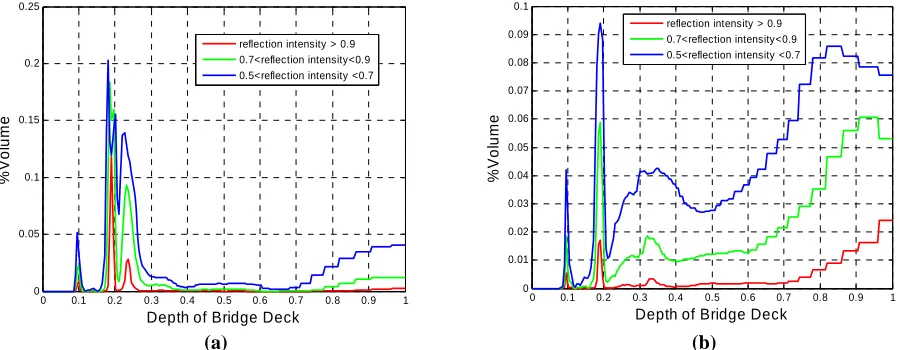
To locate the depth of the strongest reflectors, which could be indicators of defects in a bridge deck, it is very useful to study the relationship between the reflection intensity and depth of the bridge deck. In Figure 8a, strongest reflections appear around a depth equal to about 0.2 m, which corresponds to the bottom of the deck. This phenomenon indicates that the deck is in good condition, consistent with the previous observation and analysis. However, in Figure 8b, strong reflections appear throughout the deck, particularly in the lower regions (close to a 1 m depth) of the deck, indicating presence of flexural oscillations of the upper portion of the deck and thus serious condition.
0 0.1 0.2 0.3 0.4 0.5 0.6 0.7 0.8 0.9 1 0 0.05 0.1 0.15 0.2 0.25
Depth of Bridge Deck
%
V
ol
um
e
reflection intensity > 0.9 0.7<reflection intensity<0.9 0.5<reflection intensity <0.7
0 0.1 0.2 0.3 0.4 0.5 0.6 0.7 0.8 0.9 1 0 0.01 0.02 0.03 0.04 0.05 0.06 0.07 0.08 0.09 0.1
Depth of Bridge Deck
%V
ol
ume
reflection intensity > 0.9 0.7<reflection intensity<0.9 0.5<reflection intensity <0.7
[image:12.612.81.531.301.476.2](a) (b)
FIGURE 8 Percent Volume for Various Reflection Intensities vs. Depth. Carter Creek (a), Van Buren (b).
Cumulative Distribution of Reflection Intensity
0 0.1 0.2 0.3 0.4 0.5 0.6 0.7 0.8 0.9 1 0 10 20 30 40 50 60 70 80 90 100 >=Reflection Strength % V ol um e
[image:13.612.82.518.79.253.2]0 0.1 0.2 0.3 0.4 0.5 0.6 0.7 0.8 0.9 1 0 10 20 30 40 50 60 70 80 90 100 >=Reflection Strength % V ol um e (a) (b)
FIGURE 9 Cumulative Distribution of Reflection Intensity. Carter Creek Bridge (a) and Van Buren Bridge (b).
Histogram of All Reflection Intensities
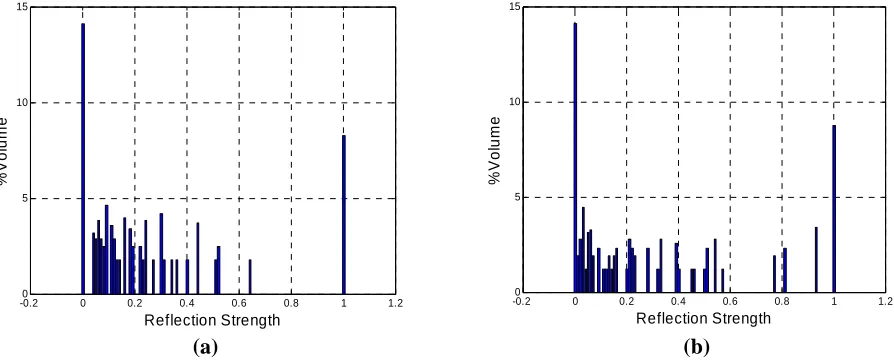
A histogram is the graphical version of a table which shows what proportion of cases fall into each of several or many specified categories. In Fig. 10, the histograms of both bridges are shown. It is worthy noting that the percentage of volume of strong reflection intensity in Carter Creek Bridge is less than Van Buren Bridge, which supports the previous analysis that the latter one is more deteriorated.
-0.20 0 0.2 0.4 0.6 0.8 1 1.2
5 10 15 Reflection Strength %Vo lume
-0.20 0 0.2 0.4 0.6 0.8 1 1.2
5 10 15 Reflection Strength %Vo lume (a) (b)
FIGURE 10 Histogram of Reflection Intensity. Carter Creek Bridge (a), Van Buren Bridge (b). Log(%volume(at each reflection strength)) + constant.
Identification of Repair Areas
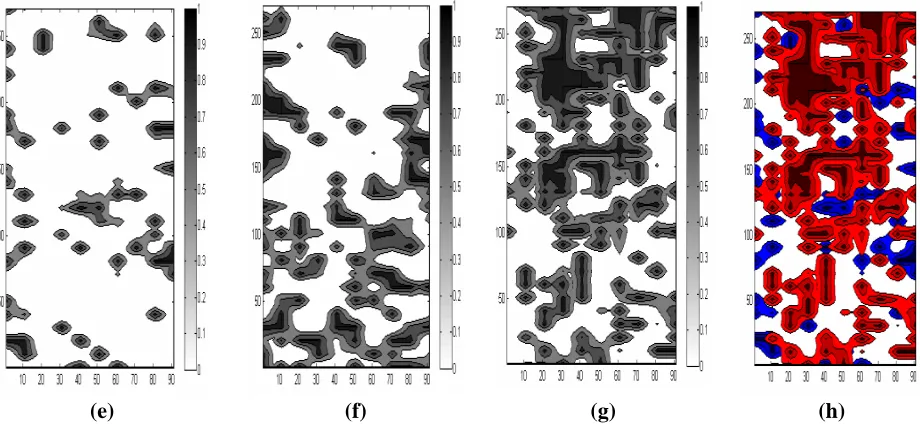
[image:13.612.87.534.402.582.2]with strong reflection maps for slices between 7 and 13 cm. Similarly, sound zones of the deck are identified by strong reflections from the bottom of the deck, or in this case described by slices between 16 and 24 cm depth in Figures 11b and 11f. (Clearly, the Carter Creek Bridge deck is in a better condition.) Finally, progressed delamination (serious condition) can be described by strong reflection maps for the slice for the depth deeper than the depth of the bottom of the deck. This is illustrated by the strong reflection maps for slices between 30 cm and 1 m in Figures 11c and 11g. To obtain the map of zones candidates for repair, the map for serious condition is superimposed on the map of initial delamination, as e.g. repair map in Figure 11d is obtained from the map in Figures 11c superimposed on the map in Figure 11a. A comparison of maps for Carter Creek Bridge in Figure 11d and Van Buren Bridge in Figure 11h points clearly to significantly higher deterioration and need for repair of the latter one.
SUMMARY AND CONCLUSIONS
Ultrasonic seismic tests, and IE in particular, can be successfully used in evaluation and long term monitoring of concrete bridge decks. The monitoring can encompass changes in both material characteristics (primarily elastic moduli), and the deck condition with respect to deterioration caused by corrosion induced delamination. In contrast to the chain drag practice, the condition assessment with respect to delamination by ultrasonic methods allows detection of zones of delamination at various stages, from initial to progressed and developed.
Advanced data visualization techniques can significantly improve the accuracy and ease of data interpretation. Application of a three-dimensional translucent imaging to IE testing results enables an impact echo device to be used as a kind of a bridge deck sonar device. The presented visualization and interpretation algorithm platform allows both the overall assessment of the condition of the deck and identification of deteriorated zones of the deck for repair or rehabilitation in an efficient and intuitive way.
(e) (f) (g) (h)
FIGURE 11 Plan view contour plots for deck repair. Top: Carter Creek Bridge, Bottom: Van Buren Bridge. Left to right: the maximum reflectance in the “delamination zone” slice (0.07m~0.13m) (a)(e),
in the “bottom of the deck” slice (0.16m~0.24m)(b)(f), and in the “apparent deep reflector” zone (0.3m~1m)(c)(g). Identified deteriorated zones (d) and (h) (red - serious condition, blue – fair to poor
condition).
REFERENCES
1. Sansalone, M. J. Detecting Delaminations in Concrete Bridge Decks with and without Asphalt Overlays Using an Automated Impact-Echo Field System. In Proceedings of the British Institute of Non-Destructive Testing International Conference NDT in Civil Engineering, Liverpool, U.K., April 14-16, 1993, pp. 807-820.
2. Carino, N. The Impact Echo Method: An Overview. In Proceedings of the Structures Congress and Exposition, American Society of Civil Engineers, CD-ROM, May 21-23, 2001.
3. Gucunski, N., Antoljak, S. and Maher, A. Seismic Methods in Post Construction Condition Monitoring of Bridge Decks. Use of Geophysical Methods in Construction, Geotechnical Special Publication No. 108, S. Nazarian and J. Diehl (Eds.), Geo Institute, ASCE, 2000, pp. 35-51.
4. Nazarian, S. and Yuan, D. Evaluation and Improvement of Seismic Pavement Analyzer. Research Project Report 7-2936, The Center for Highway Materials Research, The University of Texas at El Paso, El Paso, 1997.
5. Rojas, J., Nazarian, S., Tandon, V. and Yuan, D. Quality Management of Asphalt-Concrete Layers Using Wave Propagation Techniques. Journal of Association of Asphalt Paving
Technologists, Vol. 68, 1999, pp. 450-478.
6. Sansalone, M. J. and Street, W. B. Impact-Echo - Nondestructive Evaluation of Concrete and
Masonry, Bullbrier Press, Ithaca, New York, 1997.
7. Nazarian, S., Stokoe, K. H., II, and Hudson, W. R. Use of spectral analysis of surface waves method for determination of moduli and thicknesses of pavement systems. Transportation
Research Record, No. 930, National Research Council, Washington, D.C., 1983, pp. 38-45.
9. Nazarian, S., Baker, M.R. and Crain, K. (1993), Development and Testing of a Seismic Pavement
Analyzer, Report SHRP-H-375, Strategic Highway Research Program, National Research
Council, Washington, D.C.
10. Gucunski, N., Consolazio, G.R. and Maher, A., “Concrete Bridge Deck Delamination Detection by Integrated Ultrasonic Methods,” International Journal Material and Product Technology, Special Issue on Non-Destructive Testing and Failure Preventive Technology, Vol. 26., No. ½, 2006, pp. 19-34.