Analysis and Quantification of the Benefits of
Interconnected Distribution System Operation
Steven M. Blair, Campbell D. Booth, Paul Turner, and Victoria Turnham
Abstract—In the UK, the Capacity to Customers (C2C) project is underway to determine the potential benefits of increased interconnection in distribution systems, combined with demand side response technology. Managed contracts with customers, i.e., the agreement that certain loads are interruptible following system faults, allows distribution circuits to be loaded beyond the limits presently required for security of supply. This potentially permits load growth but avoids the cost and environmental impact of conventional network reinforcement.
This paper provides the results of electrical system modelling to quantify the benefits of the C2C operation, using actual circuit data and typical load distributions. Based upon simulations of these circuits, it is shown that increased interconnection generally leads to minor improvements in electrical losses and system voltage. By connecting managed (i.e., interruptible) loads, circuits typically can be loaded significantly further than the present practice in the UK—an average increase of 66% for radial operation and 74% for interconnected systems.
Index Terms—Automation and control, demand side response, distribution, interconnection, load flow.
I. INTRODUCTION
I
NCREASING electrical network interconnection ispresently of interest for both transmission and distribution systems [1]. For distribution systems, interconnection offers several potential benefits, including: increased capacity for connecting load and generation, and therefore deferral or avoidance of network reinforcement costs; greater flexibility in the use of the available capacity; improved voltage profiles and voltage support; and reduced losses and voltage harmonic distortion due to lower system impedance. This is particularly relevant in the UK where 6.6 kV and 11 kV ring circuits, operating as two radial feeders, are common [2].
This paper quantifies the benefits of increased network in-terconnection, within the context of the Capacity to Customers (C2C) project [3] presently being led by Electricity North West
Limited in the UK. The project involves a consortium of ten industrial and academic partners. The aim of the C2C Project
is to test new technology, network operational practices (i.e., increased network interconnection), and commercial demand response contracts. These changes will allow the network operator to increase the loadings on a selection of trial circuits representing approximately 10% of its 6.6/11 kV network— without resorting to conventional network reinforcement. The project will thereby “release” inherent spare capacity in the
S. M. Blair and C. D. Booth are with the Institute for Energy and Environment, Department of Electronic and Electrical Engineering, University of Strathclyde, Glasgow, G1 1XW, UK (e-mail: [email protected]). P. Turner and V. Turnham are with Electricity North West Limited, Salford, Greater Manchester, M6 6QH, UK.
6.6/11 kV system in order to accommodate the future forecast increases in demand, whilst avoiding (or deferring) the cost and environmental impacts that are associated with traditional network reinforcement.
This paper focuses on the analysis of the effects of C2C
operation on electrical losses, the circuit voltage profile, and the available network capacity. This has been achieved using real system data for a representative proportion of the trial circuits.
II. PROJECTBACKGROUND
Fig. 1 provides a simplified overview of the aims of C2C.
Spare capacity—normally reserved for use during circuit out-ages when the system is operating in a reconfigured state, typically through a shift in the location of the normally-open point (NOP)—will be offered to new customers. This is possible due to a derogation from the normal requirements for security of supply in distribution networks in the UK, governed by Engineering Recommendation (ER) P2/6 [4]. By closing NOPs during normal system operation, additional loads with managed contracts for post-fault conditions can be connected: effectively sharing the capacity available from both radial feeders and avoiding or deferring the need for network reinforcement. The managed contracts permit the “C2C loads”
to be interrupted following fault conditions for a defined period of time. As depicted in Fig. 1b, by closing the NOP, it is also possible to connect a single large load using the spare capacity from both radial feeders (where each feeder has a maximum thermal capacity for 6 MVA of load). Network automation is important for ensuring correct and timely restoration of customers after faults, and for managing the available capacity. A field trial of C2C operation is presently underway,
in-volving 180 ring circuits throughout the Electricity North West network, as shown in Fig. 2. These circuits have been selected due to their relatively low historical rates of fault occurrence, and to ensure that excessive fault levels are not introduced by closing NOPs; these practical conditions would also be applicable if the C2C method is offered beyond the trial period.
From the 180 trial circuits, 36 circuits have been selected for detailed monitoring and analysis.
III. ELECTRICALSYSTEMMODELLING
A. Circuit Data
(a) Conventional radial operation, with no usable spare capacity (emergency capacity not presently offered to customers)
(b) C2C operation, with additional capacity for
interrupt-ible loads (large, single load)
(c) C2C operation, with additional capacity for
[image:2.612.314.566.53.311.2]interrupt-ible loads (distributed load growth)
Fig. 1. Capacity increase due to C2C network operation
Fig. 2. Map of C2C trial locations highlighted in yellow, from [5] (Map data
[image:2.612.91.256.73.258.2]©2013 GeoBasis-DE/BKG (©2009), Google)
Fig. 3. Example half-hourly feeder current, 1stJanuary 2012
data for all of the year 2012. Fig. 3 and Fig. 4 illustrate typical load current values for two radial feeders which form a ring circuit.
IPSA [6] has been used as a platform for integrating the data sources, as well as providing load flow functionality for analysing the performance of the selected ring circuits. Fig. 5 summarises the process of integrating the data sources and generating results. This process is fully automated for all 36 ring circuits.
The circuit loading data (as shown in Fig. 4) are processed to interpolate missing data values, although less than 0.5% of load current values are missing due to issues with the SCADA system or otherwise. The mean and peak annual loadings for each feeder are calculated and extracted.
[image:2.612.316.564.350.502.2]Fig. 5. IPSA import process
Fig. 4. Example daily mean feeder current, for 2012
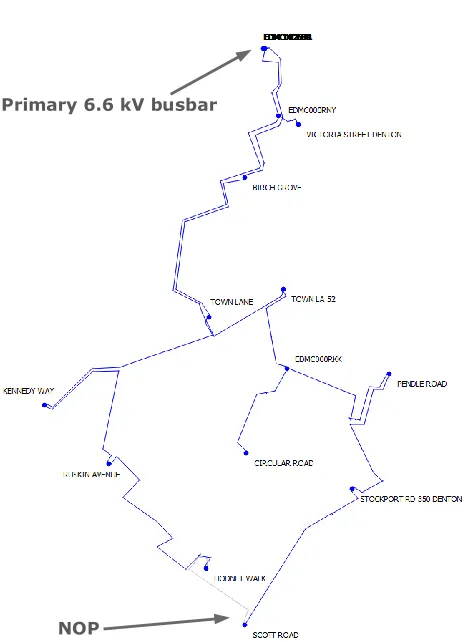
this investigation. A geographically-accurate IPSA model of each ring circuit is generated, as illustrated in Fig. 6. Each substation, represented by blue dots in Fig. 6, has a load connected. For simplicity, it is assumed that no distributed generation is connected to the system.
A script is executed within the IPSA scripting environment to:
1) Validate the electrical connectivity of the models. 2) Remove necessary elements from each model.
3) Connect a generator to the primary busbar to represent the grid infeed.
4) Determine the load scaling factor which matches the historical loading data for each feeder (based on either the annual mean or annual peak loading data).
5) Perform load flows, in both radial and interconnected configurations, and generate the results.
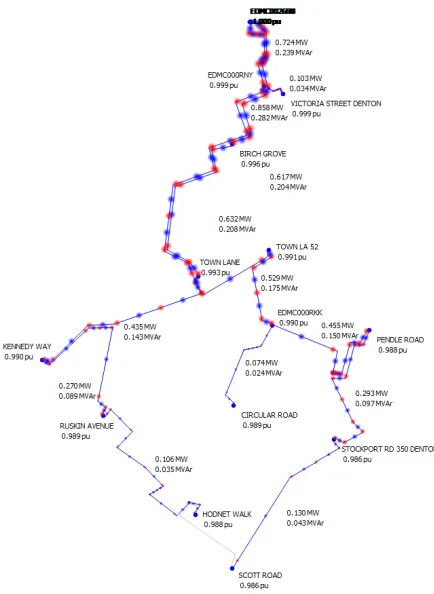
[image:3.612.325.557.203.524.2]B. Typical Circuit Results
Fig. 7a and Fig. 7b illustrate typical load flow results using IPSA, with the system operating in radial and interconnected configurations, respectively.
IV. RESULTS
A. Losses
Fig. 8 summarises the effect of C2C operation on electrical
(I2R) losses, by extrapolating the reduction in total annual losses resulting from interconnected ring circuit operation (rel-ative to radial operation). The majority of ring circuits exhibit
Primary 6.6 kV busbar
NOP
Fig. 6. Example of IPSA model of a ring circuit (blue dots represent substations) Ϭ Ϯ ϰ ϲ ϴ ϭϬ ϭϮ ϭϰ ϭϲ ϭϴ ͲϮ Ϭ Ͳϭ ϱ Ͳϭ
Ϭ Ͳϱ Ϭ ϱ
ϭ Ϭ ϭ ϱ Ϯ Ϭ Ϯ ϱ ϯ Ϭ ϯ ϱ ϰ Ϭ ϰ ϱ ϱ Ϭ ϱ ϱ ϲ Ϭ ϲ ϱ ϳ Ϭ ϳ ϱ ϴ Ϭ ϴ ϱ ϵ Ϭ ϵ ϱ ϭ Ϭ Ϭ E Ƶ ŵ ď Ğ ƌ Ž Ĩ K Đ Đ Ƶ ƌ ƌ Ğ Ŷ Đ Ğ Ɛ ZĞĚƵĐƚŝŽŶŝŶdŽƚĂůŶŶƵĂů>ŽƐƐĞƐ;DtŚͿ
[image:3.612.313.560.600.706.2](a) Load flow—radial configuration, mean loading (b) Load flow—interconnected configuration, mean loading Fig. 7. Example load flow results
an annual reduction in losses of approximately 5 MWh with the C2C configuration, assuming mean loadings. This equates
to a modest reduction in the mean distribution losses, for the 6.6/11 kV ring circuits under study; the mean total losses are reduced from 0.57% (radial) to 0.53% (interconnected).
B. Voltage
Fig. 9 illustrates the effect of interconnected operation on the minimum voltage experienced at any point in the ring circuit, at peak loading. These data include all spurs which branch off from the main circuit, which may experience lower voltages than the voltage at the NOP. In most cases, the min-imum voltage shows an improvement due to interconnected operation, even at peak loading.
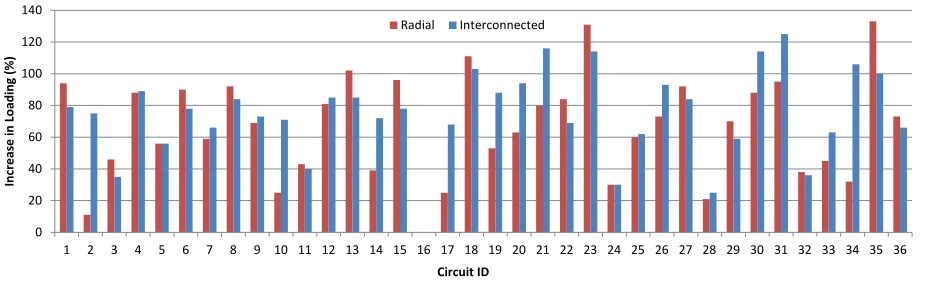
C. Capacity
The potential capacity available by adopting C2C operation
has been determined from the maximum possible additional interruptible load which can be connected, assuming that the load growth is distributed evenly throughout each ring circuit. Initially, each circuit is loaded to the conventional (i.e., according to ER P2/6) maximum capacity for non-interruptible loads. In each case, the load is increased until either:
1) A cable or line thermal headroom (i.e., the remaining thermal capacity) constraint is reached, or
2) A steady-state bus voltage constraint is reached (voltage less than 95% nominal voltage).
TABLE I
COMPARISON OF CIRCUIT CONSTRAINT TYPES
Radial operation
Interconnected operation
Voltage constraints 22% 17%
Thermal constraints 78% 83%
The results are provided in Fig. 10. Approximately 80% of circuits are limited by a thermal constraint rather than a voltage constraint, as given in Table I. For interconnected operation, a mean increase in loading of 74% is possible, compared with 66% for radial operation; this can be attributed to the reduced occurrence of voltage constraints as shown in Table I. For circuit 16 in Fig. 10, which is a rural network with a significant presence of relatively long overhead lines, the system presently operates close to the voltage limit and there is no prospect for directly adding any interruptible load (without also implementing other measures to support the network voltage).
V. CONCLUSIONS
[image:4.612.325.550.439.493.2]ͲϬ͘ϱϬ Ϭ͘ϬϬ Ϭ͘ϱϬ ϭ͘ϬϬ ϭ͘ϱϬ Ϯ͘ϬϬ Ϯ͘ϱϬ ϯ͘ϬϬ
ϭ Ϯ ϯ ϰ ϱ ϲ ϳ ϴ ϵ ϭϬ ϭϭ ϭϮ ϭϯ ϭϰ ϭϱ ϭϲ ϭϳ ϭϴ ϭϵ ϮϬ Ϯϭ ϮϮ Ϯϯ Ϯϰ Ϯϱ Ϯϲ Ϯϳ Ϯϴ Ϯϵ ϯϬ ϯϭ ϯϮ ϯϯ ϯϰ ϯϱ ϯϲ
[image:5.612.85.528.59.203.2]ŝĨ ĨĞ ƌĞ Ŷ ĐĞ ŝ Ŷ D ŝŶ ŝŵ Ƶ ŵ s Ž ůƚ Ă Ő Ğ ; й Ϳ ŝƌĐƵŝƚ/ DĞĂŶ>ŽĂĚŝŶŐ WĞĂŬ>ŽĂĚŝŶŐ
Fig. 9. Summary of difference in minimum voltage for C2C operation
Ϭ ϮϬ ϰϬ ϲϬ ϴϬ ϭϬϬ ϭϮϬ ϭϰϬ
ϭ Ϯ ϯ ϰ ϱ ϲ ϳ ϴ ϵ ϭϬ ϭϭ ϭϮ ϭϯ ϭϰ ϭϱ ϭϲ ϭϳ ϭϴ ϭϵ ϮϬ Ϯϭ ϮϮ Ϯϯ Ϯϰ Ϯϱ Ϯϲ Ϯϳ Ϯϴ Ϯϵ ϯϬ ϯϭ ϯϮ ϯϯ ϯϰ ϯϱ ϯϲ
/Ŷ Đƌ Ğ Ă ƐĞ ŝ Ŷ > Ž Ă Ě ŝŶ Ő ; й Ϳ ŝƌĐƵŝƚ/ ZĂĚŝĂů /ŶƚĞƌĐŽŶŶĞĐƚĞĚ
Fig. 10. Possible increase in circuit capacity resulting from C2C operation
increased, by approximately 74%. Interconnected operation yields a further improvement in the available capacity, as well as potentially permitting the use of spare capacity from both radial feeders.
Further work will analyse the impact of interconnection when connecting distributed generation and the feasibility of connecting single, large loads without requiring conventional network reinforcement. The effects of C2C operation on power
quality will be evaluated, using data captured from power quality monitoring equipment during the trial.
REFERENCES
[1] J.-C. Kim, S.-M. Cho, and H.-S. Shin, “Advanced Power Distribution System Configuration for Smart Grid,”IEEE Transactions on Smart Grid, vol. 4, no. 1, pp. 353–358, Mar. 2013.
[2] I. Chilvers, N. Jenkins, and P. Crossley, “Distance relaying of 11 kV circuits to increase the installed capacity of distributed generation,”IEE Proceedings - Generation, Transmission and Distribution, vol. 152, no. 1, p. 40, Jan. 2005.
[3] Electricity North West Ltd., “Electricity North West Capacity to Customers (C2C) project,” 2013. [Online]. Available: http://www.enwl.co.uk/c2c
[4] ENA, “Engineering Recommendation P2/6 - Security of Supply,” Tech. Rep., 2006.
[5] Electricity North West Ltd, “C2C - Postcode search,” 2013. [Online]. Available: http://www.enwl.co.uk/c2c/are-you-affected/postcode-search [6] TNEI Services Ltd, “IPSA Power,” 2013. [Online]. Available:
http://www.ipsa-power.com/
Steven M. Blairreceived the M.Eng. degree (with distinction) in computer
and electronic systems in 2008, and the Ph.D. degree in electrical engineering in 2013 from the University of Strathclyde, Glasgow, U.K.
He is currently a Research Associate at the University of Strathclyde. His research interests include power system protection, fault current limitation, marine electrical systems, communications, and real-time simulation.
Campbell D. Boothreceived the B.Eng. and Ph.D. degrees in electrical and
electronic engineering from the University of Strathclyde, Glasgow, U.K, in 1991 and 1996, respectively.
He is currently a Senior Lecturer with the Institute for Energy and Environment, Department of Electronic and Electrical Engineering, University of Strathclyde. His research interests include power system protection; plant condition monitoring and intelligent asset management; applications of intel-ligent system techniques to power system monitoring, protection, and control; knowledge management; and decision support systems.
Paul Turnerjoined United Utilities (subsequently Electricity North West) as
a graduate engineer in 1999. Since then he has carried out a variety of roles in the control environment, such as outage planning manager and automation development manager.
[image:5.612.80.543.251.394.2]Victoria Turnhamgraduated from the University of Manchester in 2008 with a masters degree in electrical and electronic engineering.
![Fig. 2. Map of C2C trial locations highlighted in yellow, from [5] (Map data©2013 GeoBasis-DE/BKG (©2009), Google)](https://thumb-us.123doks.com/thumbv2/123dok_us/1657347.119281/2.612.314.566.53.311/fig-map-trial-locations-highlighted-yellow-geobasis-google.webp)