ORIGINAL PAPER
A new GIS-based data mining technique using an adaptive
neuro-fuzzy inference system (ANFIS) and k-fold
cross-validation approach for land subsidence susceptibility
mapping
Omid Ghorbanzadeh1 •Hashem Rostamzadeh2•Thomas Blaschke1• Khalil Gholaminia3•Jagannath Aryal4,5
Received: 16 October 2017 / Accepted: 22 May 2018
The Author(s) 2018
Abstract
In this paper, we evaluate the predictive performance of an adaptive neuro-fuzzy inference system (ANFIS) using six different membership functions (MF). In combination with a geographic information system (GIS), ANFIS was used for land subsidence susceptibility mapping (LSSM) in the Marand plain, northwest Iran. This area is prone to droughts and low groundwater levels and subsequent land subsidence damages. Therefore, a land sub-sidence inventory database was created from an extensive field survey. Areas of land subsidence or areas showing initial signs of subsidence were used for training, while one-third of inventory database were reserved for testing and validation. The inventory data-base randomly divided into three different folds of the same size. One of the folds was chosen for testing and validation. Other two folds was used for training. This process repeated for every fold in the inventory dataset. Thereafter, land subsidence related factors, such as hydrological and topographical factors, were prepared as GIS layers. Areas sus-ceptible to land subsidence were then analyzed using the ANFIS approach, and land subsidence susceptibility maps were created, whereby six different MFs were applied. Lastly, the results derived from each MF were validated with those areas of the land subsidence database that were not used for training. Receiver operating characteristics (ROC) curves were drawn for all LSSMs, and the areas under the curves were calculated. The ROC analyses for the six LSSMs yielded very high prediction values for two out of the six methods, namely the difference of DsigMF (0.958) and GaussMF (0.951). The inte-gration of ANFIS and GIS generally led to high LSSM prediction accuracies. This study demonstrated that the choice of training dataset and the MF significantly affects the results.
Keywords Land subsidence susceptibility mappingAdaptive neuro-fuzzy inference systemk-fold cross-validationMarand plainIran
& Omid Ghorbanzadeh
omid.ghorbanzadeh@stud.sbg.ac.at
Extended author information available on the last page of the article
1 Introduction
Land subsidence is the downward motion of a land surface, including rock and soil. This movement happens suddenly or gradually when the underground layers cannot withstand the pressure of the upper layers (Pacheco et al.2006; Ashraf and Cawood2015). In most cases, land subsidence is a slow geological process that is hardly noticeable. The final result is a gradual reduction in the total height of the Earth’s surface (Ganguli 2011). Factors contributing to this phenomenon include earthquakes and the movement of the earth’s crust, melting glaciers, human activities in the fields of drilling and mineral extraction from underground sources, such as oil, and the drainage of water from under-ground aquifers (Dehghani et al.2014). More than 80% of land subsidence that occurs in the United States of America has been caused by continuous extraction of groundwater (Galloway et al.1999). The same situation also applies for Iran’s plains in general and the Marand plain in particular. Reductions in the volume of an aquifer through numerous water wells, excavated mainly for agricultural purposes, result in land subsidence. This natural hazard damages natural resources and human properties and constructions. In recent years, several studies have been carried out in the field of land subsidence with different methods and approaches. In southern New Jersey, Sun et al. (1999) used statistical and regression methods to study the relationship between land subsidence and the exploitation of groundwater. In a similar study in West Bengal (India), Ganguli (2011) proposed spreadsheet-based statistical analyses. Lee et al. (2012) assessed ground subsidence sus-ceptibility (GSS) in South Korea using artificial neural networks (ANN). A GIS-MCDA method was also used by Ghorbanzadeh et al. (2017) to identify areas that are prone to land subsidence in the Marand plain, while Dehghan-Soraki et al. (2015) applied ASAR and PALSAR data to analyze and measure the land surface change rates caused by subsidence. Karimzadeh et al. (2013) and Karimzadeh (2015) used the same type of data in order to distinguish the surface deformation in another basin in the Northwest of Iran.
tried to develop more and more accurate methods to map susceptible areas, either through combining different methods such as combining AHP and fuzzy logic (Feizizadeh et al.
2013), using factor score matrix with AHP that called modified AHP (M-AHP) (Nefeslioglu et al. 2013), integrating interval pairwise comparison matrices with the GIS-MCDAs (Feizizadeh and Ghorbanzadeh,2017) and combining ensemble frequency ratio with logistic regression models (Umar et al.2014) and analytic network process (ANP) (Pirnazar et al.
2017). There are also several attempts to develop new methods such as the methodology of using the global sensitivity analysis for GIS-MCDAs developed by Ligmann-Zielinska and Jankowski (2012) (Ghorbanzadeh et al.2017). Our research utilizes the ANFIS by applying the Takagi–Sugeno rule format. This format is a combination of optimized premise MFs with an optimized consequent equation (Bui et al. 2012). ANFIS is an inference system with a high capacity (Sezer et al.2011). It has also some advantages compared to other suscepti-bility mapping methods such as expert-knowledge-based GIS-MCDA. GIS-MCDA is sometimes criticized for the expert knowledge to be a major source of uncertainty among the results (S¸alap-Ayc¸a and Jankowski2016; Feizizadeh and Kienberger2017; Erlacher et al.
2017; Feizizadeh and Ghorbanzadeh 2017; Cabrera-Barona and Ghorbanzadeh 2018) or ordinary neural networks because they use if–then rules (Bardestani et al.2017). The pro-posed method does not apply expert opinions at any stage. In addition, it provides the possibility of using a variety of fuzzy MFs. This method is also known for fast convergence times (Pandey and Sinha2015). By using the input and target data, ANFIS can provide a fuzzy inference structure (Cakıt and Karwowski 2017) in which the MF parameters use hybrid learning algorithms to adjust themselves (Bui et al. 2012). The main differences between the literature discussed above and our study are that we used the ANFIS method with different MFs and also k-fold cross-validation (CV) applied to LSSM. We used the k-fold CV approach to deal with the randomness effects on model performance (Gilks and Richardson 1995). With respect to the spatial distribution of land subsidence areas, it is expected that the performance of ANFIS method affect with the random selection of training data. We also used a different approach to bring the layers (maps) related to the ANFIS calculation as input data into the MATLAB software. We used GIS capabilities for the integration of various spatial information with varying spatial resolutions and entities and for applying overlay methods within the ANFIS process. In addition, although the environmental modeling community relies on ANFIS as a powerful and precise method, it has, to our best knowledge, not been used for LSSM. Our study consists of three stages: first, we will introduce the data layers and maps related to land subsidence in the Marand plain. Second, we will produce maps of susceptible areas using these layers combined with hybrid learning and different MFs. Finally, we will validate the maps produced for each of the MFs.
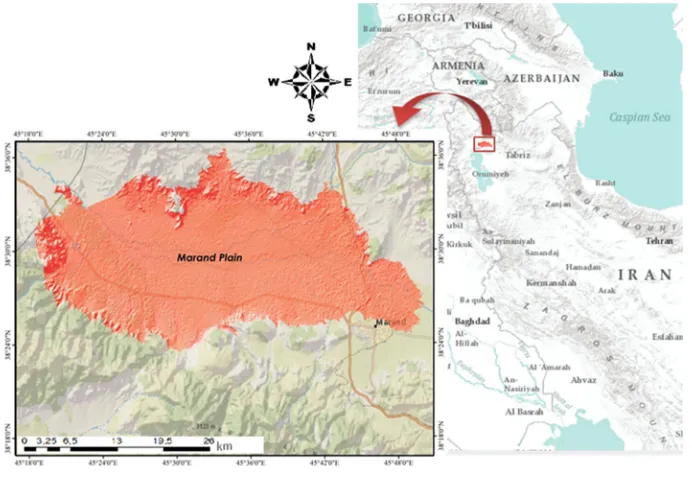
2 Study area
structural units (Barzegar et al.2017). The Marand plain is part of the Khazar basin, which is one of the six major hydrological basins in Iran and covers most parts of Northern Iran (Karimzadeh 2015). From a geological point of view, the study area coincides with the same lithological formation, namely a high level piedmont fan and valley terrace deposits Qft1belonging to the Quaternary age (Khaleghi and Shahverdizadeh2014).
The primary local activity is agriculture, including irrigated and rain fed agriculture and orchards (Khorrami2016; Ghorbanzadeh et al.2017). Agriculture in the region requires a huge amount of surface and underground water. Over the last years, the mean annual precipitation amounts have declined in the study area (Hajalilou and Khaleghi2009), thus increasing the need to use excessive groundwater extraction (Karimzadeh2015). This is the main contributing factor leading to the reduction of groundwater levels in this area (Fakhri et al. 2015). Still, the analysis cannot focus on agriculture alone but needs to address complex land use patterns and, in particular, the different water sources such as excavated water wells and dams.
3 Materials and methods
3.1 Data used
[image:4.439.48.394.57.296.2]resolution of the Landsat satellite images that served as the basis of the land cover map, and the SRTM data on which the topography dataset indictors are based, are 30 m, all pixels were aggregated to 100 m for the modeling for performance reasons and faster computation. As land subsidence phenomena typically cover relatively large areas, this resolution seems appropriate. Moreover, a land subsidence inventory map with a total of 23 land subsidence areas with 522 pixels was prepared to train, test and validate the model.
[image:5.439.49.390.137.594.2]The land subsidence inventory has been collected by locals based on inquiries from the Department of Natural Resources (East Azerbaijan Province, Iran). 70% (364 pixels) of land subsidence areas within the study area were randomly selected and used as training data. These pixels obtain the information from corresponding pixels of each layer and were used to train the models. The rest of the pixels were used as testing and validation data in two separate groups.
3.2 Land subsidence susceptibility mapping using an adaptive neuro-fuzzy inference system
3.2.1 Fuzzy inference system
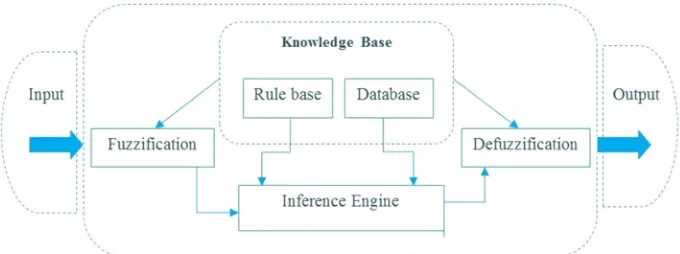
A fuzzy inference system (FIS) includes expert knowledge and experience to design a process with input and output fuzzy sets that are controlled by if–then rules (Armaghani et al. 2015a). In simple terms, a FIS is a system which can obtain new knowledge from existing knowledge by using fuzzy logic (Camastra et al.2015; Cavallaro2015). A fuzzy inference system is made up of three sections: the first section is the fuzzification process when all crisp values are converted to a linguistic input value using a MF of the system (Tahmasebi and Hezarkhani2012). The inference engine is the second part and is used to assess the degree of membership of input data based on the output fuzzy sets (Bui et al.
2012). Finally, the fuzzy output values are converted to crisp values in a process called defuzzification (Armaghani et al. 2015a). It can be said that the inference system can produce fuzzy output values based on inference rules as soon as it obtains fuzzy values. The process is presented in Fig.3.
Generally, three main fuzzy inference systems are used in the literature: The Mamdani model, the Takagi and Sugeno (TKS) model, and the Tsukamoto model. The second model (TKS) is more common (Shabankareh and Hezarkhani2016) and used in this study. This model renders possible to create fuzzy rules from input data. Moreover, most of the problems do not need rigid conditions in their relative factors which are introduced to the model as input data (Wang et al.2011). The difference between the Mamdani and TKS models were explained by Cavallaro (2015). The main reason for using the Takagi and Sugeno model in this study is that it is a linear combination of inputs and has fuzzy inputs and crisp outputs (Naderloo et al.2017). It is also a very efficient computational method for optimization as well as in terms of its implementation (Takagi and Sugeno1985; Cavallaro2015).
[image:6.439.50.390.468.595.2]3.2.2 Introducing adaptive neuro-fuzzy inference system structure
ANFIS consists of a hybrid model in which the nodes in different layers of the network provide a neural network for estimating the fuzzy parameters (Polykretis et al.2017). This model takes advantage of both fuzzy logic and artificial neural networks and combines both approaches making the most of their respective advantages. For further explanation, part aof Fig.4shows a Sugeno fuzzy model with two rules of fuzzy if– then, with two input values x andy, andf as an output (Jang 1993; Armaghani et al.
2015b).
If xisA1andyisB1, thenf1=p1x?q1y ?r1(rule 1)
If xisA2andyisB2, thenf2=p2x?q2y ?r2(rule 2)
The functions ofxandyareA1,A2,B1,B2and output function parameters include,p1,
q1,r1,p2,q2,r2. Each fuzzy inference system consists of five different layers and two types
of nodes which are adaptive and fixed nodes (see partbof Fig.4).
[image:7.439.50.390.259.598.2]The difference between these two types of nodes is that adaptive nodes are flexible while fixed nodes are determined through cycles. In the case of differences between layers, it can be noted that the nodes with an index iin layer (1) are adaptive and related to linguistic variables (Lin et al.2012). Input values are sent directly to the next layer by these nodes.
O1;i¼lAiðxÞ ð1Þ
O1;i¼lAiðyÞ ð2Þ
All nodes in layer (2), which are shown with aPsign, are fixed nodes, and each node determines the input and output signals (Zhang et al.2017).
O2;i¼x¼lAiðyÞBðyÞ i¼1;2 ð3Þ
In layer (3), all nodes are shown with anN; they are fixed and are also identified with circles (Bardestani et al.2017). Another issue in this layer is that outputs are normalized.
O3;i¼x¼
wi
P2
j¼1wj
i¼1;2 ð4Þ
All nodes in layer (4) are adaptive, and their forms are as described by the following function:
O4;i¼xifi¼xðpixþqiyþriÞ ð5Þ
Layer (4) is considered to be the final layer. It has only one fixed node which is shown with aPrepresenting the sum. The output value of the layer is obtained by the sum of input signals (Basser et al.2014; Bardestani et al.2017).
o5;i¼
X
i
xifi¼
P
ixifi
P
ixi
i¼1;2 ð6Þ
3.2.3 Hybrid learning algorithm
An ANN learning algorithm is used in ANFIS to set up the fuzzy inference system with determined input and output data (Tahmasebi and Hezarkhani 2012). A hybrid learning algorithm was used for training. This algorithm consists of a least-square estimator and gradient descent method (Anwer et al.2012; Pandey and Sinha2015). The main objective of the training is to find the optimal parameters for the fuzzy inference system with the minimum value of the error functionE,which is the difference between the target amount (ti) and the output value of the model (fouti) (Bui et al.2012). Assume that the training data
includesninput data.
E¼X
n
i¼1
Output that results of layer 5 can be expressed by the equation:
f ¼x1f1þx1f2¼ ðx1xÞp1þ ðx1yÞq1þx1r1þ ðx2xÞp2þ ðx2yÞq2þx2r2 ð8Þ
The above equation can be summarized as follows:f=A.Rwhere any of the equation parameters are defined as (9):
F¼ fout1 fout2 foutn 2 6 6 6 4 3 7 7 7 5; A¼
x1x1 x1y1 x1 x2x2
x1x2 x1y2 x1 x2x2
x1xn x1yn x1 x1xn
x2y2
x2y2
x1yn
x2 x2 x2 2 6 6 6 4 3 7 7 7 5;
RT ¼½p1q1r1p1q1r1
ð9Þ
Parameters pi, qi, and ri are unknowns, which can be obtained using the following
equation:
R = (ATA)-1ATfwereTis the transpose of the matrix.
The forwards pass of the model moves to the output of the fourth layer of nodes. The backwards pass acts when the next optimal parameters are found (Sengur,2008; Bui et al.,
2012). In this stage, error signals were spreading to the rear side, and premise parameters are restored using gradient descent [see Eq. (10)] (Esen et al.2017):
Da¼ g dE
da ð10Þ
wheregis a learning rate.
3.2.4 Obtaining land subsidence indexes for mapping
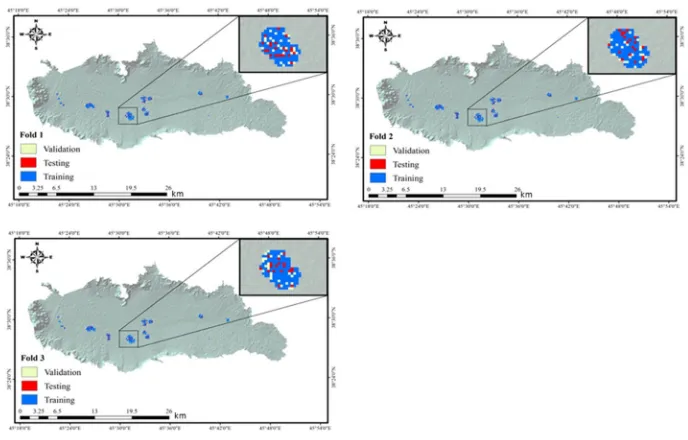
In this study, seven criteria maps were used as input data, and the land subsidence areas layer was defined as the target. The pixels of these areas received all data from the corresponding pixels in the seven criteria maps during the implementation of ANFIS. All these layers were prepared and finally extracted from ArcGIS software (version 10.1) with a pixel size of 5099207. Each creation layer is composed of 105, 363 pixels in total. The entire ANFIS process, including training and testing, was implemented in MATLAB. Generally, the ANFIS model requires two types of data, namely training data and testing data (Dixon2005; Bui et al.2012). There were 23 land subsidence areas in this study, consisting of 522 pixels. k-fold CV approach was used for dividing our inventory dataset into training and testing. In this approach, the datasetDis randomly divide into mutually exclusive k-foldsD1,D2,…,Dkof equal size. Thereafter, the model is runktimes and each
time t[{1, 2, …, k}. For the time oft, the model is trained with dataset Dwithout the subset ofDt, and tested with Dt(Kohavi1995). The selection of the number of folds is
validation. In the third fold, pixels were divided randomly into two separate groups, 87 pixels for testing and 87 pixels for data validation. The dispersion of land subsidence inventory in different three folds is shown in Fig.5. Descriptive information of all layers was transferred to MATLAB as a matrix. The first column of the matrix was the joint field of each pixel for all layers of criteria including the land subsidence areas layer. The joint field is essential to maintain the structure of the maps. It maintains cohesion, arrangements and the position of pixels in all phases of the process. Each of the next seven columns was assigned to descriptive information of each criterion. Finally, the last column was dedi-cated to land subsidence areas with possible values in this column of zero or one. A value of one indicates that subsidence occurred in that pixel, and a value of zero indicates the absence of the phenomenon. As previously mentioned, the type of fuzzy inference system used is the Sugeno model. It was run with six different types of MFs (see Table1). Fifty epochs were employed for training the model. The model output for each of the six MFs was a respective matrix with elements between 0 and 1.
Although there are ways of converting the GIS layers into a format that is usable in MATLAB, and vice versa, the fishnet function in ArcGIS was used for converting. In the input data, the value of each pixel was given to a point. Likewise, the output data of the model were transferred into a matrix in the GIS software, while the value of each element was transferred to the corresponding pixels of the fishnet. Pixels that were exactly the same size and had the same number of input layers were placed in the same rows and columns (Parish et al. 2012). As discussed earlier, the LSSM maps were produced using six dif-ferent MFs. The performance assessments of the trained land subsidence models were examined with two evaluating statistical parameters, namely, the root-mean-square error (RMSE) (11) and the coefficient of determination (R2) (12), as suggested by various researchers (Bui et al.2012; Folorunsho et al.2012; Chai and Draxler2014; Singh et al.
2017).
[image:10.439.47.391.382.602.2]RMSE¼
ffiffiffiffiffiffiffiffiffiffiffiffiffiffiffiffiffiffiffiffiffiffiffiffiffiffiffiffiffiffiffiffiffiffiffi 1
N Xn
i¼1
ðfoutitiÞ2
s
ð11Þ
R2¼1
Pn
i¼1ðfoutitiÞ2
Pn i¼1fout
2
i
" #
ð12Þ
where foutiandtiare theith observed and the model predicted outputs (Singh et al.2012).
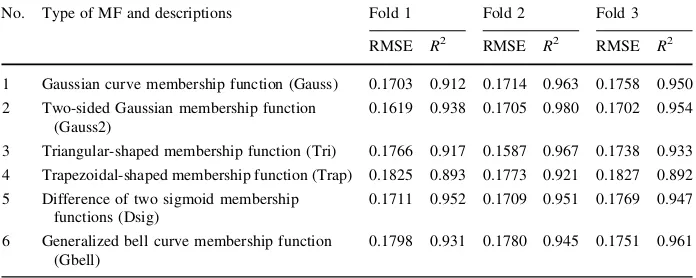
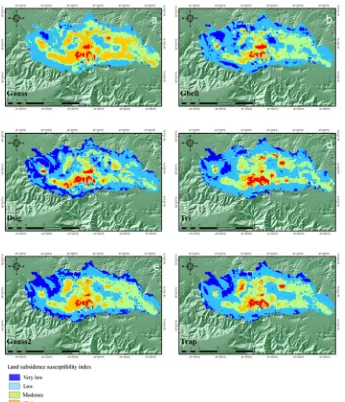
The observed subsidence polygons were created with GPS from field survey. After that, they mapped in a layer same as other input layers with ArcMap software. Then, all layers transferred to MATLAB as matrices that each element corresponding to a pixel. The pixels within the subsidence polygons were used in developing those matrices and then calcu-lating RMSE andRsquared values. In terms of resulted values ofR2, the best performance was obtained for Gauss2MF in the second fold with the value of 0.980. The best result of RMSE value was 0.158 for TriMF again in the second fold. However, the lowest RMSE and R2 values were obtained with GbellMF (0.185) and TrapMF (0.892), respectively. Both lowest values were obtained from the third fold of the dataset. All values are shown in Table1. As we present in Sect.4, the model got the best result with using the second fold of dataset for testing and rest parts for training. The best results by the second fold are presented in Fig.6, and other results are not presented keeping in mind the length of the manuscript. Generated maps were classified into five classes from very low to very high susceptibility of land subsidence, and the area of each class is represented in Table2. They are also compared with each other in Fig.7.
4 Validation
Validation is considered to be an essential phase in preparing susceptibility maps and in assessing the ability of the model to predict possible future hazards (Pourghasemi et al.
[image:11.439.46.394.72.211.2]2012; Feizizadeh et al.2014b). ANFIS method uses training and testing dataset that are randomly selected, the k-fold CV approach was used to mitigate the uncertainties resulted by random selection of dataset (Hahn et al.2010). The CV approach is often used to select Table 1 Description MFs and statistical criteria of RMSE,R2for each fold
No. Type of MF and descriptions Fold 1 Fold 2 Fold 3
RMSE R2 RMSE R2 RMSE R2
1 Gaussian curve membership function (Gauss) 0.1703 0.912 0.1714 0.963 0.1758 0.950 2 Two-sided Gaussian membership function
(Gauss2)
0.1619 0.938 0.1705 0.980 0.1702 0.954
3 Triangular-shaped membership function (Tri) 0.1766 0.917 0.1587 0.967 0.1738 0.933 4 Trapezoidal-shaped membership function (Trap) 0.1825 0.893 0.1773 0.921 0.1827 0.892 5 Difference of two sigmoid membership
functions (Dsig)
0.1711 0.952 0.1709 0.951 0.1769 0.947
6 Generalized bell curve membership function (Gbell)
the regularization parts in big datasets (Lim and Yu2016). The simplicity and universality of this approach make it a widespread strategy for the estimate of model performance (Arlot and Celisse2010). As mentioned in Sect.3.2.4, we randomly split our datasetDto mutually exclusive 3 folds D1,D2,D3of equal size. Complete CV is calculated by the
average of all mm
=k
possibilities for any selection of m/kinstances out ofm (Kohavi
[image:12.439.49.394.55.457.2]Table 2 The class areas for each of the MFs
Type of MF Class Area (ha) Area (%) Type of MF Class Area (ha) Area (%)
Gaussian curve Difference of two sigmoid
Very low 1019 1.76 Very low 11870 20.59
Low 22985 39.88 Low 27628 47.94
Average 18633 32.33 Average 12610 21.88
High 13781 23.91 High 3873 6.72
Very high 1211 2.10 Very high 1648 2.85 Two-sided Gaussian Trapezoidal-shaped
Very low 10739 18.63 Very low 7258 12.59
Low 21642 37.55 Low 27335 47.43
Average 17857 30.98 Average 17157 29.77
High 6462 11.21 High 4347 7.54
Very high 929 1.61 Very high 1532 2.65
Generalized bell curve Triangular-shaped
Very low 6639 11.52 Very low 6246 10.83
Low 30536 52.98 Low 29771 51.65
Average 16178 28.07 Average 15769 27.36
High 3322 5.76 High 3824 6.63
Very high 954 1.65 Very high 2019 3.50
0% 10% 20% 30% 40% 50% 60%
Gaussmf Gauss2mf Gbellmf Dsigmf Trapmf Trimf
Very low Low Average High Very high
Fig. 7 Comparing the percentage of areas for each of the MFs
Table 3 The percentage of accuracy results of each fold
MF AUCFold 1 AVEFold1 AUCFold 2 AVEFold2* AUCFold 3 AVEFold3 CV
Gauss 94.19 92.98 95.12 94.11 95.00 93.79 94.77
Gauss2 91.62 92.79 93.33 92.58
Tri 91.53 92.83 92.22 92.19
Trap 91.46 93.04 92.59 92.36
Dsig 95.08 95.88 95.13 95.36
[image:13.439.50.392.346.444.2] [image:13.439.47.398.490.587.2]prediction systems (Swets1988; Oh and Pradhan2011) and based on the theory behind the ROC, the area under the curve (AUC) indicates the quality of a prediction system, whereby values close to 1.0 are considered to indicate the best results of a model (Lombardo et al.
2015). Based on resulted LSSMs, ROC curves were calculated separately for each fold (see Fig.9) and each MF (see Fig.10). The rate of true-positives was plotted on the vertical axis. The horizontal axis shows the rate of false-positives for all resulting prediction maps. Each scenario corresponds to a point in the plotted space. Finally, the accuracy results of each MF within each fold were calculated and are presented in Table3. The average values of MF accuracies for each fold are also presented for better comparison. Based on the average values,AVEFold 2 *indicates the most accurate results derived from the ANFIS
method using second fold data sets among the three folds. Figure6presents the LSSMs that are generated and tested with the second fold dataset. In the case of using this fold model, DsigMF yielded the best result in ROC value (0.958), followed by GaussMF (0.951), GbellMF (0.950), TrapMF (0.930), TriMF (0.928), and Gauss2mf (0.927). DsigMF also got the best result in CV with the ROC value of more than 0.953.
[image:15.439.48.391.267.613.2]5 Discussion and conclusion
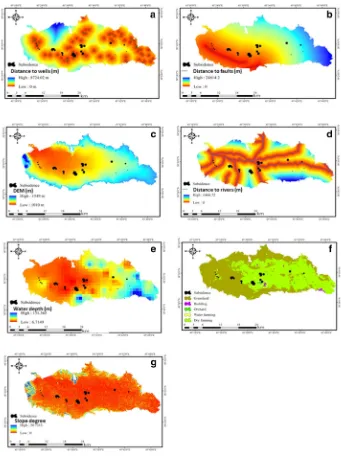
[image:16.439.50.388.53.522.2]subsidence is a severe problem in the plains of northwestern Iran. The study area is particularly susceptible to land subsidence with potentially severe consequences, and the Marand plain is one of six critical plains in the East Azerbaijan Province (MWREP2014). It may take several years from the onset of land subsidence until visible damages occur at the surface of a plain (Lee et al.2012). Land subsidence can have a variety of reasons and sometimes a combination of several triggering factors. However, in this study area, massive exploitation of groundwater resources is regarded as the main reason for a severe decline in groundwater levels in the last three decades (Fakhri et al.2015). In the present study, GIS techniques along with an adaptive neuro-fuzzy inference system (ANFIS) were used for a land subsidence susceptibility assessment in the Marand plain using six different MFs and three folds of dataset. The study consisted of three main steps: the design and structuring of the ANFIS model, the susceptibility mapping, and a validation step for different MFs and folds used. In the first step, an ANFIS model was constructed in MATLAB software environment, and six different MFs were selected to be used in the model. In the second step, seven environmental criteria were identified, including distance to excavated water wells, DEM, land use/cover, distance to fault, depth of groundwater, distance to stream, and slope. These data layers were used as the model inputs. These relative causal criteria played an important role in generating the final land subsidence susceptibility map products. All of the resulting land subsidence susceptibility maps show that the central and western parts of the plain are more susceptible to ground subsidence. Still, as presented in Table2, there are some differences. The TriMF map revealed the largest area of land highly susceptible to subsidence (3.5%). Gauss2MF yielded the smallest areas with 1.6%. The performance assessment of the ANFIS model revealed Gauss2MF and GbellMF to have the highest performances with 0.98 and 0.96 for R2 values, and 0.170 and 0.175 for RMSE values in different folds. But this is not to say that Gauss2MF and GbellMF always achieve the best model results. The performance of MFs depends on several parameters, such as the distribution of training and test data, and their performance may differ in other studies with different data. The ROC method was used to validate the six different MFs along with three folds, whereby all yielded high to very high values, but the DsigMF showed the best result in CV. Therefore, we presented two evaluation methods: first, we used RMSE and R2 with different folds of test data, and, second, we applied each fold of validation data to evaluate the results within the ROC curves, and DsigMF showed the best performance for the land subsidence susceptibility assessment in overall. To sum up, as ANFIS is a very technical method and sensitive to design decisions in all of the required steps, including the selection of the MFs, it is essential to choose the right parameters. At the same time, the model is less sensitive to differences in expert opinions. That is why this model is more reliable than the models that are based on expert knowledge. The limitation of this model is that researchers cannot directly obtain the absolute importance/weight of each individual factor.
Acknowledgements Open access funding provided by Austrian Science Fund (FWF). This research was partly funded by the Austrian Science Fund (FWF) through the Doctoral College GIScience (DK W 1237-N23) at the University of Salzburg. We would like to thank for support and help of Dr. Bakhtiar Feizizadeh (Department of Remote Sensing and GIS, University of Tabriz).
gave advice on the ANFIS modeling part and contributed in refining the validation section. All authors read and approved the final manuscript.
Compliance with ethical standards
Conflicts of interest The authors declare that they have no conflict of interest.
Open Access This article is distributed under the terms of the Creative Commons Attribution 4.0 Interna-tional License (http://creativecommons.org/licenses/by/4.0/), which permits unrestricted use, distribution, and reproduction in any medium, provided you give appropriate credit to the original author(s) and the source, provide a link to the Creative Commons license, and indicate if changes were made.
References
Anwer N, Abbas A, Mazhar A, Hassan S (2012) Measuringweather prediction accuracy using sugeno based Adaptive Neuro Fuzzy Inference system, grid partitioning and guassmf. In: 2012 8th international conference on computing technology and information management (ICCM), IEEE, vol 1, pp. 214–219 Arlot S, Celisse A (2010) A survey of cross-validation procedures for model selection. Stat Surv 4:40–79 Armaghani DJ, Hajihassani M, Sohaei H, Mohamad ET, Marto A, Motaghedi H, Moghaddam MR (2015a) Neuro-fuzzy technique to predict air-overpressure induced by blasting. Arab J Geosci 8(12):10937–10950
Armaghani DJ, Hajihassani M, Monjezi M, Mohamad ET, Marto A, Moghaddam MR (2015b) Application of two intelligent systems in predicting environmental impacts of quarry blasting. Arab J Geosci 8(11):9647–9665
Ashraf H, Cawood F (2015) Geospatial subsidence hazard modelling at Sterkfontein Caves. South Afr J Geomat 4(3):273–284
Bardestani S, Givehchi M, Younesi E, Sajjadi S, Shamshirband S, Petkovic D (2017) Predicting turbulent flow friction coefficient using ANFIS technique. SIViP 11(2):341–347
Barzegar R, Moghaddam AA, Tziritis E, Fakhri MS, Soltani S (2017) Identification of hydrogeochemical processes and pollution sources of groundwater resources in the Marand plain, northwest of Iran. Environ Earth Sci 76(7):297
Basser H, Shamshirband S, Petkovic´ D, Karami H, Akib S, Jahangirzadeh A (2014) Adaptive neuro-fuzzy prediction of the optimum parameters of protective spur dike. Nat Hazards 73(3):1439–1449 Boria RA, Olson LE, Goodman SM, Anderson RP (2014) Spatial filtering to reduce sampling bias can
improve the performance of ecological niche models. Ecol Model 275:73–77
Bui DT, Pradhan B, Lofman O, Revhaug I, Dick OB (2012) Landslide susceptibility mapping at Hoa Binh province (Vietnam) using an adaptive neuro-fuzzy inference system and GIS. Comput Geosci 45:199–211
Cabrera-Barona P, Ghorbanzadeh O (2018) Comparing classic and interval analytical hierarchy process methodologies for measuring area-level deprivation to analyze health inequalities. Int J Environ Res Public Health 15(1):140
Cakıt E, Karwowski W (2017) Predicting the occurrence of adverse events using an adaptive neuro-fuzzy inference system (ANFIS) approach with the help of ANFIS input selection. Artif Intell Rev 48(2):139–155
Cam E, Yildiz O (2006) Prediction of wind speed and power in the central Anatolian region of Turkey by adaptive neuro-fuzzy inference systems (ANFIS). Turk J Eng Environ Sci 30(1):35–41
Camastra F, Ciaramella A, Giovannelli V, Lener M, Rastelli V, Staiano A, Staiano G, Starace A (2015) A fuzzy decision system for genetically modified plant environmental risk assessment using Mamdani inference. Expert Syst Appl 42(3):1710–1716
Cavallaro F (2015) A Takagi–Sugeno fuzzy inference system for developing a sustainability index of biomass. Sustainability 7(9):12359–12371
Chai T, Draxler RR (2014) Root mean square error (RMSE) or mean absolute error (MAE)?–Arguments against avoiding RMSE in the literature. Geosci Model Dev 7(3):1247–1250
Chen W, Pourghasemi HR, Panahi M, Kornejady A, Wang J, Xie X, Cao S (2017b) Spatial prediction of landslide susceptibility using an adaptive neuro-fuzzy inference system combined with frequency ratio, generalized additive model, and support vector machine techniques. Geomorphology 297:69–85 Dehghani M, Rastegarfar M, Ashrafi RA, Ghazipour N, Khorramrooz HR (2014) Interferometric SAR and
geospatial techniques used for subsidence study in the Rafsanjan plain. Am J Environ Eng 4(2):32–40 Dehghan-Soraki Y, Sharifikia M, Sahebi MR (2015) A comprehensive interferometric process for moni-toring land deformation using ASAR and PALSAR satellite interferometric data. GISci Remote Sens 52(1):58–77
Dixon B (2005) Applicability of neuro-fuzzy techniques in predicting ground-water vulnerability: a GIS-based sensitivity analysis. J Hydrol 309(1):17–38
Erlacher C, Jankowski P, Blaschke T, Paulus G, Anders KH (2017) A GPU-based parallelization approach to conduct spatially-explicit uncertainty and sensitivity analysis in the application domain of landscape assessment. GI_Forum 2017(1):44–58
Esen H, Esen M, Ozsolak O (2017) Modelling and experimental performance analysis of solar-assisted ground source heat pump system. J Exp Theor Artif Intell 29(1):1–17
Feizizadeh B, Ghorbanzadeh O (2017) GIS-based interval pairwise comparison matrices as a novel approach for optimizing an analytical hierarchy process and multiple criteria weighting. GI_Forum 1:27–35 Feizizadeh B, Kienberger S (2017) Spatially explicit sensitivity and uncertainty analysis for
multicriteria-based vulnerability assessment. J Environ Plan Manag 60(11):2013–2035
Feizizadeh B, Blaschke T, Roodposhti MS (2013) Integrating GIS-based fuzzy set theory in multicriteria evaluation methods for landslide susceptibility mapping. Intern J Geoinform 9(3):49–57
Feizizadeh B, Roodposhti MS, Jankowski P, Blaschke T (2014a) A GIS-based extended fuzzy multi-criteria evaluation for landslide susceptibility mapping. Comput Geosci 73:208–221
Feizizadeh B, Jankowski P, Blaschke T (2014b) A GIS based spatially-explicit sensitivity and uncertainty analysis approach for multi-criteria decision analysis. Comput Geosci 64:81–95
Feizizadeh B, Roodposhti MS, Blaschke T, Aryal J (2017) Comparing GIS-based support vector machine kernel functions for landslide susceptibility mapping. Arab J Geosci 10(5):122
Folorunsho JO, Iguisi EO, Mu’azu MB, Garba S (2012) Application of adaptive neuro fuzzy inference system (Anfis) in River kaduna discharge forecasting. Res J Appl Sci Eng Technol 4(21):4275–4283 Galloway DL, Jones DR, Ingebritsen SE (1999) Land subsidence in the United States, vol 1182. US
Geological Survey
Ganguli M (2011) Groundwater withdrawal and land subsidence: a study of Singur Block, West Bengal, India. Intern J Geom Geosci 2(2):465
Gaspar JL, Goulart C, Queiroz G, Silveira D, Gomes A (2004) Dynamic structure and data sets of a GIS database for geological risk analysis in the Azores volcanic islands. Nat Hazards Earth Syst Sci 4(2):233–242
Ghorbanzadeh O, Feizizadeh B, Blaschke T (2017) Multi-criteria risk evaluation by integrating an analytical network process approach into GIS-based sensitivity and uncertainty analyses. Geomat Nat Hazards Risk 9(1):127–151
Gilks WR, Richardson S, Spiegelhalter D (eds) (1995) Markov chain Monte Carlo in practice. CRC Press, Boca Raton
Hahn PR, Mukherjee S, Carvalho C (2010) Predictor-dependent shrinkage for linear regression via partial factor modeling. arXiv preprintarXiv:1011.3725
Hajalilou B, Khaleghi F (2009) Investigation of hydro geochemical factors and groundwater quality assessment in Marand Municipality, northwest of Iran: a multivariate statistical approach. J Food Agric Environ 7(3&4):930–937
Jang JS (1993) ANFIS: adaptive-network-based fuzzy inference system. IEEE Trans Syst Man Cybern 23(3):665–685
Karimzadeh S (2015) Characterization of land subsidence in Tabriz (NW Iran) using watershed and InSAR analyses, Acta Geodaetica Geophys, Springer, 51: 181–195
Karimzadeh S, Cakir Z, Osmanoglu B, Schmalzle G, Miyajima M, Amiraslanzadeh R, Djamour Y (2013) Interseismic strain accumulation across the North Tabriz Fault (NW Iran) deduced from InSAR time series. J Geodyn, Elsevier, 66: 53–58
Khaleghi F, Shahverdizadeh GH (2014) Hydrogeochemical characteristics and evaluation of the drinking and irrigation water quality in Marand Plain, East Azerbaijan, NW Iran. Br J Appl Sci Technol 4(17):2458
Khorrami B (2016) Assessment of groundwater withdrawal applying GIS. M.Sc. Thesis, University of Tabriz, Tabriz, p. 110
Lee S, Park I (2013) Application of decision tree model for the ground subsidence hazard mapping near abandoned underground coal mines. J Environ Manage 127:166–176
Lee S, Ryu JH, Won JS, Park HJ (2004) Determination and application of the weights for landslide susceptibility mapping using an artificial neural network. Eng Geol 71(3):289–302
Lee S, Park I, Choi JK (2012) Spatial prediction of ground subsidence susceptibility using an artificial neural network. Environ Manag 49(2):347–358
Ligmann-Zielinska A, Jankowski P (2012) Impact of proximity-adjusted preferences on rank-order stability in geographical multicriteria decision analysis. J Geogr Syst 14(2):167–187
Lim C, Yu B (2016) Estimation stability with cross-validation (ESCV). J Comput Gr Stat 25(2):464–492 Lin CC, Lin CL, Shyu JZ, Lin CT (2012) The ANFIS system for nonlinear combined fore-casts in the
telecommunications industry. Intern J Comput Appl 37(12):30–35
Lombardo L, Cama M, Conoscenti C, Ma¨rker M, Rotigliano E (2015) Binary logistic regression versus stochastic gradient boosted decision trees in assessing landslide susceptibility for multiple-occurring landslide events: application to the 2009 storm event in Messina (Sicily, southern Italy). Nat Hazards 79(3):1621–1648
MWREP: Ministry of water resource for East Azerbaijan Province (2014) Ground water depth assessment in Marand County. National project
Naderloo L, Javadikia H, Mostafaei M (2017) Modeling the energy ratio and productivity of biodiesel with different reactor dimensions and ultrasonic power using ANFIS. Renew Sustain Energy Rev 70:56–64 Navas JM, Telfer TC, Ross LG (2012) Separability indexes and accuracy of neuro-fuzzy classification in geographic information systems for assessment of coastal environmental vulnerability. Ecol Inform 12:43–49
Nefeslioglu HA, Sezer EA, Gokceoglu C, Ayas Z (2013) A modified analytical hierarchy process (M-AHP) approach for decision support systems in natural hazard assessments. Comput Geosci 59:18 Oh HJ, Pradhan B (2011) Application of a neuro-fuzzy model to landslide-susceptibility mapping for
shallow landslides in a tropical hilly area. Comput Geosci 37(9):1264–1276
Pacheco J, Arzate J, Rojas E, Arroyo M, Yutsis V, Ochoa G (2006) Delimitation of ground failure zones due to land subsidence using gravity data and finite element modeling in the Quere´taro valley, Me´xico. Eng Geol 84(3):143–160
Pandey A, Sinha AK (2015) An empirical model of regional growth using adaptive neuro-fuzzy inference system. Intern J Comput Appl, 114(3)
Parish ES, Kodra E, Steinhaeuser K, Ganguly AR (2012) Estimating future global per capita water avail-ability based on changes in climate and population. Comput Geosci 42:79–86
Pirnazar M, Zand Karimi A, Feizizadeh B, Ostad-Ali-Askari K, Eslamian S, Hasheminasab H, Ghorban-zadeh O, Haeri Hamedani M (2017) Assessing flood hazard using GIS based multi-criteria decision making approach; study area: East Azerbaijan province (Kaleibar Chay basin). J Flood Eng 8(2):203–223
Polykretis C, Chalkias C, Ferentinou M (2017) Adaptive neuro-fuzzy inference system (ANFIS) modeling for landslide susceptibility assessment in a Mediterranean hilly area. Bull Eng Geol Environ.https:// doi.org/10.1007/s10064-017-1125-1
Pourghasemi HR, Pradhan B, Gokceoglu C, Moezzi KD (2012) Landslide susceptibility mapping using a spatial multi criteria evaluation model at Haraz Watershed, Iran. In: Terrigenous mass movements, Springer, Berlin, pp. 23–49
Pradhan B (2011) Use of GIS-based fuzzy logic relations and its cross application to produce landslide susceptibility maps in three test areas in Malaysia. Environ Earth Sci 63(2):329–349
Pradhan B, Lee S (2010) Delineation of landslide hazard areas on Penang Island, Malaysia, by using frequency ratio, logistic regression, and artificial neural network models. Environ Earth Sci 60(5):1037–1054
S¸alap-Ayc¸a S, Jankowski P (2016) Integrating local multi-criteria evaluation with spatially explicit uncertainty-sensitivity analysis. Spat Cognit Comput 16(2):106–132
Sengur A (2008) Wavelet transform and adaptive neuro-fuzzy inference system for color texture classifi-cation. Expert Syst Appl 34(3):2120–2128
Sezer EA, Pradhan B, Gokceoglu C (2011) Manifestation of an adaptive neuro-fuzzy model on landslide susceptibility mapping: Klang valley, Malaysia. Expert Syst Appl 38(7):8208–8219
Shabankareh M, Hezarkhani A (2016) Copper potential mapping in Kerman copper bearing belt by using ANFIS method and the input evidential layer analysis. Arab J Geosci 9(5):364
Shadman Roodposhti M, Aryal J, Shahabi H, Safarrad T (2016) Fuzzy Shannon entropy: a hybrid GIS-based landslide susceptibility mapping method. Entropy 18(10):343
Singh R, Umrao RK, Ahmad M, Ansari MK, Sharma LK, Singh TN (2017) Prediction of geomechanical parameters using soft computing and multiple regression approach. Measurement 99:108–119 Sun H, Grandstaff D, Shagam R (1999) Land subsidence due to groundwater withdrawal: potential damage
of subsidence and sea level rise in southern New Jersey, USA. Environ Geol 37(4):290–296 Swets JA (1988) Measuring the accuracy of diagnostic systems. Science 240(4857):1285–1293
Tahmasebi P, Hezarkhani A (2012) A hybrid neural networks-fuzzy logic-genetic algorithm for grade estimation. Comput Geosci 42:18–27
Takagi T, Sugeno M (1985) Fuzzy identification of systems and its applications to modeling and control. IEEE Trans Syst Man Cybern 1:116–132
Umar Z, Pradhan B, Ahmad A, Jebur MN, Tehrany MS (2014) Earthquake induced landslide susceptibility mapping using an integrated ensemble frequency ratio and logistic regression models in West Sumatera Province, Indonesia. CATENA 118:124–135
Va´clavı´k T, Meentemeyer RK (2009) Invasive species distribution modeling (iSDM): are absence data and dispersal constraints needed to predict actual distributions? Ecol Model 220(23):3248–3258 VaeziNejad SM, Tofigh MM, Marandi SM (2011) Zonation and prediction of land subsidence (case
study-Kerman, Iran). Intern J Geosci 2(02):102
Vahidnia MH, Alesheikh AA, Alimohammadi A, Hosseinali F (2010) A GIS-based neuro-fuzzy procedure for integrating knowledge and data in landslide susceptibility mapping. Comput Geosci 36(9):1101–1114
Wang FK, Chang KK, Tzeng CW (2011) Using adaptive network-based fuzzy inference system to forecast automobile sales. Expert Syst Appl 38(8):10587–10593
Wiens TS, Dale BC, Boyce MS, Kershaw GP (2008) Three way k-fold cross-validation of resource selection functions. Ecol Model 212(3–4):244–255
Fakhri M, Asghari Moghadam A, Najib M, Barzegar R (2015) Nitrate concentration in groundwater resources in Marand plain and the groundwater vulnerability assessment by AVI and GODS methods. In: Proceedings of national conference of Ecology, vol: 41, no. 1, Iran, pp. 49–66
Zhang N, Xiao C, Liu B, Liang X (2017) Groundwater depth predictions by GSM, RBF, and ANFIS models: a comparative assessment. Arab J Geosci 10(8):189
Affiliations
Omid Ghorbanzadeh1 •Hashem Rostamzadeh2•Thomas Blaschke1• Khalil Gholaminia3•Jagannath Aryal4,5
1
Department of Geoinformatics–Z_GIS, University of Salzburg, Salzburg, Austria
2 Department of Geography and Planning, University of Tabriz, Tabriz, Iran
3
Department of Remote Sensing and GIS, University of Tabriz, Tabriz, Iran
4 Visiting Academic, University of Salzburg, Salzburg, Austria
5