Hydrodynamic Interaction during Tug-Ship
Operations
by
Sembukutti Vidanelage Buddhika Nirman Jayarathne CEng, BSc, MRINA, MIEAust, MIMarEST, AFHEA
National Centre for Ports and Shipping Australian Maritime College
University of Tasmania
Submitted in fulfilment of the requirements for the Doctor of Philosophy University of Tasmania
i
ii
Declarations
Declaration of Originality and Authority of Access
This thesis contains no material which has been accepted for a degree or diploma by the University or any other institution, except by way of background information and duly acknowledged in the thesis, and to the best of my knowledge and belief no material previously published or written by another person except where due acknowledgement is made in the text of the thesis, nor does the thesis contain any material that infringes copyright.
This thesis may be made available for loan and limited copying and communication in accordance with the Copyright Act 1968.
iii Statement of Published Work Contained in Thesis
The publishers of the papers comprising Chapters 2, 3, 4 and 6 hold the copyright for that content, and access to the material should be sought from the respective journals and conference proceedings. The remaining non-published content of the thesis, which is Chapter 5, is submitted and under review, and may be made available for loan and limited copying and communication in accordance with the Copyright Act 1968.
Statement of Co-Authorship
The following people and institutions contributed to the publication of work undertaken as part of this thesis:
Sembukutti Vidanelage Buddhika Nirman Jayarathne (Candidate)
Prof Dev Ranmuthugala, University of Tasmania (Author 1)
Dr Zhi Quan Leong, University of Tasmania (Author 2)
Dr Jiangang Fei, University of Tasmania (Author 3)
iv Publication list and proportion of work details
Chapter 2 (Paper 1)
Accuracy of Potential Flow Methods to Solve Real-time Ship-Tug Interaction Effects within Ship Handling Simulators
Candidate was the primary author and with Author 1 contributed to the design of the analysis, its formalisation and development. Author 3 and Author 4 assisted with presentation.
[Candidate: 75%, Author 1: 15%, Author 3: 5%, Author 4: 5%]
Chapter 3 (Paper 2)
Numerical and Experimental Prediction of Hydrodynamic Interaction Effects Acting on Tugs during Ship Manoeuvres
Candidate was the primary author and with Author 1 and Author 2 contributed to the design of the analysis, its formalisation and development. Author 3 and Author 4 assisted with presentation. [Candidate: 70%, Author 1: 10%, Author 2: 10%, Author 3: 5%, Author 4: 5%]
Chapter 4 (Paper 3)
Non-Dimensionalisation of Lateral Distances Between Vessels of Dissimilar Sizes for Interaction Effect Studies
Candidate was the primary author and with Author 1 and Author 2 contributed to the design of the analysis, its formalisation and development. Author 4 assisted with presentation.
[Candidate: 75%, Author 1: 10%, Author 2: 10%, Author 3: 5%]
Chapter 5 (Paper 4)
Safe Tug Operations During Ship-Assist Manoeuvres
Candidate was the primary author and with Author 1 and Author 2 contributed to its formalisation, development and presentation.
[Candidate: 75%, Author 1: 15%, Author 2: 10%]
Chapter 6 – Part A (Paper 5)
Safe Operation of Tugs within Close Proximity to the Forward and Aft Regions of Larger Ships
Candidate was the primary author and with Author 1 and Author 2 contributed to its formalisation, development and presentation.
[Candidate: 80%, Author 1: 10%, Author 2: 10%]
Chapter 6 – Part B (Paper 6)
Hydrodynamic Interaction Effects on Tugs Operating within the Midship Region alongside Large Ships
Candidate was the primary author and with Author 1 and Author 2 contributed to its formalisation, development and presentation.
v
We the undersigned agree with the above stated “proportion of work undertaken” for each of the above published (or submitted) peer-reviewed manuscripts contributing to this thesis.
Signed:
Prof Dev Ranmuthugala Primary Supervisor
National Centre for Maritime Engineering and Hydrodynamics
Australian Maritime College University of Tasmania Date: 30/04/2018
vi
Acknowledgements
Firstly, I would like to express my sincere gratitude to my primary supervisor, Professor Dev Ranmuthugala for the continuous support he has provided me in researching and writing this thesis. His guidance has contributed to all aspects of this work from beginning to end. I could not have imagined having a better supervisor and mentor for my thesis.
Besides my primary supervisor, I would like to thank my co-supervisor, Doctor Zhi Quan Leong for his insightful comments, which motivated me to widen the scope of my thesis. I would also like to thank the rest of my co-supervisors; Doctor Jiangang Fei and Associate Professor Shuhong Chai for also encouraging me throughout this thesis.
Very special gratitude goes out to all my friends down at the AMC Research Hub who have created a very memorable environment for researching, writing and celebrating life.
Special thanks must go to Associate Professor Jonathan Binns for his support during the potential flow analysis and to my graduate research coordinator, Doctor Hossein Enshaei for his great support throughout this thesis. I would also like to thank Doctor Zhi Quan Leong, Mister Luciano Mason and Mister Geli Kourakis for their dedication and continual work on the High Performance Cluster (HPC), which helped me to simulate a large number of CFD cases during this study. In addition, I would like to acknowledge the support given by Associate Professor Gregor Macfarlane, Doctor Jonathan Duffy, Mister Tim Lilienthal, Mister Adam Rolls, Mister Liam Honeychurch and the Defence Science and Technology (DST) Group during the setup and execution of the experimental work.
vii
viii
Abstract
The hydrodynamic interaction between two vessels operating in close proximity can affect their safety and handling, especially if the vessels are significantly different in size, for example when a tug is assisting a large ship. During such operations, the drift-angle of the tug and lateral distance between the vessels are frequently varied to ensure accurate course keeping and safety. This can result in unsteady hydrodynamic interaction effects induced on the vessels, which in turn can adversely affect their ability to maintain course and safety, especially for the smaller tug. Hence, knowledge of the hydrodynamic loads acting on the tug under these conditions is of significant practical value to the tug operator in order to avoid collision, capsizing or being run over. However, there are limited comprehensive studies to date characterising the interaction behaviour on a tug manoeuvring in close proximity to a large ship.
This project investigates the hydrodynamic interaction behaviour acting on a tug during ship-assist manoeuvres in order to establish safe operational envelopes using full scale validated Computational Fluid Dynamics (CFD) simulations. The investigation included quantifying the interaction effects on the tug due to changes in the vessel speeds, the longitudinal and lateral location relative to the ship, the drift-angle of the tug, and the relative size between the vessels.
The CFD model was validated at model-scale using experiments performed in the model test basin at the Australian Maritime College (AMC), which were then extended to represent full-scale operations. Thus, the scaling effects and non-dimensionalisation approach used to characterise the hydrodynamic behaviour for vessels of different sizes, ratios, and separations were investigated and verified. Different numerical approaches (CFD and potential flow solvers), and simulation conditions and settings within the respective approaches were also examined. The findings were used to identify guiding principles to achieve accurate numerical simulation results for hydrodynamic interaction effects during tug-ship operations.
The operational implications on a tug during ship-assist manoeuvres are discussed based on the hydrodynamic interaction data obtained through the CFD simulations. The hydrodynamic interaction data is consolidated into Hydrodynamic Interaction Region Plots (HIRP), which are non-dimensionalised based on the size and speed of the vessels and can thus be used by tug operators to determine the actual interaction forces and moments on a tug for different drift angles and locations relative to the ship for a given forward speed. This enables tug operators to determine the safe operational envelopes specific to the vessels in question and their prevailing conditions.
ix
x
Table of Contents
List of Figures………. xiii
List of Tables……….. xix
Nomenclature……….. xx
Abbreviations……… xxii
Chapter 1: Thesis Introduction………. 1
1.1 Introduction……… 2
1.2 Research Objective……… 8
1.3 Research Methodology……….. 9
1.4 Geometries and Scales……… 11
1.5 Limitations of the Investigation……… 13
1.6 Novel Aspects……… 13
1.7 Thesis Outline……… 15
Chapter 2: Accuracy of Potential Flow Methods to Predict Hydrodynamic Interaction... 19
Abstract……… 20
2.1 Introduction……… 21
2.2 Numerical Analysis………. 24
2.2.1 Hull form and coordination system……… 24
2.2.2 Domain and mesh in FS-Flow®……….. 25
2.2.3 Setup and mesh in StarCCM+®……….. 26
2.3 Experimental Setup……… 28
2.4 Results and Discussion……… 29
2.4.1 Drag coefficient and Friction coefficient……… 29
2.4.1.1 Dry transom with a model draft of 0.17 m……… 29
2.4.1.2 Wet transom with a model draft of 0.18 m………. 31
2.4.2 Wave pattern and pressure contour………. 32
2.4.3 Results without transom mesh………. 34
2.5 Conclusion……… 35
Chapter 3: Modelling Techniques and the Accuracy of RANS based CFD Simulations for Hydrodynamic Interaction Prediction……… 37
Abstract……… 38
3.1 Introduction……… 39
3.2 Numerical Simulations………...…… 41
3.2.1 Selection of Ship Models……… 41
3.2.2 Non-Dimensionalisation of Results……… 43
3.2.3 Numerical Setup……….. 44
xi
3.3.1 Mesh Sensitivity Study……… 46
3.3.2 y+ and the Turbulence Model Study……….. 48
3.4 Validation Study……….. 52
3.4.1 Numerical (CFD) Simulations……….. 53
3.4.2 Experimental Investigation……….. 54
3.5 Discussion………. 55
3.5.1 Parallel Operation - Drift Angle of 0 degrees (Groups 1 and 2)………. 56
3.5.2 Drift Angle of 8.4 degrees (Groups 3 and 4)………. 59
3.5.3 Drift Angle of 16.8 degrees (Groups 5 and 6)………. 62
3.6 Conclusion……… 64
Chapter 4: Effects of Lateral Separation and Relative Size of Vessels on Hydrodynamic Interaction………. 67
Abstract……… 68
4.1 Introduction……… 69
4.2 Case Study……… 72
4.3 CFD Setup………. 77
4.4 EFD Setup………. 78
4.5 CFD Verification and Validation……… 79
4.5.1 Mesh Sensitivity Study……… 79
4.5.2 CFD Validation against EFD Measurements………. 81
4.6 Results Discussion……….. 82
4.6.1 Comparison of Methods Used to Calculate Lateral Distances………. 83
4.6.2 Pressure Plot Visualisation……… 85
4.6.2.1 Absolute lateral distance for scaling………. 85
4.6.2.2 Non-dimensionalised lateral distances for scaling……….. 87
4.7 Conclusion……… 88
Chapter 5: Safe Tug Operations During Ship-Assist Manoeuvres………. 91
Abstract……… 92
5.1 Introduction……… 93
5.2 Case Study……… 95
5.3 CFD Simulation……….……… 96
5.4 Experimental Setup……….. 98
5.5 CFD Verification and Validation……… 99
5.6 Discussion………. 101
5.6.1 Interaction effects at a tug drift angle between 0 to 45 degrees….………. 101
5.6.2 Interaction effects at a tug drift angle between 60 to 90 degrees……….. 104
5.6.3 Effect of the Froude number on interaction effects……….. 107
5.6.4 Effect of the lateral separation on interaction effects………. 107
5.7 Safe Tug Operations………. 111
5.7.1 Safe tug operational envelope……….. 111
xii
5.8 Conclusion……… 115
Chapter 6: Hydrodynamic Interaction Region Plots (HIRPs)……… 117
Chapter 6A: Hydrodynamic Interaction Effects on Tugs Operating within the Midship Region alongside Large Ships……… 118
Abstract……… 119
6A.1 Introduction……… 120
6A.2 Numerical Study……….. 121
6A.3 Experimental Study……… 123
6A.4 CFD Verification and Validation………. 124
6A.5 Case Study……… 125
6A.6 Results………. 127
6A.6.1 Comparison of the effects of different lateral distances……….... 127
6A.6.2 Comparison of pressure plots………. 129
6A.6.3 Hydrodynamic Interaction Region Plots (HIRPs)……… 130
6A.7 Conclusion……… 133
Chapter 6B: Safe Operation of Tugs within Close Proximity to the Forward and Aft Regions of Large Ships..……… 134
Abstract……… 135
6B.1 Introduction……… 136
6B.2 Case Study……… 137
6B.3 HIRP Results………. 141
6B.4 Flow Visualisation……… 144
6B.5 Conclusion……… 146
Chapter 7: Summary, conclusion and recommendations for future work………. 147
7.1 Summary……….. 148
7.2 Conclusions………. 149
7.2.1 Hydrodynamic interaction effects induced on tugs……… 149
7.2.2 Simulation and experimental programmes………. 151
7.3 Implications and Contribution to the Research Area………... 152
7.4 Further Work………. 154
References……….. 155
Appendix I - The experimental and numerical uncertainty analysis……….. 162
Appendix II - Information and transport equations for the RANS modelling and turbulence models used in this study……… 173
Appendix III - The details of hull models used in this study……… 179
xiii
List of Figures
Figure 1.1: A tug operating near the bow of a car carrier during a ship-assist manoeuvre (Hensen et al., 2013).
……….... 2
Figure 1.2: Overview of model topology utilised by Geerts et al., (2011) in the towing tank to investigate interaction forces and moments acting on a tug sailing freely in the vicinity of the bow of a large container ship. ……….... 5
Figure 1.3: Escort tug Foss America escorting a ship: Picture taken by Robert Allan Ltd. (Brendan, 2009). ……….... 6
Figure 1.4: The experimental setup of Simonsen et al. (2011) to study quasi-steady ship-ship interaction effects. The tug is located midship of the larger ship, with a drift angle of zero degrees. ……….... 7
Figure 1.5: Local (tug), and global coordinate systems, and vessel locations. ……….... 12
Figure 1.6: 3D hull forms: (a) MARAD-F series tanker, (b) stern drive tug. ……….... 12
Figure 1.7: Flow field around a large ship affecting a tug operating in close proximity (Hensen, 2003). (+) indicates positive pressure and (-) indicates negative pressure. ……….... 14
Figure 2.1: Tug operating parallel to the flow (top) and operating at a drift angle (bottom). ……….... 23
Figure 2.2: Coordinates system and Ship Model with Free surface in FS-Flow®. ……….... 25
Figure 2.3: Absolute % difference of Drag Coefficient against finest panel mesh for the FS-Flow® model. ……….... 26
Figure 2.4: CFD grid independent study: Absolute % difference of Drag Coefficient against finest mesh. ……….... 27
Figure 2.5: CFD near wall mesh (y+) study: % difference of Drag Coefficient against y+~1 mesh. ……….... 27
Figure 2.6: Hexahedral 3.5 million cells mesh used in Star-CCM+®. ……….... 28
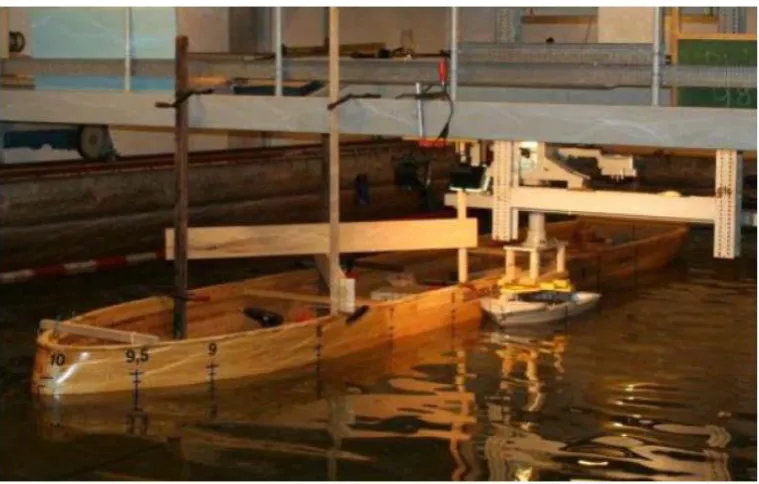
Figure 2.7: Experimental testing in AMC Towing Tank; Stern view (Left), Bow view (Right). ……….... 28
Figure 2.8: CT comparison for dry transom condition. ……….... 30
Figure 2.9: CF comparison for dry transom condition. ……….... 30
xiv uncertainty estimated using ITTC 2002 guidelines.
Figure 2.11: CF comparison for Wet Transom condition. ……….... 31 Figure 2.12: Free surface waves heights in PF, CFD and EFD. ……….... 32 Figure 2.13: a) Dynamic Pressure Coefficient and b) Velocity
contour generated by PF.
……….... 33
Figure 2.14: PF hull with (Left) and without (Right) transom mesh. ……….... 33 Figure 2.15: Comparison for wet transom condition, including the
PF mesh without the transom mesh.
……….... 34
Figure 2.16: Ship Handling Operation: Panel generation in PF. ……….... 34 Figure 3.1: Local (tug) and global coordinate systems and vessel
locations.
……….... 42
Figure 3.2: 3D hull forms: (a) MARAD-F series tanker, (b) stern drive tug.
……….... 43
Figure 3.3: Computational domain used in StarCCM+® simulations. ……….... 45 Figure 3.4: Percentage (%) difference from the finest 13.5 million
elements mesh for the predicted forces and moment, with varying mesh element size.
……….... 47
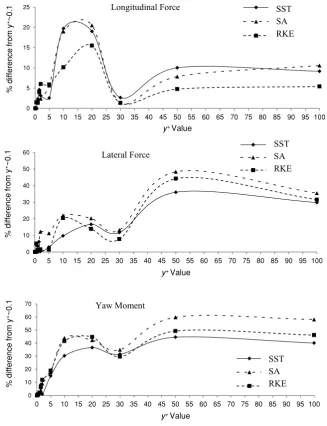
Figure 3.5: Selected 8.94 million element mesh grid. ……….... 47 Figure 3.6: Percentage (%) difference from the simulation using
the smallest y+ value (0.1) for the predicted longitudinal and lateral forces, and yaw moment, with varying y+ values for parallel tug and tanker operation for the three different turbulence models.
……….... 49
Figure 3.7: Percentage (%) difference from the simulation using the smallest (0.1) y+ value for the predicted longitudinal and lateral forces, and yaw moment, with varying y+ value for 300 drifted tug and tanker operation for the three different turbulence models.
……….... 51
Figure 3.8: (a) Experimental setup for interaction between vessels in AMC’s Model Test Basin (b) Turbulence simulators used on the models: left image wire on tanker model and right image studs on tug model.
……….... 54
Figure 3.9: (a) Schematic of the experimental setup in AMC’s Model Test Basin. (b) Load cells attached on the tug. Additional pictures and sketches of the model carriage are given in Appendix IV.
xv
Figure 3.10: CFD and experimental comparison of longitudinal and lateral forces, and yaw moment coefficients acting on the tug when parallel to the tanker and moving forward at a common speed of 0.41 m/s (Group 1).
……….... 57
Figure 3.11: Experimental and CFD free surface at a common forward speed of 0.41 m/s at x = 1.2, y = 1.09,
anddegree. Free surface legend is in meters.
……….... 58
Figure 3.12: CFD and experimental comparison of longitudinal and lateral forces, and yaw moment coefficients acting on the tug when parallel to the tanker and moving forward at a common speed of 0.62 m/s (Group 2).
……….... 58
Figure 3.13: CFD and experimental comparison of longitudinal and lateral forces, and yaw moment coefficients acting on the tug when drifted 8.4 degrees to the tanker and moving forward at a common speed of 0.41 m/s (Group 3).
……….... 60
Figure 3.14: CFD and experimental comparison of longitudinal and lateral forces, and yaw moment coefficients acting on the tug when drifted 8.4 degrees to the tanker and moving forward at a common speed of 0.62 m/s (Group 4).
……….... 61
Figure 3.15: Percentage (%) difference between the CFD simulations and Experimental investigation results for tug with 8.4 degrees drift angle at 0.41 m/s and 0.62 m/s speeds.
……….... 62
Figure 3.16: Experimental and CFD free surface at a common forward speed of 0.41 m/s at x = 1.0, y = 1.01, and
degrees. Free surface legend is in meters.
……….... 62
Figure 3.17: CFD and experimental comparison of longitudinal and lateral forces, and yaw moment coefficients acting on the tug when drifted at 16.8degrees to the tanker and moving forward at common speeds of 0.41 m/s and 0.62 m/s, lateral separation y of 1.09, and varying longitudinal separations x (Groups 5 and 6).
……….... 63
Figure 4.1: Different Ship Breadth Ratios (BR) investigated within the study showing the distance between ships’ centrelines (δycl) and the distance between ships’ midship (δym). Not to scale.
……….... 73
Figure 4.2: Local (tug) and global coordinate systems and vessel locations.
……….... 74
Figure 4.3: Schematic of the experimental setup. ……….... 75 Figure 4.4: Computational domain used in StarCCM+® simulations. ……….... 77 Figure 4.5: Experimental setup to measure the interaction effects
between vessels in AMC’s Model Test Basin.
xvi Figure 4.6: Selected mesh models a) Full Scale BR = 1.14, b) Full Scale BR = 2.22, c) Full Scale BR = 3.17.
……….... 81
Figure 4.7: Interaction effect coefficients obtained through model scale EFD, model scale CFD and full scale CFD for the tug for BR = 1.14, a) = 2.190 and b) = 2.276. Error bars represent
the respective CFD and EFD uncertainties.
……….... 82
Figure 4.8: Surge force, sway force, and yaw moment coefficients of the tug determined for different , and for
three full scale breadth ratios; BR = 1.14, 2.22, 3.17.
……….... 84
Figure 4.9: Pressure distribution plots on the transverse sections along the length of the tug at 3 m, 10 m, 15 m, 20 m, and 30 m aft of the tug’s bow for BR = 1.14, BR = 2.22, and BR = 3.17 when the lateral distance between vessel’ hulls was maintained at = 0.913 m. Unit for pressure is ‘pa’.
……….... 85
Figure 4.10: Pressure distribution plots on the tug for BR = 1.14, BR
= 2.22, and BR = 3.17 for non-dimensionalised lateral distances of = 2.190and = 2.499. Unit for pressure is ‘pa’.
……….... 88
Figure 5.1: Computational domain used in CFD simulations showing coordinate systems, boundaries and relative distances. Top – side view showing tanker. Bottom – plan view showing local (tug) coordinate system and global coordinate system with vessel locations.
……….... 97
Figure 5.2: Left: Schematic of the experimental setup in AMC’s Model Test Basin. Right: Experimental setup in AMC’s Model Test Basin.
……….... 98
Figure 5.3: Selected Full-Scale Mesh – 14.6 Million Cells. ……….... 100 Figure 5.4: CFD predicted forces and moment coefficients for a tug
operating at the non-dimensionalised lateral separations (y) of 0.50 and 1.00 from the tanker, at tug drift angles () of 0, 15, 30 and, 45 degrees, in comparison to an open-water tug.
……….... 102
Figure 5.5: CFD pressure plots for the tug operating at the non-dimensionalised lateral separation (y) of 0.50 and 1.00 from the tanker, at tug drift angles () of zero degrees.
……….... 103
Figure 5.6: CFD predicted forces and moment coefficients for a tug operating at the non-dimensionalised lateral separation (y) of 0.50 and 1.00 from a tanker, at tug drift angles () of 60, 75, and 90 degrees in comparison to an open water tug.
……….... 105
Figure 5.7: CFD predicted forces and moment coefficients for the interacting tug operating at Froude numbers (Fr) 0.092 and 0.185
xvii
at tug drift angles () of 0, 15, and, 30 degrees. Non-dimensionalised lateral separation from the tanker isy = 0.03. Figure 5.8: Interaction effect coefficients for a tug operating at y = 0.03 to 2.00 non-dimensionalised lateral separations with a tanker at zero to 90 degrees drift angles () at x = -0.10 non-dimensionalised longitudinal location along the tanker.
……….... 108
Figure 5.9: Interaction effect coefficients for a tug operating at y = 0.03 to 2.00 non-dimensionalised lateral separations with a tanker at zero to 90 degrees drift angles () at x = -0.50 non-dimensionalised longitudinal location along the tanker.
……….... 109
Figure 5.10: Interaction effect coefficients for a tug operating at y = 0.03 to 2.00 non-dimensionalised lateral separations with a tanker at zero to 90 degrees drift angles () at x = -0.75 non-dimensionalised longitudinal location along the tanker.
……….... 110
Figure 5.11: CFD Pressure Plots for the tug operating at y = 0.03, 1.00, and 2.00 non-dimensionalised lateral separations with drift angles of zero and 90 degrees at the midship and forward regions of the tanker respectively.
……….... 110
Figure 5.12: Regions around a ship showing the interaction effects induced on a tug operating in close proximity during ship-assist manoeuvres.
……….... 111
Figure 5.13: Interaction scale used to represent the interaction forces and moment coefficients and their magnitudes (see Figure 5.14).
……….... 112
Figure 5.14: Safest path for tugs to approach larger ships, including the magnitudes of the interaction effects at each location. Tug approaching the larger ship’s: (a) forward region; (b) midship region; and (c) aft region. The figure is to scale.
……….... 113
Figure 6A.1. Global and Local (tug) coordinate systems and vessel locations.
……….... 122
Figure 6A.2: Computational domain. ……….... 123 Figure 6A.3: Experimental setup for interaction between vessels in
AMC’s Model Test Basin.
……….... 124
Figure 6A.4: Selected Full-Scale Mesh – 14.6 Million Cells ……….... 125 Figure 6A.5: Longitudinal force, lateral force and yaw moment
coefficients on a tug operational near a tanker at 3 knot speed with different drift angles at different non-dimensionalised lateral distances (Δy).
xviii
Figure 6A.6: Pressure plots around the vessels at 6 knots (Fr = 0.18) speed with different drift angle from zero to 90 degrees atthe non-dimensionalised lateral distance, y, of 0.03.
……….... 130
Figure 6A.7: Hydrodynamic Interaction Region Plots (HIRP) to identify the safe paths for a tug to approach the midship region of a larger vessel. a) Magnitude of the longitudinal force coefficient; b) Magnitude of the lateral force coefficient: c) Magnitude of the yaw moment coefficient.
……….... 131
Figure 6A.8: Pressure plots around the open-water and interacting tugs at the drift angles of 60 and 75 degrees at the non-dimensionalised lateral distance, y, of 0.03. x is the non-dimensionalised longitudinal distance.
……….... 132
Figure 6B.1: 3D Hull forms: (Left) MARAD-F Series Tanker (Right) Typical stern drive Tug. [Not to scale]
……….... 137
Figure 6B.2: Local (tug) and global coordinates systems, and vessel locations. [Not to scale]
……….... 138
Figure 6B.3: Experimental setup to measure the interaction effects between vessels in AMC’s Model Test Basin
……….... 139
Figure 6B.4: The final full scale 14.6 million CFD mesh model of the tug and ship.
……….... 139
Figure 6B.5: Computational domain used in StarCCM+® simulations.
……….... 141
Figure 6B.6: Hydrodynamic Interaction Region Plots (HIRP) showing the forces and moments on the open-water tug, and on an interacting tug operating at the aft and forward regions of the tanker. a) Magnitude of the longitudinal force coefficient; b) Magnitude of the lateral force coefficient; c) Magnitude of the yaw moment coefficient.
……….... 142
Figure 6B.7: Pressure plots around the open-water and interacting tugs at the drift angles of 60 and 75 degrees at the non-dimensionalised lateral distance, y, of 0.03. x is the non-dimensionalised longitudinal distance.
……….... 144
Figure 6B.8: CFD hull pressure contours for a tug at a drift angle () of 45 in the aft region and 60 degrees in the forward region of the tanker. x and y are the non-dimensionalised longitudinal and lateral separations respectively.
xix
List of Tables
Table 2.1: Main Particulars of the Hull Form. ……….... 24
Table 3.1: Principal dimensions of the selected hull forms. ……….... 42
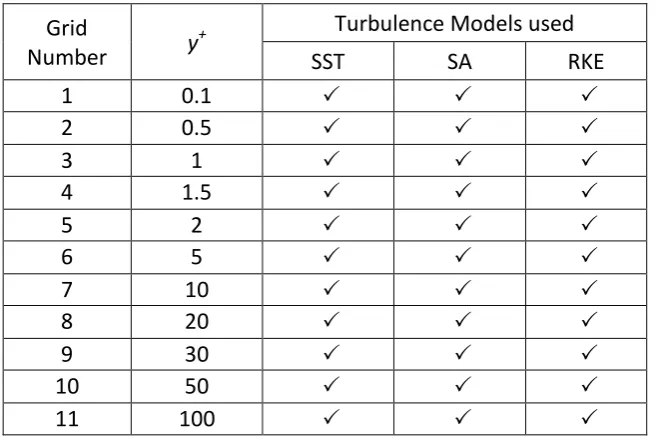
Table 3.2: The y+ and turbulence model combinations tested for parallel and 300 drifted tug operation simulations. ……….... 48
Table 3.3: Cases investigated for the CFD and experimental comparison study. ……….... 53
Table 3.4: Speed regimes tested during validation study. ……….... 55
Table 3.5: Results analysis groups. ……….... 56
Table 4.1: Principal particulars of the selected hull forms. ……….... 74
Table 4.2: Lateral distances between vessel centrelines ). ……….... 76
Table 4.3: Mesh resolution of the simulations used for the sensitivity study (M – Millions). ……….... 80
Table 4.4: Relative error percentage estimates of the surge and sway forces and the yaw moment with respect to the Richardson extrapolated values. ……….... 81
Table 5.1: Principal particulars of the selected full scale tug and tanker hull forms ……….... 95
Table 5.2: Parameter range for the cases investigated in this study ……….... 96
Table 5.3: Mesh resolution of the simulations used for the sensitivity study (M – Millions) ……….... 99
Table 5.4: Relative error percentage estimates of the longitudinal and lateral forces and the yaw moment with respect to the Richardson extrapolated values ……….... 100
Table 6A.1: Principal dimensions of the selected hull forms. ……….... 122
Table 6A.2: Mesh resolution of the simulations used for the sensitivity study (M – Millions). ……….... 125
Table 6A.3: Cases investigated in the study. ……….... 126
xx
Nomenclature
BR Breadth Ratio, ⁄
Bs Breadth of the tanker ship (m)
Bt Breadth of the tug (m)
CF Frictional resistance coefficient
CN Yaw moment coefficient
CP Dynamic pressure coefficient, ) CT Drag coefficient
CX Longitudinal force coefficient
CY Lateral force coefficient
D Depth of the water (m)
DR Displacement Ratio, ⁄
FrD Froude Number (Depth), √
Frs Froude Number (Tanker ship Length), √ Frt Froude Number (Tug Length), √
g Acceleration due to gravity (9.81 m s-2)
Lm Length waterline of the model scale tanker ship (m)
LOA Length overall of the vessels (m)
Ls Length waterline of the tanker ship (m)
Lt Length waterline of the tug (m)
N Yaw moment acting on tug (N m)
NI Yaw moment acting on the interacting tug, chapter 5 (N m)
No Yaw moment acting on the open water tug, chapter 5 (N m)
P Pressure (pa)
Free-stream reference pressure (pa)
q Dynamic pressure (pa),
Re Reynolds number,
RF Frictional resistance on ship model in chapter 1 (N)
xxi
Ss Wetted surface area of the tanker ship (m2)
St Wetted surface area of the tug (m2)
T Draft of the vessels (m)
u Fluid flow velocity (m s-1)
V Velocity of ship models in chapter 1 (m s-1)
X Longitudinal force acting on tug (N)
XI Longitudinal force acting on the interacting tug, chapter 5 (N)
Xo Longitudinal force acting on the open water tug, chapter 5 (N)
Y Lateral force acting on tug (N)
YI Lateral force acting on the interacting tug, chapter 5 (N)
Yo Lateral force acting on the open water tug, chapter 5 (N)
y+ Non-dimensional wall distance of first inflation layer
x Non-dimensionalised longitudinal-distance between vessels
x Longitudinal distance between vessels (m)
y Non-dimensionalised lateral distance between vessels
yship Non-dimensionalised lateral distance between vessels calculated as a ratio of
the tanker breadth in chapter 4
ytug Non-dimensionalised lateral distance between vessels calculated as a ratio of
the tug breadth in chapter 4
y Lateral distance between vessels (m)
ycl Lateral distance between the centrelines of the vessels in chapter 4 (m) ym Lateral distance between the midships of the vessels in chapter 4 (m)
Change in the results between the fine and medium mesh
Change in the results between the medium and coarse mesh
Density of water (kg m-3)
Drift angle of the tug (Degrees)
Fluig Kinematic viscosity (kg m-1 s-1)
xxii
Abbreviations
AMC Australian Maritime College CFD Computational Fluid Dynamics DNV Det Norske Veritas
DT Dry Transom
EFD Experimental Fluid Dynamics GL Germanischer Lloyds
HIRP Hydrodynamic Interaction Region Plot ITTC International Towing Tank Conference LVDT Linear Voltage Displacement Transducer MAIB Marine Accident Investigation Branch MARAD Maritime Administration, USA
MARIN Maritime Research Institute Netherland MCA Maritime Coastguard Agency, United Kingdom PF Potential Flow
RANS Reynolds Averaged Navier-Stokes
RKE Realizable Two Layer k- turbulence model SA Spalart-Allmaras turbulence model
SST Shear Stress Transport turbulence model
xxiii
1
Chapter 1
Thesis Introduction
Chapter 1
2
1.1
Introduction
[image:26.595.104.494.427.688.2]Tug assistance is particularly significant when ships with limited manoeuvring capabilities are handled in restricted waters. In such manoeuvres, tugs are either used during the transit of larger ships to or from a berth, or during their mooring and unmooring operations (Hensen, 2003). Due to growing marine traffic in restricted waterways and harbour waters, tugs are exposed to dangers such as collision, grounding, girting, and being run-over by larger ships (Hensen et al., 2013). In addition, hydrodynamic interaction between the vessels can adversely affect the handling and safety of attending tugs. Interaction forces change with vessel type, width of fairway, and drift angle between them (Hensen, 2012). These forces and their effects become prominent when the vessels are significantly dissimilar in size and are operating in close proximity during tight manoeuvres similar to that shown in Figure 1.1. Although experienced tug operators may know that interaction forces differ between types of vessels, the safety envelop for each of these cases is much harder to determine.
Chapter 1
3
“Dangers of interaction” is a guidance note prepared by the Maritime and Coastguard Agency of the United Kingdom (MCA, 2001) to draw the attention of ship owners, ship operators, pilots, and tug operators to the effects of hydrodynamic interaction on vessel manoeuvrability. It states that when vessels manoeuvre at close quarters for operational reasons, the greatest potential danger exists when there is a large difference in size between the two vessels, and is mostly experienced when a ship is being attended by a tug. The Marine Accident Investigation Branch (MAIB, 2011) report strongly suggests mariners familiarise themselves with the “Dangers of Interaction” guidelines in order to become aware of potentially dangerous situations caused by hydrodynamic interaction effects. Hensen et al., (2013) surveyed 160 pilots, tug masters and ship captains about their awareness of interaction effects during these manoeuvres, and the accuracy of ship manoeuvring simulators replicating these effects. Around 30% of the tug masters questioned had faced critical situations due to interaction effects during ship-assist manoeuvres and 40% emphasised the dissimilarity between interaction effects in training simulators and in real manoeuvres. Just as it is important to have simulator training for those who operate ships in critical manoeuvres, it is essential that the interaction effects are accurately determined by simulator algorithms. Ship handling simulators use interaction effect prediction algorithms developed using data collected via either experimental, theoretical, or computational based methods.
Chapter 1
4
Dand (1975, 1978, and 1995) carried out captive model experiments to determine the physical causes of interaction and their effects on tugs during ship-assist manoeuvres. The findings of these studies are still used for tug-ship interaction prediction, when both ship and tug are advancing on parallel courses in close proximity to each other. However, his conclusion was formed by results obtained from one of a number of manoeuvres encountered by a tug during ship-assist manoeuvres, and thus it is difficult to generalise it to tugs operating at different drift angles and in different locations. Vantorre et al., (2002) conducted physical model-scaled tests to determine ship interaction effects in head-on and overtaking encounters for similar and dissimilar size vessels. The test results generated were used to create a mathematical model to improve the quality of the interaction effects predicted within ship manoeuvring simulators. They identified a need for further experiments to simulate the interaction effects when ships of different sizes and types operate in close proximity.
Chapter 1
5
Figure 1.2: Overview of model topology utilised by Geerts et al., (2011) in the towing tank to investigate interaction forces and moments acting on a tug sailing freely in the vicinity of the
bow of a large container ship.
A number of researchers have investigated the capabilities of theoretical methods to predict interaction effects, thus reducing the need for expensive experimental work. Tuck and Newman, (1974) performed the pioneering theoretical investigations into ship-to-ship interactions, with their results being fairly consistent with the experimental results presented by Newton, (1960). Yeung, (1978) also carried out a theoretical study using slender body theory on the hydrodynamic interaction between two bodies moving in shallow water, comparing the theoretical results for ship-tug interaction against Dand, (1975) experimental data. Yeung, (1978) noted that although the general behaviour of the experimental curves was predicted by the theoretical analysis, the peak force and moment values were significantly underestimated, particularly when the tug was in the stern region of the larger ship.
Kuniji et al., (1984) developed a mathematical model to predict manoeuvring motions of ships operating at low speeds in restricted waters. The model aimed to express the hydrodynamic forces on ships by combining the open water characteristics of the hull, propeller, and rudder. They suggested further attention was needed to determine the effectiveness of the mathematical model to solve the hydrodynamic interaction effects induced on ships due to assisting tugs, because most of the time ships that are manoeuvring
Chapter 1
6
at low speeds need tug assistance. Takashina, (1986) conducted a similar study to develop a mathematical model to predict the manoeuvring motion of ships during tug assist operations. The results of that mathematical model were then compared against free running model test data for typical ship and tug manoeuvres and were found to provide satisfactory agreement. This study however did not discuss the hydrodynamic effects induced on the tug by the larger ship.
[image:30.595.126.473.471.686.2]In addition to this kind of theoretical work, researchers have conducted numerical simulations to determine interaction effects between vessels operating in close proximity. A comparative Computational Fluid Dynamics (CFD) study of the interaction between a tug and a large tanker sailing in parallel courses at low speeds was undertaken by Fonfach et al., (2011). They analysed the interaction effects acting on a tug using inviscid flow, turbulent viscous flow, inviscid free surface flow, and viscous free surface flow theories using CFD. According to their findings, CFD with viscous and free surface effects showed better agreement with the experimental data than the other numerical models. However, their study was limited to only a tug operating parallel to a larger ship and located at a few locations relative to the latter.
Chapter 1
7
Brendan, (2009) carried out a CFD-based study to predict the performance of an escort tug (see Figure 1.3). This study solely focused on the drag force acting on a tug when operating freely with different drift angles in open water, without the presence of a large ship. Therefore, effects due to hydrodynamic interaction between the vessels were not included.
[image:31.595.110.490.421.663.2]Sorensen et al., (2009) revealed that when a tug is operating near a large ship, complex pressure conditions can significantly effect the reliability of training simulator predictions. Subsequently, they improved the mathematical model of tugs within their simulator using a complex ship-to-ship interaction module between the ship and the tug. Simonsen et al., (2011) conducted a numerical study on a subset of cases taken from physical model-scale tests conducted to study quasi-steady ship-to-ship interaction effects (Figure 1.4). In this study, the tug was located in the midship region of a tanker with the tug’s drift angle varying from 0 to 60 degrees, concluding that CFD is a promising tool for ship interaction studies. However, in actual operations the tug may experince drift angles greater than 60 degrees, and will operate at locations other than the midship.
Figure 1.4: The experimental set-up of Simonsen et al., (2011) to study quasi-steady ship-ship interaction effects. The tug is located midship-ship of the larger ship-ship, with a drift angle of
Chapter 1
8
Due to the high computational power and the meshing time required for CFD methods, relatively simple potential flow double body theory was identified by Pinkster and Bhawsinka, (2013); Sutulo and Soares, (2009) as the best method for online interaction effect predictions. Sutulo and Soares, (2009) and Sutulo et al., (2012) developed a potential flow double-body panel code to estimate interaction effects in real time on commonly used computer hardware. The results obtained with the code were validated against model-scale experimental data obtained in deep and shallow water towing tanks for a tug operating near a larger ship in parallel operations. The results illustrated the potential of the double-body panel method to predict interaction effects. However this method was unable to accurately predict the sway force at small horizontal clearance, which was expected to be more pronounced than predicted for non-parallel operations.
In summary, it is seen that existing numerical and experimental studies on interaction effects on tugs during ship-assist operations are rather limited in addressing the range of manoeuvres and situations encountered by tugs during such operations. This includes limited work in investigating the interaction effects on tugs operating in different locations relative to the ship and at different drift angles in order to gain a more generalised view of the interaction behaviour. In addition, the solution approaches available in the literature lack clear guidance on their applicability for such studies. This study therefore investigates the hydrodynamic interaction effects induced on tugs that are operating at various locations and angles during ship-assist manoeuvres, using CFD and Potential Flow (PF) methods that are validated through captive model experiments. The results are used to quantify the interaction effects on the tug’s operational envelope when operating around a larger ship during ship-assist manoeuvres.
1.2
Research Objective
Chapter 1
9
angles between the two vessels at two common speeds during ship-assist manoeuvres using numerical and experimental techniques.
The motivation behind this study is to quantify the hydrodynamic interaction that influences a tug’s ability to safely manoeuvre in close proximity to a ship, as well as identifying a safe operating envelop. Thus, the specific research question for this project is:
What are the adverse hydrodynamic interaction effects induced on a tug, and what is the
safe operating envelope to minimise these effects while manoeuvring in close proximity to a
larger ship?
To answer the above question, the project focuses on the following four outcomes:
1. A review of the literature on hydrodynamic interaction and its influence on the behaviour of multiple vessels operating in close proximity.
2. Development and validation of a numerical simulation model to capture the hydrodynamic characteristics of a tug operating in close proximity to a large ship. 3. Analysis of the hydrodynamic interaction behaviour on a tug operating at different
relative positions, drift angles and velocities alongside a larger ship, including the effects of the relative size between the two vessels.
4. Develop Hydrodynamic Interaction Region Plots (HIRPs) using the data obtained through full-scale simulations in order to quantify safe operating envelopes for tugs partaking in ship-assist manoeuvres.
1.3
Research Methodology
Chapter 1
10
Phase 1: Comparative numerical simulations to evaluate the capability of Potential Flow (PF) and Reynolds Averaged Navier Stokes (RANS) based CFD methods to predict the hydrodynamic interaction effects on a tug.
It is evident from the literature that PF solvers are used to simulate real-time interaction effects within ship handling simulators. However, a number of researchers (Doctors, 2006; Doctors & Beck, 2005; Falter, 2010; Fonfach et al., 2011; Lindberg et al., 2012; Mantzaris, 1998; Pinkster & Bhawsinka, 2013; Shin et al., 2008; Zhou et al., 2012) have questioned the accuracy of the PF methods that are currently used. Therefore, the first phase of this study was a comparative model-scale numerical simulation study employing the Rankine-source panel code-based software Futureship® (DNV GL Maritime, 2014) and the CFD software StarCCM+®(CD-Adapco, 2015) to identify their suitability for interaction effect studies.
Phase 2: Verification and Validation of the CFD model used to simulate hydrodynamic interaction induced on a tug by a larger ship during ship-assist manoeuvre.
Following the establishment of RANS-based CFD as the investigation tool for tugs with non-streamlined hull shapes, the CFD simulation models underwent a verification and validation process. One of the major challenges faced in CFD modelling is that the results can vary significantly depending on the computational grid and the numerical model settings. This phase therefore investigated modelling techniques and the accuracy of CFD generated interaction forces and moments acting on a tug hull operating at different drift angles and locations along a tanker hull. The CFD results were validated using the model-scale experimental results.
Phase 3: Extrapolate CFD model-scale results to full-scale.
Chapter 1
11
safe operating distances for different ship-to-tug ratios, using the non-dimensionalisation method presented.
Phase 4: Analysis of the hydrodynamic interaction effects on a tug at different relative positions and drift angles to the ship, including the influence of varying relative sizes between the two vessels.
This investigation provides the safe operating envelopes for tugs to reduce adverse hydrodynamic interaction effects induced by larger ships during ship-assist manoeuvers. The investigations were conducted using verified CFD simulation models. The location and the drift angle of the tug were changed along the longitudinal and transverse perimeter of a tanker to replicate widely used real world ship-assist scenarios. The simulations were performed at two Froude numbers that represent the most common minimum and maximum vessel operational speeds during such manoeuvres. The results of these simulations were used to develop a number of HIRPs that signify safe operating envelopes for tugs during ship-assist manoeuvers.
1.4
Geometries and scales
Chapter 1
[image:36.595.197.394.73.234.2]12
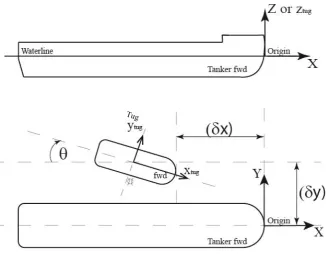
Figure 1.5: Local (tug) and global coordinate systems and vessel locations.
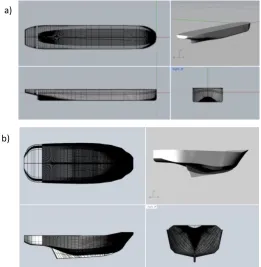
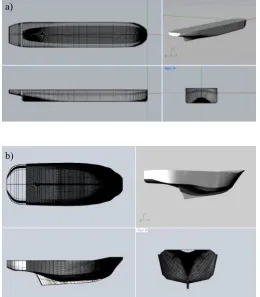
Figure 1.6: 3D hull forms: (a) MARAD-F series tanker, (b) stern drive tug.
The hydrodynamic forces and moments presented in this study are based on the local coordinate system of the vessels illustrated in Figure 1.5. The three dimensional model-scale hull form geometries were developed using the commercial software Rhinoceros® (Figure 1.6). The induced interaction forces and moments are investigated as a function of the relative position, drift angle, size, and speed of the two vessels in order to characterise the interaction behaviour. The dimensions of the vessels are given in the relevant chapters.
a)
[image:36.595.158.420.286.554.2]Chapter 1
13
1.5
Limitations of the investigation
The current study focuses only on the fixed configuration of the vessels, thus there is no relative motion between them. The rationale for utilising this method is that when a tug assists a larger ship, the tug uses a rope to connect with the large ship requiring both vessels to travel at approximately the same speed. In addition, during ship escort manoeuvres, tugs usually travel alongside the ship at the same speed (Hensen, 2003). The test speeds used to investigate the interaction behaviour on the tug correspond to two speeds, the minimum and maximum operating speeds (3 knots and 6 knots full-scale) commonly encountered during ship-assist manoeuvres (Hensen, 2003).
In the experimental and numerical investigations, the models had to remain fixed in all degrees of freedom. This allowed the hydrodynamic interaction between the bare hulls of the vessels to be the focal point of the study, thus enabling modifications to the unadulterated interaction effect module operational within ship handling simulators (Kongsberg Maritime, 2012; Pinkster & Bhawsinka, 2013). The results of this work can in future be compared against fully appended configurations of the two vessels in order to quantify the contribution of the appendages to the interaction behaviour.
1.6
Novel Aspects
There are four areas in which this project provides original contributions to the field.
Chapter 1
14
positioned at the midship region of a tanker. However, in real operations tugs may operate at larger drift angles and at different relative locations. The current study investigates full-scale hydrodynamic interaction predictions for a range of drift angles up to 90 degrees, with the tug operating at a number of locations along the length of the tanker and at five different lateral separations. The results enable the generation of comprehensive HIRPs for ship-assist scenarios that is a major contribution to such operations.
Figure 1.7: Flow field around a large ship affecting a tug operating in close proximity (Hensen, 2003). (+) indicates positive pressure and (-) indicates negative pressure.
Chapter 1
15
To date, most of the numerical and experimental hydrodynamic interaction studies on ship-assist manoeuvers have been carried out at model-scale. It is therefore difficult to establish how well these results represent full-scale interaction behaviour. This is further exacerbated by a lack of proven methodologies for non-dimensionalising the relative distances between the two vessels, affecting the comparison of model and full-scale interaction effect data, as well as that between vessels of dissimilar size ratios. This study investigates a suitable correlation technique to non-dimensionalise the lateral distance between vessels of dissimilar sizes, and a scaling option for interaction effect studies.
CFD simulations are increasingly being adopted as a tool to determine the interaction effects in ship-assist manoeuvres. However, most of the studies available in the public domain lack comprehensive verification and validation studies. This research investigates modelling techniques and the accuracy of CFD generated interaction forces and moments acting on a tug at different drift angles, as and at different lateral and longitudinal locations along a tanker. This includes a comprehensive verification and validation study, which includes numerical and experimental uncertainty analysis in accordance with proven standards and guidelines (ITTC, 2002a, 2002b; Roache, 1998; Stern et al., 2001; Wilson et al., 2001).
1.7
Thesis Outline
This thesis follows a “Chapterised Thesis” structure, where Chapters 2 to 6 comprise of separate scientific papers. The structure of the thesis is outlined below.
Chapter 1
16
Chapter 2: Examines the ability of PF solvers to predict interaction effects acting on an un-appended transom stern tug operating in close proximity to a tanker during ship-assist manoeuvres. The investigation had both vessels operating at the same speed in parallel courses. The validation process consisted of a comparison between the results from PF solvers, CFD simulations, and experimental measurements. When the flat transom of the tug was above the water level creating a dry transom flow, the PF solver showed very good agreement with experimental and CFD results. However, it failed to do so for wet transom conditions, especially at higher Froude numbers. This led to the selection of CFD simulations supplemented by experimental measurements for the remainder of the study.
Chapter 3: Investigates the accuracy of CFD predicted interaction forces and moments acting on a tug hull at different drift angles, and lateral and longitudinal locations relative to a tanker hull. Validation of the simulations was carried out against experimental measurements obtained in a model test basin. It showed that the quality of the mesh model, including those in the near wall region and in areas of separation; the simulation settings; and the turbulence model have a significant influence on the accuracy of the computational results.
Chapter 4: Explores a suitable correlation technique for non-dimensionalising the lateral distance between vessels of dissimilar sizes, as well as providing a scaling option for interaction effect studies. It focuses on the interaction effects on a tug operating around the forward shoulder of a tanker at different lateral distances during ship-assist operations. The findings enabled the interaction effects determined for one ship-to-tug ratio to be used to predict the safe operating distances for vessels of different ship-to-tug ratios.
ship-Chapter 1
17
assist manoeuvers. The midship region of a large ship was deemed the safest region, while the forward and aft regions were identified as the most critical regions for a tug to operate within.
Chapter 6: This chapter expands on the work presented in Chapter 5 conducting a comparative numerical and experimental study to investigate interaction effects on a tug operating within the midship, forward and aft regions of a large ship at varying drift angles and lateral separations. The non-dimensionalised interaction effects were used to create HIRPs to identify the variation of the coefficients with respect to the tug’s drift angle and its location relative to the ship. The HIRPs enable tug operators to identify safe operating envelopes for tugs to approach the midship, forward and aft regions of large vessel during tug assist manoeuvres.
Chapter 7: The concluding chapter provides an overall summary of the project, bringing together the findings of the individual chapters. It also provides final comments on the findings and outcomes, as well as discussing the implications of the findings and the respective contributions. It finally discusses limitations of the study and possible future work.
Appendices:
Appendix I Outlines the experimental and numerical uncertainty analysis.
Appendix II Provides information and transport equations for the RANS modelling and turbulence models used in this study.
Appendix III Provides the details of hull models used in this study.
18
19
Chapter 2
Accuracy of Potential Flow Methods to Solve Hydrodynamic Interaction
This chapter has been published in the International Journal on Marine Navigation and Safety of Sea Transportation. The citation for the research article is:
Jayarathne, N., Ranmuthugala, D., Chai, S. & Fei, G. (2014), 'Accuracy of Potential Flow Methods to Solve Real-time Ship-Tug Interaction Effects within Ship Handling Simulators',
International Journal on Marine Navigation and Safety of Sea Transportation, vol. 8, no. 4, pp.
Chapter 2
20 ABSTRACT
Chapter 2
21
2.1 Introduction
Tug boats play a significant role when ships incapable of slow manoeuvres are handled in restricted waters. Ships and their attending tugs are exposed to dangers such as collision, grounding, girting, and run-overs when operating in close proximity in restricted waterways. Furthermore, the hydrodynamic interaction forces and moments can adversely affect the handling and safety of the attending tugs. Hensen (2012) showed that the interaction effects change with ship type, width of fairway, and the drift angles of the vessels; which can cause even experienced tug masters difficulties with identifying safe operating envelopes for their tugs during such manoeuvres. In addition, Hensen (2012) stated that these effects become prominent when the vessels are significantly dissimilar in size and operated in close proximity during tight manoeuvres. Hensen et al. (2013) questioned 160 tug masters with regard to their awareness of the interaction effects during such manoeuvres. Around 30% of the tug masters had faced critical situations due to unexpected ship-to-ship interaction effects in actual ship-assist manoeuvres.
Ship handling simulators use empirical and semi-empirical methods, theoretical and numerical methods, or Potential Flow (PF) methods to predict interaction effects (Sutulo & Soares, 2009). With the exception of the PF method, the others require an interaction effect coefficients database to solve mathematical models implemented into the simulators, with the database developed and validated by empirical and numerical techniques. For example, Vantorre et al. (2002) conducted physical model tests to determine the ship interaction effects in head-on and overtaking encounters of similar and dissimilar ships. The test results were used to create a new mathematical model to improve the quality of the interaction effects within ship manoeuvring simulators.
Chapter 2
22
Pinkster and Bhawsinka (2013) developed a computer program to estimate and validate the interaction effects using the simulator operated by the Maritime Research Institute Netherlands (MARIN). The PF double-body method was employed within their computer program for multi-body cases involving ships and port structures. Real time interaction forces and moments were fed into the simulator using high speed computers to solve the flow equations. However, the final results were found to be highly sensitive to the initial conditions, which were tedious to set-up.
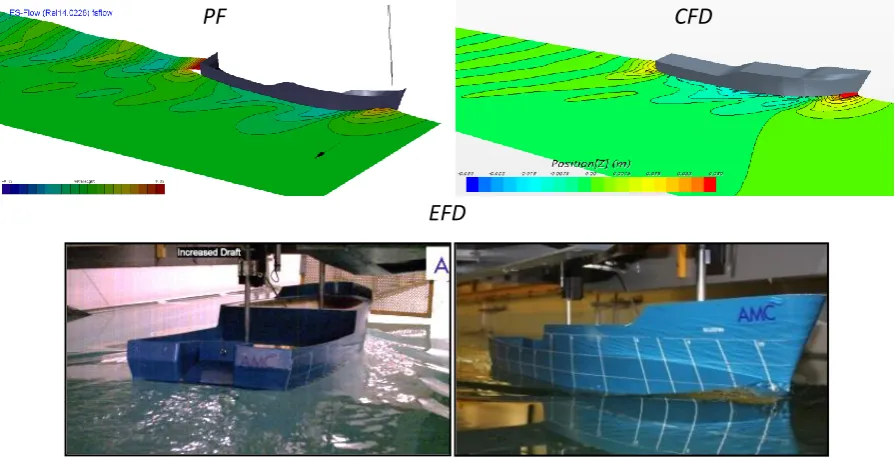
Sutulo et al. (2012) developed a PF double-body panel code on the basis of the classic Hess and Smith (Hess & Smith, 1964, 1967) method to estimate interaction effects in real time on commonly used computer hardware. The results obtained with the code were validated against experimental data obtained in deep and shallow water towing tanks for a tug operating near a larger vessel. The results illustrated the potential of the PF double-body panel method for predicting interaction effects, while highlighting the lack of accuracy in predicting the sway forces at small horizontal clearances. It was expected to be more pronounced in non-parallel operations, similar to those encountered during tugs assisting ships. Fonfach et al. (2011) did experimental and numerical investigations to explore the contribution of various factors to interaction effects, which were not accounted for by the PF method. They revealed substantial influence of free-surface effects on the accuracy of predicted interaction effects.
Chapter 2
23
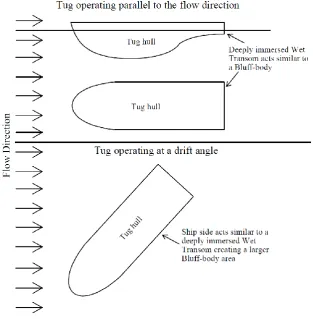
[image:47.595.158.472.250.570.2]Considering the interaction effects on a tug during ship-assist, the rapid changes of tug drift angle cause a large portion of the downstream wake due to the hull to be characterised by a bluff body flow in a similar manner to a wet transom flow, as shown in Figure 2.1. Thus, it is essential to select a flow solver that can accurately solve such conditions during real-time predictions. Therefore, this study aims to examine the accuracy of the drag force prediction by a PF solver in wet transom conditions, as a case study to investigate its suitability for use in complicated real-time interaction effects analysis of tugs operating at a drift angle.
Figure 2.1: Tug operating parallel to the flow (top) and operating at a drift angle (bottom).
Chapter 2
24
nonlinear free-surface. The PF approach assumes that the fluid is inviscid and the flow is irrotational around the bodies. Hence, FS-Flow® is equipped with a separate module capable of calculating the viscous resistance in terms of a friction line in combination with the wetted hull surface. Therefore, the dynamic forces, static forces, and viscous forces acting on the bodies are included in the final results, although the fluid is considered as inviscid within PF. The total resistance and its components obtained from the PF solver was then compared against captive model experiments and CFD results generated by the commercial CFD code StarCCM+® to investigate the possibility of using the PF software for future analysis of interaction effects.
2.2 Numerical Analysis
The set-up and relevant features of the two commercial software packages, FS-Flow® and StarCCM+®, are provided below.
2.2.1 Hull form and coordinate system
A 1:20 scaled hull model of the AMC’s 35 m training vessel MV Bluefin was utilised in this study. The particulars of the full and model-scale hulls are given in Table 2.1. The two test conditions analysed to investigate the effects of transom generated complex flow regimes were:
dry transom with a model draft of 0.17 m; and
wet transom with a model draft of 0.18 m.
Table 2.1: Main Particulars of the Hull Form.
Main Particulars Unit Full-scale Model-scale
Length Waterline m 32.150 1.608
Wetted Surface area m2 384.15 0.96
Dry Transom Draft m 3.48 0.17
Chapter 2
25
A three-dimensional model-scale hull form was developed using the commercial software Rhinoceros® 5.0V and imported into the two packages. The coordinate system for the analysis is shown in Figure 2.2. The flow velocity vector was in the positive X direction while the horizontal plane through the origin was considered as the free surface.
2.2.2 Domain and Mesh in FS-Flow®
Flow velocities ranged from 0.34 m/s to 1.04 m/s in model-scale, acting along the positive X direction, with the vessel allowed to trim and heave during the analysis. The free surface had a rectangular shape, with the inlet boundary at a distance equal to the scaled model waterline length (Lm) upstream of the origin, the outlet boundary at 3Lm downstream from
the origin, and a total domain width of 1.1Lm. The dimensions were selected to match those
of the AMC towing tank, except for the length, which was shorten to reduce the computational effort without adversely affecting wake resolution. The mesh configuration is illustrated in Figure 2.2, which was developed in FS-Flow®.
Figure 2.2: Coordinates system and Ship Model with Free surface in FS-Flow®.
The mesh independence study was conducted through mesh refinements without affecting the stability of the solver. The drag coefficient at a forward speed of 1.04 m/s was tested for dry transom condition for the models with different panel numbers to obtain an appropriate mesh. This approach provided sufficiently accurate results while maintaining low computational effort. The finest mesh investigated had 4220 panels; while a 3490 panel mesh was selected as a suitable mesh for steady-state simulations as its predictions were within 1.5% of that for the finest mesh (see Figure 2.3).
X Z
Chapter 2
26
Figure 2.3: Absolute % difference of Drag Coefficient against finest panel mesh for the FS-Flow® model.
2.2.3 Set-up and Mesh in StarCCM+®
StarCCM+® uses a finite volume technique to solve the Reynolds Averaged Navier-Stokes (RANS) equations (CD-Adapco, 2015). In order to directly compare the CFD and EFD results, the width and depth of the AMC towing tank were replicated in the numerical fluid domain, although the length was reduced to 10.0 m to decrease the mesh load while ensuring the pressure and wake fields generated by the hull were sufficiently resolved within the domain. In addition, since the flow around the hull is symmetrical about the centerline, only the starboard half of the hull was modeled in order to reduce the computational domain and thus the associated computational effort. The vessel was fixed in all degrees of freedom, using trim and heave conditions obtained from the captive model test results. The computations were performed using hexahedral trimmed mesh generated by StarCCM+®. Following a mesh independence study (Figure 2.4), a mesh with approximately 3.5 million cells was selected for the investigation as the percentage difference reduced to below 0.5% beyond this size mesh.
The near wall spacing on the vessel is defined using the dimensionless distance (y+) measured from the wall surface to the edge of the first layer. The resolution of the boundary layer was estimated by prescribing the number of inflation prism layers, the growth rate, and the first node distance from the wall (y+) reflected by the non-dimensional distance value (y+), as defined in Equation 2.1.
8.78%
3.66%
0.49% 0.73% 1.46% 0.98% 0.00% 0 2 4 6 8 10
1400 1900 2400 2900 3400 3900 4400
% d if fe re n ce o f re su lt s co m p are d t o th e re su lts o f th e fin est m esh
Number of Panels