GAS PRICES
ΈίΔ
eurostat
DE EUROPÆISKE FÆLLESSKABERS STATISTISKE KONTOR STATISTISCHES AMT DER EUROPÄISCHEN GEMEINSCHAFTEN ΣΤΑΤΙΣΤΙΚΗ ΥΠΗΡΕΣΙΑ ΤΩΝ ΕΥΡΩΠΑΪΚΩΝ ΚΟΙΝΟΤΗΤΩΝ STATISTICAL OFFICE OF THE EUROPEAN COMMUNITIES OFFICE STATISTIQUE DES COMMUNAUTÉS EUROPÉENNES ISTITUTO STATISTICO DELLE COMUNITÀ EUROPEE
BUREAU VOOR DE STATISTIEK DER EUROPESE GEMEENSCHAPPEN
L-2920 Luxembourg — Tél. 43011 — Télex: Comeur Lu 3423
B-1049 Bruxelles, Bâtiment Berlaymont, Rue de la Loi 200 (Bureau de liaison) —Tél. 235.11.11
Denne publikation kan fâs gennem de salgssteder, som er nævnt på omslagets tredje side i dette hæfte. Diese Veröffentlichung ¡st bei den auf der dritten Umschlagseite aufgeführten Vertriebsbüros erhältlich.
Την έκδοση αυτή μπορείτε να την προμηθευτείτε από τα γραφεία πωλήσεων τα οποία 'αναφέρονται στην τρίτη σελίδα του εξωφύλλου.
This publication is obtainable from the sales offices mentioned on the inside back cover.
GAS PRICES
1978-1984
This publication is also available in the following languages: DE ISBN 92-825-4517-2
FR ISBN 92-825-4519-9 IT ISBN 92-825-4520-2
Cataloguing data can be found at the end of this publication
Manuscript completed in August 1984
For all information concerning this publication, contact: F. Desgardes — Tel. Luxembourg 43011, ext. 3102
Luxembourg: Office for Official Publications of the European Communities, 1984
ISBN 92-825-4518-0
CONTENTS
I . INTRODUCTION 7
I I . CONDITIONS AND METHODS 9
1. Scope and locations 9 2 . Units of measurement of energy 10
3. Standard consumers 11 4. Definition of the price levels recorded 14
III. UNITS OF VALUE 17
1. The European Currency Unit (ECU) 17 2 . The Purchasing Power Standard ( PPS ) 17
3. Prices in "constant" PPS 18 4. Price series ; 19
IV. TAXATION 21
1. Value Added Tax 21 2. Specific Taxes 22
V. GAS PRICES IN THE VARIOUS COUNTRIES 25
1. FR Germany 27 2. France 36 3. Italy 46 4. Netherlands 60 5. Belgium 67 6. G .D. of Luxembourg 77
7. United Kingdom 83
8. Ireland 92 9 . Denmark 99
VI. COMMUNITY COMPARISON AND CONCLUSIONS 105
VII. STATISTICAL ANNEX I
Tables
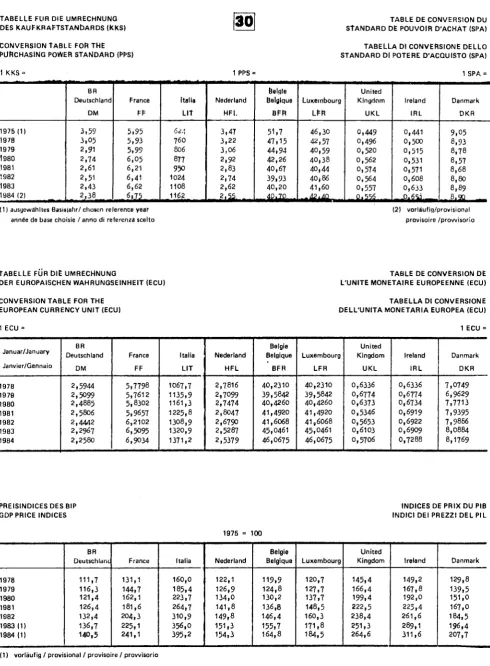
1 - 29: Househould and industrial prices by country Ill 30 : Conversion factors for PPS, ECU and GDP price indices XXXII
31 - 34: International comparison (EUR 9) XXXIII
Graphs
1 - 20: Household and industrial prices by country XXXVII
SYMBOLS AND ABBREVIATIONS
- / 0 . % 1975 = * +
3 m kWh
= 100
Nil
Data less than half the unit used No data available
percentage Reference year Natural gas Gasworks gas
cubic metre kilowatthour
GWh gigawatthour (10 kWh) MJ megajoule
GJ g i g a j o u l e (IO3 MJ)
n number GCV gross calorific value
DM Deutschmark FF French franc
LIT Italian lira HFL Duch guilder BFR Belgian franc LFR Luxembourg franc UKL Pound sterling IRL Irish pound DKR Danish crown
PPS Purchasing power standard ECU European currency unit
EUR 9 Total of the member countries of the European Communities excluding Greece
INTRODUCTION
As part of its work to record and analyse energy prices, the Statistical Office of the European Communities .presents a new official publication on gas prices covering the pe-riod 1978 to 1984, following on from and supplementing previous editions in the series.
Its aims are many :
(i) to record and analyse prices paid by consumers, permitting both retrospective and international comparisons;
(ii) to describe the tariff systems in order to arrive at the factors determining prices and to allow readers to calculate variants to the prices indicated;
(iii) to review taxes on gas sales.
For the sake of continuity and uniformity the definitions and methods are the same as those used in previous studies.
This publication is available in four languages: English - French - German - Italian.
II. CONDITIONS AND METHODS
1. SCOPE AND LOCATIONS
The present study aims to show the actual price of gas paid by the consumer in the mem-ber countries of the European Economic Community.
Two types of gas are concerned:
(i) Natural gas (methane);
(ii) Gasworks gas.
Contrary to natural gas, which is a primary energy source extracted from naturally oc-curring gasfields, gasworks gas is a derived energy source manufactured from coal, pe-troleum products or from cracked, reformed or mixed natural gas.
The present study is not concerned with liquified petroleum gas (butane, propane), coke-oven gas, or blast-furnace gas.
Only piped distribution is considered.
The prices were recorded in 27 towns within the Community:
FR Germany : Hamburg, Hannover, Dusseldorf, Frankfurt/Main, Stuttgart, Munich;
France : Lille, Paris, Strasbourg, Marseilles, Lyon, Toulouse;
Italy : Milan, Turin, Genoa, Rome, Naples;
Netherlands : Rotterdam;
Belgium : Antwerp, Brussels, Liège;
Luxembourg : Luxembourg city;
United Kingdom: London, Leeds, Birmingham;
Ireland : Dublin;
Denmark : Copenhagen.
In Greece there is no piped gas network.
Certain towns selected are representative of larger regions. This is indicated in the chapter concerning each country.
The prices are recorded at the beginning of each year based on the tariffs, contracts, conditions and rules in force at that time.
It is concerned with the actual price paid by the gas consumer, corresponding to the in-voiced delivery price to the consumer at the beginning of each year including any even-tual rebates and subsidies. Our consumers are defined as those who purchase gas for their own use and exclude those who offer it for re-sale. We have not considered the bulk price paid by the gas distributors.
2. UNITS OF MEASUREMENT OF ENERGY
Following international resolutions adopted by the General Conference on Weights and Measures, which resulted in the 'International System of Units of Measurement' (SI), a number of Council of Ministers Directives(71/354, 76/770 and 80/181) laid down the rules to be followed with regard specifically to units of measurement of energy.
The use of the calorie and its dérivâtes is now prohibited. Only two units of energy may be used, namely the joule and the kilowatthour. These two units are derived from the same basic definition, since 1 joule equals 1 watt/second. However, a concession was granted to the United Kingdom and Ireland, which may continue to use the therm for a transition-al period.
For units of measurement are therefore still found in the current gas tariffs, i.e.:
the joule (Belgium)
the kilowatthour (FR Germany, France) 3
the m (Italy, Netherlands, Luxembourg, Denmark)
the therm (United Kingdom, Ireland) 3
(the m is in turn defined by an energy content expressed in joules or in kWh).
With a view to a standardization and simplification, the joule (or its decimal multi-ples) was chosen by Eurostat as the common unit of measurement.
The decimal multiples of the joule are as follows:
kilojoule (kJ) = 1 000 joules
megajoule (MJ) = 1 000 000 joules
gigajoule (GJ) = 1 000 000 000 joules
terajoule (TJ) = 1 000 000 000 000 joules.
The table below can be used for conversion from one unit of measurement to another:
1 gigajoule
1 gigawatt hour
1 therm
GJ
1
3 600
0.1055
GWh
0.0002777
1
0.0000293
therm
9.4781
34 120
1
In addition, as a guide, one gigajoule of gas may be said to be approximately equivalent to 35 kg of saleable coal and 25 kg of light fuel oil or heating oil.
Finally, the unit of energy used in this study is measured on the basis of the gross calorific value (GCV), as is the practice in the gas industry and gas tariffs, i.e. the latent energy necessary for the evaporation of the water produced during the combustion of the gas, is taken into account. This method of measurement departs from that used in energy statistics and for other sources of energy, where the net calorific value (NCV), which is closer to the energy that can actually be used by the consumer, is always used.
For gas the difference between gross and net calorific value is around 10%. The gas price shown in this study in GJ (GCV) can thus be converted into GJ (NCV) by applying a factor of 1.1.
However certain recent condensation gas heaters permit a better use of the gross calor-ific value by re-using some of the latent energy of evaporation.
3. STANDARD CONSUMERS
The survey is based on the system of standard consumers, i.e. the prices are recorded for certain levels of gas consumption and under certain conditions of supply, chosen as being representative of the population of gas consumers. These standard levels of con-sumption remain fixed from one year to the next and for all the countries, this being one of the primary conditions for spatial and temporal comparability of prices.
A standard consumer corresponds in fact to a meter to which a tariff or contract is ap-plied. Where a consumer has two separate meters corresponding to two different tariffs,
for example one for space heating, the other for professional use one does not calculate an average but considers that there are two separate standard consumers.
Two families of standard consumers are taken: domestic uses and industrial uses.
consump-Five; domestic standard consumers coded D„ to D , have been taken: 1 4
V
D21 D3 D3b D4
Annual 8.37 GJ 16.74 GJ 83.7 GJ 125.6 GJ 1 047 GJ
consu (i.e. (i.e. (i.e. (i.e. (i.e.
mp t i on 2 326 kWh)
4 652 kWh)
23 260 kWh)
34 890 kWh)
290 750 kWh)
Equipment
[
r cooking and water heating]
y cooking, water heating and central
J heating
block central heating for at least 10 dwellings
For the United Kingdom there is an additional standard consumer, i.e. 33.49 GJ (9 300 kWh or 8 G c a l ) .
Industrial uses cover medium and large users (industries, large commercial or adminis-trative buildings, e t c . ) .
For industrial uses, apart from the annual quantity consumed, the regularity with which the user takes gas from the network is also considered. This involves the concept of modulation (or load factor).
The daily load factor is the number of days which would be required to take the entire annual consumption at the máximum daily offtake rate.
The hourly load factor is the number of hours which would be required to take the e n -tire annual consumption at the maximum hourly offtake rate.
These terms therefore determine the peaks or offtake ceilings reached by the consumer in the course of one day or one hour over the year.
The general formula is:
daily load factor nJ = 7v? Qa
Qj max
hourly load f a c t o r nh = Qh max Qa
where Qa = annual volume consumed, Qj max = maximum daily offtake, Qh max = maximum hourly offtake.
Taking account of these characteristics, seven standard industrial consumers, coded I to Io r, have been chosen:
h
h
h-1
h-2
h-l
J4-2
h
4
41
41
418
418
4 186
Annual c(
418.
186
860
860
600
600
000 60 GJ
GJ
GJ
GJ
GJ
GJ
GJ
Dnsumption
or
or 1
or
or
or
or
or
116 300
163 000
11.63
11.63
116.3
116.3
1 163 kWh
kWh
GWh
GWh
GWh
GWh
GWh
Equipment
no load factor laid down^
200
200
250
250
330
330 days
days 1 600 h
days 4 000 h
days 4 000 h
days 8 000 h
day 8 000 h
If necessary.<C 200 days ^115 days,
The other characteristics which could play a part in establishing the price will be de-termined on a case-by-case basis, always adopting the solution which is most frequent in practice, these characteristics are mentioned where applicable.
It can be seen that certain standard consumers have the same load factor for different volumes of consumption or, conversely, different load factors for the same volume of consumption; the reason for this is to enable the effect of these conditions of supply on the level of prices to be observed. The higher the load factor (in days or hours) the more regular the offtake of gas, thus in some cases, enabling the consumer to obtain favourable prices.
Moreover, the load factor gives some idea of the use made by installations consuming gas. Thus, a very high load factor, e.g. of 8 000 hours, is obviously equivalent to an installation functioning practically non-stop, day and night, throughout the 8 760 hours in the year.
All the prices recorded in this study for standard industrial consumers normally relate to non-interruptible supplies, i.e. the seller of gas must supply the quantities demand-ed by the consumer (whose peaks are determindemand-ed by the modulation laid down for standard consumers). In some cases there are interruptible contracts, under which the seller of gas can reduce the quantities supplied to the consumer at certain peak times when the network is overloaded. In return for this reduction of supply, the consumer pays a re-duced price. Such cases are mentioned where they represent a sizeable part of deliv-eries.
4. DEFINITION OF THE PRICE LEVELS RECORDED
All prices are shown per unit of gas sold, that is per gigajoule (GCV). The results rep-resent the unit price at the beginning of each year and take account of the relevant tariff, parameter, index, etc. applicable as from the 1 January. In the case of tar-iffs or contracts with short therm indices (month, quarter) it is the index which is in force during January which is applied. The prices include meter rental, the standing charge and the commodity rate. They do not include the initial installation charge to the consumer.
If there are several possible tariffs, it is the tariff which is most advantageous to the consumer that is taken into account, after the elimination of the tariffs which are not used in practice or which apply only to a marginal or negligible number of users.
When there are only quasi-tariffs, special contracts, or freely negotiated prices, the most commonly found price (most representative) for the given supply conditions has been recorded.
In the case of freely negotiated prices or contracts, the returns relate respectively to the bills paid during the month of January or to the prices resulting from the contracts in force during that month. Such cases are mentioned and explained in the body of our study.
There price levels are shown :
(i) the price net of tax;
(ii) the price excluding VAT but including all other taxes;
(iii) the selling price (inclusive of all taxes).
The price excluding tax is obtained directly from the tariffs or contracts.
The price excluding VAT includes, where payable, other specific taxes which is interest-ing in cases where VAT is deductible.
The price inclusive of all taxes corresponds to the sum paid by the consumer.
'Taxes' is used here to mean fiscal and parafiscal levies applying directly to gas at the stage of sale to the consumer. These taxes may be levied at the national, regional, local or municipal level, etc. by the State, regional or local administrations, profes-sional associations, etc. Anti-pollution charges levied on gas sales are therefore in-cluded.
On the other hand, the taxes levied before the sale of the gas, such as taxes on compa-nies, profits, wages etc., which are obviously part of the production or distribution costs, are not calculated separately. They remain an integral part of the price
The results for each country are shown in national curronci rs at current prie-or:, i .e. al, face value.
For the purposes of international comparison, it was necessary to use a representative common monetary unit which would create a minimum of distortion in both space- and time. Accordingly, the present study uses the purchasing power standard (PPS). The comparative tables are also shown in European currency units (ECU).
"J i Τ . UNITS OF VALUE
To enable comparisons between countries, prices expressed in national currencies need to be converted to a common unit. In this study two common units are used: the European currency unit (ECU) and the Purchasing Power Standard (PPS).
1. THE EUROPEAN CURRENCY UNIT (ECU)
The ECU is based on a 'basket' of the currencies of nine of the Member States of the Community, converted at market exchange rates. It is defined as the sum of the following fixed amounts: DM 0.828 UKL 0.0885 FF 1.15 LIT 109
HFL 0.286 BFR 3.66 LFR 0.14 DKR 0.217 IRL 0.00759.
The conversion rates for ECU are given in a table in the annex.
The ECU reflects fluctuations in exchange rates and is well adapted to measure the prices and the values of international flows of goods and services.
Data expressed in ECU, therefore permits the comparison of the price of goods and serv ices between two countries after changing money at a bank. This differs from the
PPS viewpoint which is one of a consumer who buys goods and services in his own country with the national currency.
The ECU also has the inconvenience that its definition changes when a new currency is introduced and that it is not coherent with the gross domestic product price index, which makes it difficult to deflate.
2. THE PURCHASING POWER STANDARD (PPS)
The PPS is a reference unit for which the ratios between the different national curren cies are proportional to the purchasing power parities (PPP) between these currencies.
The PPP, which are calculated for all the uses of the GDP, reflect the ratios between price levels in the different countries; they indicate the amount of a national currency required to buy in each country the same basket of goods and services which are included in the uses of the GDP. In this present publication only the PPP at GDP level are used.
It should be noted that the level at which the PPS is fixes does not influence the com-parison between countries. When prices are converted to PPS using the GDP parity the following conci usi on is possible: if one gigajoule of energy costs 10 PPS in country A and 5 PPS in country B, this means that after eliminating the differences between the general level of prices in the two countries, this gigajoule of energy is twice as ex-pensive in country A than in country B.
This conclusion is independent of market exchange rates and therefore, is not influenced by fluctuations in the same, brought about by movements of capital, speculation, politi-cal decisions, etc.
The conversion rates for the years covered by this study are given in a table in the annex.
3. PRICES IN 'CONSTANT' PPS
When current prices for a given year are converted to PPS with the help of the current PPP for the same year, comparisons between countries have the significance mentioned above (point 2); however, the comparison in time which one can derive for each country has little interest.
Firstly, it should be noted that the current parities for each year between each curren-cy and the PPS are the result of an extrapolation obtained by multiplying the parities for the base year by the GDP price index for each country and dividing them by the Com-munity GDP index.
The latter being incorporated in the extrapolated parity for each country, it may be eliminated without affecting the result of the comparison between countries.
By eliminating the community index, the application of the extrapolated parities means that for each country the prices for each year are divided by the GDP price index of the country (i.e.; the prices are deflated) and are converted to PPS using the parity for the base year.
Therefore the comparison between countries is not affected by eliminating the Community GDP index, and comparisons in time have taken on a new and interesting significance.
In effect, when the price of a product in a given year, deflated by the GDP price index for the same country and converted to PPS using the parity for the base year, is divided by the price in the base year also converted to PPS using the same parity, a relative price index is obtained, i.e. the ratio between the index of the price concerned and that of the GDP.
compar-isons may be made between countries, giving the same results as would be obtained using current prices and current PPP; at the same time this table may be used for comparisons in time at national level (corresponding to relative indices).
4. PRICE SERIES
On the basis of the preceding descriptions, the results of this survey of Community prices are given in three forms:
(i) a series at current prices in the national currency for each country;
(ii) a series in current ECU using the average conversion rates for January of the year concerned;
IV. TAXATION
In the nine countries covered by this study the sales of gas rate subject to a general indirect tax i.e. value-added tax. Furthermore in three countries specific taxes are levied and sales. The prices including all taxes shown in this study include all these taxes. In the tables in the annex amount of the specific taxes can be calculated from the difference between the tax exclusive and VAT exclusive prices while the difference between the total tax inclusive price and VAT exclusive price gives the amount of value-added tax in national currencies per gigajoule.
1. VALUE-ADDED TAX
During the period studied VAT was levied in each of the countries on the price excluding VAT but including the specific taxes which are included in the basis of assessment. VAT is always a proportional tax unlike the specific taxes.
Below, in table form we give the rates of VAT found during the period studied.
Value-added tax (VAT) rates on gas sales
% of price before VAT January
FR Germany France
Italy (domestic) Italy (non-dom.) Netherlands Belgium Luxembourg United Kingdom Ireland
Denmark
1978
12 17.6
6 14 4 6 5 0 0 18
1979
12 17.
6 14 18 6 5 0 0 20,
6
25
1980
13 17.6
6 14 18 6 5 0 0 20,25
1981
12 17.6
8 15 18 16 5 0 0 22
1982
13 17.6
8 15 18 17 5 0 0 22
1983
13 18.6
8 18 18 17 5 0 0 22
1984
14 18.6
8 18 19 17 6 0 5 22
2. SPECIFIC TAXES
(a) Italy
Since February 1977 sales of natural gas for domestic uses have been subject to a con-sumption tax (imposta di consumo) the rates of which were as follows:
3
until August 1979 LIT 30.00 p e r m
September 1979-February 1980: LIT 36.50 p e r m"
from March 1980 LIT 30.00 per m .
For natural gas sold intact LIT 30 m is approximately LIT 788 per GJ (GCV).
This tax is also applied to manufactured gas in proportion to the percentage of natural gas used in its manufacture. Therefore the rate will vary depending on the composition of the gas. For greater detail see the chapter 'Italy', paragraph b.
Since November 1980 (Law No 784) domestic consumers in the south of Italy (Cassa per il Mezzogiorno zone) are exempt from this consumption tax.
This tax is included in the basis of assessment to VAT.
(b) Netherlands
3
A special environment levy is applied to gas sales of less than 170 000 m /year, the rates of which were as follows:
cents/m" cents GJ
1978-81 1982 1983-84
0.03 0.05 0.054
0.85 1.42 1.53
This levy is included in the basis of assessment to VAT. The basis of this levy is dealt with in greater detail in the chapter concerning the Netherlands.
(c) Denmark
Between the 1 August 1979 and the 31 December 1983 a special consumption tax was levied 3
1.08.1979-29.OG.1980 30 .6.1 980-31 .12.1 983
f5 r c m
20 16
3 DKR/GJ
11 .94 9.56
V. GAS PRICES IN THE VARIOUS CONTRIES
1. FR GERMANY
2. FRANCE
3. ITALY
4. NETHERLANDS
5. BELGIUM
6. G.D. OF LUXEMBOURG
7. UNITED KINGDOM
8. IRELAND
1. FR GERMANY
(a) Situation in the gas industry
Several hundred gas undertakings operate in the FR Germany and may be classified into three categories:
(i) producers of natural gas
(ii) gas transporters (Ferngasgesellschaften)
(iii) gas distributors
number 6
9
498
The producers and transporters sell gas to certain large consumers and also supply the distributors.
The latter are therefore mainly retailers, although some of them also produce manufac-tured gas.
In 1982 sales (natural and manufactured) were as follows:
Sellers
Natural gas producers Gas trans-porters Distributors
Total
Buyers
Industry and power stations
6.3
25.3 27.3
58.91
Households
26
26
Commerce and
handi-crafts
0 5.5
5.5
Government dept s
0 5
5
Heating stations and others
0
0 4.5
4.6
Total
6.4
25.4 68.2
100
Including 11.6% power stations.
FR GERMANY
At the end of 1902 the number of gas consumers was as below:
Households
tariffs
of which special contacts Commerce, small industries Government depts
Industry Others
Numb er of cust 1 000 n
7 500 (4 400) (3 100) 309
38 19 5
orners Standard consumers
D1 D3 Ji
h
ΏΡ D4
h
h
-
h
In addition, 684 000 households were heated by heating stations run on gas.
The majority of customers receive gas via the distributors. The producers and trans porters supply only a small number of large consumers directly: power stations and in dustrial companies (around 1 500 consumers).
Natural gas dominates the market with manufactured gas only representing 2.5% of the needs. It is for this reason that the prices given in this study refer to natural gas.
The sources of natural gas are diverse as can be seen from the following:
%
Domestic production
Imports from the Netherlands Imports from the USSR
Imports from Norway
1978
37 37 15 11
100
1979
34 38 16 12
100
1980
30.5 37 17 15.5
100
1981
33 32 20 15
100
1982
31 33 20 16
100
1983
32.5 33 20 14.5
100
(b) Taxes
Gas s a l e s a r e s u b j e c t t o v a l u e - a d d e d t a x (VAT) t h e r a t e s o f w h i c h w e r e a s f o l l o w s : 12% 1 . 1 . 1 9 7 8 t o 3 0 . 6 . 1 9 7 9 ;
FR GERMANY
These rates are applied to the price excluding VAT. VAT is deductible for industrial and commercial users.
(c) Household prices - tariffs
In accordance with German law (Bundestarifordnung Gas) the distribution companies must offer two-part tariffs to the small consumers. These tariffs must contain a standing charge, which should correspond to the cost of meter rental and reading and an identical commodity rate for all uses of gas. Very often three tariffs are offered with various combinations of standing charge and commodity rate.
These tariffs are published and concern the standard consumers D and D (cooking and hot water). Above this level a system of contracts (Sonderverträge) prevails. The law does not oblige the publication of these contracts, the basis of which are liberally established by the gas distribution companies.
For households the formulae are are generally of the two-part type with a standing charge and a commodity rate, however variations exist as follows:
(i) a single two-part tariff with four degressive price blocks (Stuttgart);
(ii) one part tariff, without a standing charge (for central heating D Düsseldorf);
(iii) a tariff which takes account of boiler capacity (D Frankfurt/Main).
In the common with the regulations governing electricity prices there is a ceiling price which cuts across the degressivity curve. The contracts for all household uses are annual, renewed by tacit agreement. The tariffs and the terms of the contracts are amended at the instigation of the distribution companies. These changes are made as the need arises and may be annual or less frequent. Normally prices are revised in October, before the winter season.
(d) Household prices - analysis
The results are shown in Tables 1 - 3 and Graph No 1 in the annex. For various reasons it has not been possible to collect prices for some cities for the years 1980-83.
Despite these omissions, analysis of the results is possible.
The enquiry for 1984 showed large regional differences in price; The range of prices
FR GERMANY
DM/GJ (VAT incl.) Standard
consumers
Di D2 D3 D3b D4
Highest price
45.24 Düsseldorf
36.53 Stuttgart
23.47 Stuttgart
21.91 Stuttgart
18.94 Stuttgart
Lowe
37.53
29.81
18.59
17.73
15.31
st price
Hamburg
Munich
Hannover
Hannover
Hannover
Range
7.71
6.72
4.88
4.18
3.63
The lower levels of consumption exhibit the greatest regional price differences in abso-lute terms. On the contrary, in relative terms (ratio between the highest and lowest prices) one observes for all standard consumers a range of 20 to 25%.
The city where prices are nearest the median or average is Düsseldorf. It is for this reason that it was chosen for international comparison.
But this regional difference has been reduced since 1978 when the range of relative prices reached 26 tot 50%. The largest ranges were shown for the smallest consumers. The large number of independent companies together with the liberal system are unlikely to lead to a standardization of prices. The regional price differences reflect local distri-bution conditions together with the distance over which the gas is transported.
Just as the price varied from one city to another, the rates of increase between 1978 and 1984 also varied considerably as illustrated by the following table in which the price including VAT has been taken for analysis:
1984/1978 in % Standard
consumers
Dl D2 D3 D3b D4
Hamburg
22
24
37
34
59
Hannover
72
64
70
76
56
Düsseldorf
54
52
59
59
70
Frankfurt
30
70
50
58
70
Stuttgart
39
42
58
62
63
Munich
73
65
88
90
94
FR GERMANY
1980, 1981 and 1982 and then a return to stability. The increases in VAT only accounted for two percentage points of the rises. In some cases prices have actually fallen since 1982. In Düsseldorf two changes of tariff introduced in October 1982 and November 1983 meant decreases of 8% on average.
Tariff degression i.e. the reduction in unit price as a result of the volume consumed is of the order of 40% in 1984 (D /D ), which is a little greater than in 1978.
A comparison between the selling price of gas (VAT inclusive) and the gross domestic product (GDP) price index gives the following results, Düsseldorf being taken as most representative :
1975 = 100
1978
1979
1980
1981
1982
1983
1984
GDP price index
111.7
116.3
121.4
126.4
132.4
136.71
140.52
VAI
Di
148.4
148.4
149.7
181.4
235.8
.
228.1
1 inclusive price
-D2
154.5
154.5
155.9
189.1
245.5
.
234.3
D3
156.4
156.4
157.8
204.9
255.4
,
236.6
- Düsseldorf
D3b
153.2
153.2
154.6
206.3
264.6
.
243.6
D4
161.1
161.1
162.5
238.4
292.3
.
273.2
Provisional. Estimated.
The price of gas is greater than the price of all goods and services as represented by the GDP index. In real terms gas is actually more expensive now than it was in 1975. The same holds true for the other cities of the FR Germany.
(e) Industrial prices - tariffs
FR GERMANY
Nevertheless those contracts are based on simple formulae for the calculation of prices which can be divided into two categories:
(i) two-part formulae composed of:
(1) annual standing charge (Grundpreis) which depends on the capacity of the users installation,
(2) a single commodity rate (Arbeitspreis - DM/kWh);
(ii) three-part formulae comprising: (1) annual meter rental (Meßpreis),
(2) offtake charge (Leistungspreis) based on the regularity of offtake (DM/kWh), (3) a single commodity rate (Arbeitspreis - DM/kWh).
All contracts are concluded for a period of one year and are renewable (if not denounced by one or other party). The terms are modified by the seller normally when the contract is being renewed.
Old fixed price contracts no longer exist and the clauses of all the present contracts are the same for all users having the same offtake.
Alongside these contracts for non-interruptible supplies there are also those for inter-ruptible supplies. The conditions therein vary considerably from one distributor to another. The conditions depend on:
(i) the length of interruption which can be from 10 to 42 days considering the poly-valent capacity of the users installation;
(ii) the notice, always short, between 30 minutes and 6 hours;
(iii) the price levels result from either a cancellation of the standing charge (i.e. only a commodity rate) or a very large reduction is granted on the standing charge or thirdly a reduced monthly commodity rate based on the fuel oil price quotations published by the Federal Statistics Office.
In general the price for interruptible supplies is between 15 and 30% below that for firm supplies for similar volumes of consumption.
f) Industrial prices - analysis
The results are shown in Tables 4 to 6 and on Graph No 2 in the annex.
For various reasons it is not possible to give the prices for 1980 to 1983 in certain cities. Furthermore certain standard consumers (I_ for example) do not exist and in the
FR GERMANY
absence of such levels of consumption no price is given. In Munich, for reasons of se crecy only an average price has been given for the large industrial consumers (I ,1 ) .
Despite these omissions an analysis of the results can be made. As with domestic users one notices regional differences in prices which reflects the liberal contract terms of the distributors. In 1984 the range between extreme cities comparing the prices excl. VAT was as follows:
Standard consumers
h
h
X3l J32
h-1
h-2
h
Highest price
20.12
17.25
15.55
14.99
14.91
14.36
14.36
Munich
Stuttgart
Düsseldorf
Düsseldorf
Düsseldorf
Düsseldorf
Düsseldorf
Lowe
14.34
13.82
13.06
12.39
12.02
11.78
12.09
DM/GJ (VAT excl.)
st price
Hamburg
Frankfurt
Munich
Frankfurt
Hannover
Hamburg
Frankfurt
Range
5.78
3.43
2.49
2.60
2.89
2.58
2.27
In relative terms (ratio between highest and lowest prices) there is a range of 20 to 25% except for I . These regional pi
when they were of the order of 60%.
25% except for I . These regional price differences have greatly diminished since 1978
Just as prices vary from one city to another so also do the rates of increase. The fol lowing table, calculated on the tax exclusive price shows the evolution of prices over the sixyear period.
1984/1978 (in %) Standard
consumers
h
\
V i
Χ32 J4l
Hamburg
11
63
83
82
83
Hannover
73
101
121
142
138
Düsseldorf
51
115
115
118
135
Frankfurt
67
72
86
80
91
Stuttgart
65
70
FR GERMANY
In general the large consumers have suffered the greatest increases. This shows that the commodity rate has increased more than the standing charge in the price fixing for-mulae. In other words the cost of acquiring the gas has grown by more than the cost of transport and distribution.
Because the rates of increase vary from one city to another their classification is never stable. It is therefore impossible to select a median or average city in the FR Germany.
As with domestic consumers three phases can be seen in the evolution of prices, calm in 1978 and 1979, increases from 1980 to 1982 followed by stabilization.
Tariff degression as a result of the volume consumed is between - 10% and - 15% between I and I , i.e. the unit price drops by 10 to 15% when consumption is multiplied one hundredfold. This degression has been reduced since 1978 when the reduction was 20 to
30%.
In addition to the volume of consumption the modulation always has an effect as one can see from the tables in the annex by comparing the prices for the standard consumers I3_,/I3_2 and I4_i/I4_2" An improvement in modulation (reduction of the maximum daily offtake) from 200 to 250 days means a decrease in the unit price of between 4 to 7% ac-cording to city.
A comparison between the selling price of gas and the gross domestic product (GDP) price index can be attempted. We have taken Düsseldorf as an example because it offers the most complete price series.
1975 = 100
1978
1979
1980
1981
1982
1983
1984
GDP p r i c e index
111.7
116.3
121.4
126.4
132.4
1 3 6 . 71
1 4 0 . 52
h
in
.A117 .A
117 .4
155.9
196.9
.
177.2
S e l l i n g p r i c e excl
h
128.7128.7
176.0
214.2
294.3
.
277.5
V i
128.7
128.7
172.9
211.8
294.3
.
277.2
. VAT - Düsseldorf
h-2
126.4
126.4
170.6
211.0
292.1
.
275.1
V i
135.2
146.3
196.8
243.5
337.7
.
317.9
v
2
133.6145.1
195.8
244.5
337.8
.
317.7
FR GERMANY
In all cases since 1975 the price of gas for industry has grown by more than the price of all goods and services as represented by the GDP price index. In real terms these in-creases are greater for the larger consumers.
?. FRANGI
(a) Situation in the gas industry
In France gasworks gas has virtually disappeared from the market and this study there fore covers only natural gas.
The breakdown of natural gas sales in 1983 within the country is as follows:
Customers
Domestic uses (individual and collective)
Industry
Public power stations (EDF)
Commercial uses and other uses
Total
Sellers
1
Gaz de France
35.9
34.8
0.1
12.8
83.6
2 Private companies and au thorities
■1.2
0.4
0.9
2.5
3
Société Gaz du SudOuest
_
4.8
_
4.8
4
CEFEM
—
4.9
0.3
_
5.2
5
SNRA (Ρ)
_
1.5
2.4
_
3.9
Total
37.1
46.4
2.8
13.7
100
Represented in this study by Toulouse (except I. and I,.) , Lille, Paris, Lyon and
4 b
Marseille.
Represented in this study by Strasbourg.
Represented in this study by Toulouse (I and I ) . CEFEM = Compagnie française du méthane.
SNEA (Ρ) = Société nationale Elf Aquitaine Production.
FRANCE
Domestic uses: heating tariffs
Domestic uses: other tariffs
Collective heating
Commercial and similar uses
Industry
1980
26.8
4.9
9.9
15.0
43.4
100
1981
26.6
4.5
10.0
14.4
44.6
100
1982
27.1
4.5
10.6
15.0
42.8
100
1983
27.3
4.8
11.0
15.3
41.6
100
Standard consumers
D3
Di
D4
h
h
D3b
D2
h
τ
Α h
In 1983 the total number of customers was 8 425 000 broken down as follows:
/ households: heating tariffs
households: other tariffs
commercial and similar uses
\ industry
3 463 000
4 629 000
316 000
17 000
Supplies of natural gas are diversifying as regards both origin and point of entry:
National production (South-West)
Imports
Netherlands
(
FR Germany USSR Norway Algeria Others
1980
28.1 37.5 3.9 13.2 9.3 7.9
-100
1981
25.5 31.0 3.8 15.0 9.8 14.9
-100
1982
25.6 20.1 4.2 14.3 9.6 26.1 0.1
100
1983
22.2 23.6 1.8 12.4 8.5 28.1 3.4
100
(b) Taxes
From 1978 to 1982 sales of gas were subject to value-added tax at the rate of 17.6%. For
1983 and 1984 the rate was 18.6%. VAT is deductible in the case of industrial and com
FRANCE
(c) Household prices - tariffs
The tariff for 'retail' or 'semi-wholesale' sales are of the simple two-part type with a standing charge and a rate for the gas consumed. The standing charges arc standarized throughout the country. The commodity rate is uniform for the smallest household consum ers (cooking and hot water) and has a limited number of levels for larger consumers (heating), depending on the region (6 zones). As an example, the table below shows the tariff components applicable in January 1984 in the cities chosen for the survey (Paris, Lille, Lyon, Marseilles, Toulouse) in zone 1 which are supplied by Gaz de France:
S t a n d a r d c o n s u m e r s
Dl D2
D3 D3 b
D4
T a r i f s z o n e 1 T a r i f f
Bo 3 Gb
Β h e a t i n g
J a n u a r y 1984 S t a n d i n g c h a r g e
F F / y e a r 1 8 5 . 4 0 9 7 9 . 6 8 2 1 2 8 . 5 6
Commodity r a t e C /kWh
2 4 . 6 9 1 6 . 0 5 1 5 . 3 2
FF/G J 6 8 . 5 8 4 4 . 5 8 4 2 . 5 5
For the tariffs 3Gb and Β - heating, higher commodity rate levels are applied in cer tain regions which are some distance away from the transport grid connecting the coun try's natural gas supply points.
Tariff Β applies to collective domestic heating (block central heating of appartments) and also to commercial and similar uses (standard consumers I and I„ in this study).
These tariffs were augmented on 1 February 1984 with increases in the commodity rate ranging from 5% for small consumers to 10% for large consumers.
(d) Household prices - analysis
The prices are given in Tables 7 to 9 and on Graph No 3 in the annex. Between 1978 and 1984 the tax inclusive price of gas for domestic users increased by between 121% and 200%. The fact that larger increases are suffered by the bigger consumers is important as this has the effect to reducing tariff degression. Those using gas for central heating have suffered larger increases than those using gas for cooking.
The price of gas showed an upward trend throughout the period with the largest increases occuring during 1979 and 1981.
FRANCE
the prices in the area served by Gaz de France. Since 4 January 1980 Gaz dc France prices for domestic consumers have been the same and regional differences no longer exist (with the exception of Strasbourg which is not served by Gaz de France and where another tariff system operates).
The diversification of the points of supply of natural gas and the interconnection of supply grids has brought an end to the geographical influence on prices.
The increases in the price of gas to the consumer have been a direct result of the ris-ing cost of imported natural gas. Durris-ing the period taxation has remained fairly con-stant with a rise of 1% in the rate of VAT during 1982.
Tariff degression has decreased during the study period. In 1978 the difference in the unit price between D and D was - 63%, by 1984 it had fallen to - 50%.
A. comparison between the index of the tax inclusive selling price of gas, the gross domestic product (GDP) index and the average receipts gives the following results:
1978
1979
1980
1981
1982
1983
1984
GDP price index
131.1
144.7
162.1
181.6
204.3
2 225.1
241.I3
Average receipts
112.4
117.5
150.9
189.7
231.0
252.0
Tax incl. s
Di 113.8
125.2
159.0
179.4
212.0
234.4
251.5
D2 113.7
125.1
160.1
183.2
219.0
243.1
261.8
1975 = 100 elling price - Paris
D3 115.4
127.8
171.3
201.7
251.0
278.6
300.0
D3b 118.7
132.7
181.6
217.3
274.9
307.0
332.6
D4 106.4
116.9
166.6
198.0
261.9
292.5
319.7
Individual domestic consumption (D ,D ,D ) . Provisional.
Estimated.
Until 1979 the selling price of gas evolved in line with the GDP price index which shows
FRANCE
selling price of gas grew faster than the GDP price index, particularly for heating users (D ,D ) which means an increase in real terms.
Likewise for the average receipts two periods can be distinguished. Until 1979 the aver age receipt for individual domestic users grew slower than the selling price, from 1980 onwards the average receipt seemed to have caught up.
This is due to two opposite effects: the first being the growth of the average consump tion and the lowering of the unit price as the consumption increases; and secondly the reduction in tariff degression.
Between 1975 and 1983 the average consumption of each domestic subscriber grew by about 40% due to the increased use of gas for central heating.
Actually the average consumption per domestic subscriber (D ,D ,D ) has grown to about 32 GJ per year and the average receipt established itself at FF 70/GJ (VAT incl.) thus between standard consumers D and D .
(e) Industrial prices tariffs
For the cities chosen for this study the tariffs differ with the seller:
Lille, Paris, Lyons, Marseilles (I, to I,_)
1 5
Toulouse (1^1 ,1 )
Toulouse (I ,1 )
Strasbourg
Gaz de France
Société du Gaz du SudOuest
Gaz de Strasbourg
Gaz de France has two types of tariff, namely type Β heating for 'semiwholesale' sales (I ,1 ) and type S or subscription tariffs for large industrial consumers (I ,1 ,
v·
The Β heating tariff is the same as that which was explained in chapter C.
The tariffs for large industrial consumers whose consumption is above 18 000 TH/year (I ,1 ,1 ) have a more complex structure than those described above: they are the sub scription tariffs, known as S tariffs.
The S tariffs which are now in force were introduced as from January 1979. They now cover virtually all industrial customers.
FRANCE
(i) an identical annual subscription charge for every point on the grid;
(ii) a monthly standing charge based on the daily demand (kWh/day) which the customer has requested;
(iii) a commodity charge per kilowatt hour, with differing rates for two blocks of con-sumption.
These tariffs have two versions corresponding to the type of network to which the cus-tomer's installations are connected, namely the SR tariff for installations connected to the public distribution network and the ST tariff for installations connected direct-ly to the transmission grid.
A single tariff is applied to the major interconnected transmission routes linking the country's sources of gas; prices for the minor routes are obtained by adding the charges specific to each one to this tariff (system of tolls).
The tariffs refer to an index N which applies to all the tariff components.
The index N is given by the formula:
N = 50 F_ + 50 C_
Fo Co
with Co = 204, Fo = 119.10 (values of C and F on 31 January 1959).
C represents the wholesale price of French raw coal as published by the Institut Na-tional de la Statistique et des Etudes Economiques (INSEE) ;
F represents the price in francs per tonne of No 2 heavy fuel oil calculated as fol-lows:
F = 375.32 Fu/283.
Fu refers to the index of No 2 heavy fuel oil prices, published in the Bulletin Officiel du Commerce et de la Concurrence (BOCC) for the last day of the month to which N applies.
The basic tariff components which appear in the contracts correspond to a value of 426 for the index N.
FRANCE
The applied price resulting from this must be greater than the price which would result from the free application of the terms of the contract.
If Pref is defined as the reference price (N = 426) , the following inequality must al ways be observed:
Pref χ Na + increase ^ Pref χ Ν (contract)
426 426
This is the 'ceiling' system of subscription tariffs. The prices actually charged depend therefore on the index Na and the absolute increase, provided that the ceiling price calculated on the basis of Ν does not come into play.
The table below shows the basic prices of the tariff components per Gigajoule for the Paris region: Ν = 426.
Standard
consumers Tariff
SR
ST
Annual sub scription charge in
FF
24 000
24 000
Monthly standing
charge
FF/GJ1
43.79
33.67
Commodity rate in FF/GJ
First block2 Remainder
13.22 12.67
13.08 12.53
Per GJ of maximum daily offtake. 2
Limit set at 24 000 000 kWh/year, i.e. 86 400 GJ/year.
By applying the index Na and the commodity rate increase the tariff has the following values for January 1984:
Standard consumers
Io
V
X5
Tariff
SR
ST
Annual sub scription charge in
FF
38 603
38 603
Monthly standing
charge
FF/GJ1
69.79
54.15
Commodity rate in FF/GJ
First block2
Remainder
30.13 29.23
29.90 29.01
Per GJ of maximum daily offtake.
FRANCE
In the other regions, these basic prices may differ as a result of the system of tolls.
Industrial supply contracts, like all contracts are signed for a period of three years.
There are also interruptible contracts, likewise signed for three years, which cover ap-proximately 30% of Gas de France's sales to industry.
The terms of these contracts are as follows:
(i) the customers must possess an installation capable of using a type of fuel other than gas;
(ii) as a general rule at least 80% of the quantities stipulated in the contract must be consumed in this way, except in the case of an interruption of supply;
(iii) the supplies are interrupted by Gaz de France, with prior notice of between 24 hours and 15 days;
(iv) the price charged results, according to the supply conditions, either from the normal registered tariff (see above) or the normal tariff limited by the price of the alternative fuel. As a rule, it is the actual price of heavy fuel oil used by the consumer, plus 1 or 2%. In other words, the normal list price for gas only applies when the price of the alternative fuel is higher. This type of contract was not applied to the standard consumers in this study.
(f) Industrial prices - analysis
The prices are shown in Tables 10 to 12 and in Graph No 4, in the annex.
Several prices shown here differ from previous editions as a result of changes in the method of calculation proposed by Gaz de France.
During the period 1978-84 prices rose steadly with two large rises during 1979 and 1981. This is due to the influence of the index N which reflects oil prices. The increases in tax inclusive prices ranged from 185% to 234% in the Paris region, the larger the con-sumption the larger the increases, which has meant an oblateness of the tariff degres-sivity curve. Thus the difference in unit price between I and I has dropped from - 45% in 1978 to - 35% in 1984 for Gaz de France.
The price increases vary, not only according to consumption but also according to zone thus causing lesser regional price differences.
FRANGI·:
only a few percent in 3 984. It is Toulouse which remains cheapest, because of its prox-im:i ty to the Lacq gas fields.
The modulation has a small influence on prices. The reduction in the unit price as a result of an increase in modulation from 200 to 250 days (I ) is 2.4% and 2% from 250 to 330 days (I.)· This reduction for regularity of offtake has diminished in recent years.
Regularization of offtake from the grid is obtained mainly by the use of interruptible contracts and by stocks.
A comparison between the price of gas, the average receipts and the gross domestic prod-uct price index (GDP) gives the following results:
1975 = 100
1978
1979
1980
1981
1982
1983
1984
GDP p r i c e index
131.1
144.7
162.1
181.6
204.3
2 225.1
2 4 1 . I3
Average r e c e i p t s
Commerce ( iri2)
114.6
125.0
173.5
227.9
280.7
310.0
'
Industry
( i3, i4, i5)
142.5
156.7
238.8
325.0
395.1
436.6
'
h
107.8117.2
163.9
194.0
253.0
279.4
3 0 4 . 3
VAI
h
106.4117.6
169.2
201.6
268.7
298.0
326.5
exclusive p r i
h-l
120.9
120.9
1 7 0 . 3
2 0 4 . 5
2 6 8 . 3
2 9 3 . 3
313.7
v
2
123.0123.0
188.9
227.1
298.8
326.6
349.6
ce - P a r i s
V i
126.4
126.4
2 0 8 . 3
252.1
334.6
365.8
392.6
v
2
127.0127.0
2 1 0 . 5
255.0
339.4
370.9
398.6
h
128.7128.7
2 2 4 . 5
272.0
362.5
396.2
426.0
VAT exclusive. Provisional. Estimated.
FRANCE
Since 1979 the price of gas has grown by more than the price of all goods and services as measured by the GDP price index which means that gas prices have increased in real terms.
Since 1979 the average receipts have increased a little faster than the selling price of gas for the following reasons:
(i) slight decrease in individual average consumption;
(ii) reduction in tariff degression;
(iii) regional adjustment of prices;
(iv) the influence of interruptible contracts.
3. ITALY
(a) Situation in the gas industry
The structure of the gas industry, which has a considerable influence on price forma tion, has two levels:
(i) SNAM, a company of the ENI group, which has a virtual monopoly (about 98%) on the transport and wholesale distribution of natural gas. In particular, SNAM supplies
3
gas to industries consuming over 500 000 m a year (i.e. approximately 19 000 GJ/year) and to the distribution companies.
(ii) The gas distributors, whose function is to distribute gas to small consumers. They receive natural gas from SNAM and resell it either as it is or after treatment. These distributors are either municipal undertakings, concessionary or local au thorities.
SNAM applies a standard national tariff (I„,I „ ,I,_), which is negotiated between SNAM 3 4 5
and the industrial association Cofindustria. 2
On the other hand each distributor issues its own tariffs according to a method in troduced by the Interministerial Price Committee (CIP).
The following table gives the pattern of gas sales (1982 figures):
SNAM
i.e.
Sales
i.e.
direct sales
r
1
via
c
Í
industries power stations chemical synthesis motor fuel
distributors
small domestic consumers individual central collective heating non domestic users
heating
%
57 38. 10. 7 1 43 10 17 8 8
5 5
100
Standard consumers
V V ^
DX,D2
ιί·ΐ
2Exceptionally, one or two large industrial consumers may be supplied by local distri bution companies and SNAM may also supply industrial consumers whose consumption is lower than the limit stated.
ITALY
At the end of 1983 the number of consumers was broken down as follows:
Supplied by SNAM
Supplied via distributors
industry power stations chemical synthesis other
distribution companies
small domestic consumers individual central heati others
Total
ng
Total 4 3
8 3
1 4 920 400 280 600
025 17 21 325 463 851 000 000 000 000
Collective heating, handicraft, small industry and the tertiary sector.
Furthermore collective central heating serves 1 million families.
Natural gas dominates the market either in its natural state or used as a raw material for manufactured gas.
In the cities chosen for this study the nature of supplies by the distribution companies was as follows:
Milan - gas manufactured from natural gas and petroleum products (730 000 consumers);
Turin - natural gas resold intact (570 000 consumers);
Genoa - natural gas resold intact ;
Rome - three-quarters of the urban area supplied with natural gas (580 000 consumers), one quarter supplied with gas manufactures from natural gas;
Naples - natural gas mixed with air.
These five cities account for over one third of the population supplied by the gas distribution network in Italy.
The sources of natural gas are as follows:
National production Imports from:
Netherlands USSR
Libya Algeria
1978
47.5
22.5 21
9
-1980
47
24 24 5
-1981
50
23 27
-1982
48
19 33 0
-1983
45
1 ΤΛΙ,Υ
(b) Taxe:
In I t a l y t h e r a t e of value-added tax (VAT) on gas s a l e s depends on t h e type of consumer, domestic or non-domestic.
The r a t e s have evolved a s f o l l o w s :
% of p r i c e b e f o r e VAT Periods
1.12.1977 - 31.12.1980 1. 1.1981 - 30. 9.1982
since 1.10.1982 Domestic
6 8 8
Non-domestic
14 15 . 18
Also s i n c e February 1977 s a l e s of n a t u r a l gas t o household consumers have been s u b j e c t t o a consumption t a x (imposta consumo) t h e r a t e s of which were a s f o l l o w s :
u n t i l August 1979 = LIT 30.00 p e r m"
September 1979 - February 1980 = LIT 36.50 p e r m"
from March 1980 LIT 30.00 per πΓ
3 .
For natural gas sold intact LIT 30 m is equal to approximately LIT 788 per GJ GCV.
This tax is also appplied to manufactured gas by reference to the percentage of natural gas used in its manufacture. The rate therefor.e differs according to the composition of the gas. Two examples are found in this study:
1980 1981 1982 1983 1984
Milan
LIT/m3
14.50 12.17 12.31 12.54 12.58
LIT/GJ
702.8 589.8 596.6 607.8 609.7
Rome
LIT/m3
12.80 10.52 10.52 10.37 10.61
LIT/GJ
766 629 629 620 634
Since November 1980 (Law No 784) domestic consumers in the South of Italy ('Cassa per il Mezzogiorno' zone) are exempt from this tax. Such is the case of Naples.
ITALY
(c) Household prices - tariffs
The tariffs employed by the distribution companies follow the method introduced in 1975 by the Interministerial Price Committee (CIP), modified in 1980 and profoundly altered in July 1983 (for more detail see CIP Regulation No 17/1983 published in the Official Journal No 180, 2.7.1983). This method determines the method by which a 'standard cost' is calculated by each distribution company which fixes the level of the average receipts and on which tariffs should be based. The tariffs are obliged to contain a standing charge and a commodity rate.
In this regard the distribution companies may propose:
(i) a single tariff where the commodity rate is equal to the average receipt minus the standing charge;
(ii) several tariffs with one or more consumption blocks of varying price on condition that the receipts derived from these tariffs cover the 'standard cost'.
Furthermore the CIP decides the maximum standing charge: presently LIT 2 300 per month per consumer for small domestic consumers, LIT 170 per month per 'flame' for other users.
Before the 30 April of each year the distribution companies submit for approval to the authorities their calculation of the 'standard cost' and their proposals for the tariffs necessary to cover these costs.
Because of these legal obligations there is a proliferation of local tariffs, revised annually, for consumers of less than 38 000 GJ per year (D ,D ,D ,D ,1 ,1 ).
Three examples of the domestic tariffs applicable in 1984 are given hereunder for each type of gas distributed in Italy:
Turin (natural gas)
Standard consumers
W°3
D4
F l a m e s n
? 20
1 4 5
S t a n d i n g c h a r g e L I T / m o n t h
2 300
170 χ 1 4 5
1 m = 3 8 . 1 Commodity r a t e C o n s u m p t i o n b l o c k s
3 0 - 360 m / y e a r 361 - 1 800 m3/ y e a r
3 > 1 800 m / y e a r
ITALY
Naples (methane/air mixture)
1 m = 17.85 MJ (GCV)
S t a n d a r d c o n s u m e r s
V
D2
D3 D3 b D4
F l a m e s n ί> 20
30 50 300
S t a n d i n g c h a r g e L I T / m o n t h
2 300
170 χ 30 170 χ 50 170 χ 300
Commodity r a t e C o n s u m p t i o n b l o c k s
3 , 0 - 422 m / y e a r
3
y 422 m / y e a r 3 0 - 1 200 m / y e a r
3 χ 1 200 m / y e a r
-L I T / m3 316 312 2 9 5 239 239
Milan (gasworks gas)
1 m = 20.633 MJ (GCV)
S t a n d a r d c o n s u m e r s
D1 'D2
D3 'D3 b
D4
F l a m e s n
^ 20
50
100
S t a n d i n g c h a r g e L I T / m o n t h
2 300
170 χ 50
170 χ 100
Commodity r a t e C o n s u m p t i o n b l o c k s
3 0 - 240 m / y e a r
3 , > 240 m / y e a r
3 0 - 240 m / y e a r
3 ^> 240 m / y e a r
-L I T / m3 2 6 9 . 6 2 2 7 9 . 6 2 2 6 9 . 6 2 2 7 9 . 6 2 2 7 9 . 6 2
The amount of the standing charge is determined within legal limits according to the number of flames by each distribution company, following the cubic capacity of the nec essary meter.
Several examples of progressive tariffs are found, the object of which is to encourage energy saving.
(d) Household prices - analysis
The prices are shown in Tables 13 to 15 and on Graphs Nos 5 and 6, in the annex. As a result of survey difficulties several prices prices are missing for 1981 and 1982.
I TAL Y
(D and D ) . Since 1978 regional price differences have diminished. At that time the dearest city w a s two times more expensive than the cheapest.
Several factors are to blame for these prices ranges:
(i) varying 'standard costs' used by each company as a tariff basis; (ii) nature of the g a s (natural or manufactured);
(iii) taxation, with exemption of specific taxes in the south; (iv) structure of the clientele.
Gasworks g a s is more expensive than natural gas distributed intact. The most striking example is to be found in Rome where both gases are distributed. Here gasworks gas is 30 to 4 5 % dearer than natural gas according to the level of consumption. The structure of the clientele also influences regional price ranges. As the average annual consump-tion p e r user is lowered so the costs of distribuconsump-tion increase.
It is the north of the country that the lowest prices are found, for example natural gas in Turin and Genoa. Meanwhile the highest prices found are for gasworks gas in Rome and Naples (combination of low consumption p e r user and the supplementary cost of manufac-ture) . Milan gives an average position and it w a s for this reason that it w a s chosen for international comparison.
Because of a certain latitude in the way tariffs are based on standard costs one e n -counters various degressivity curves. In 1984, the reduction in unit price between D and D . w a s between 16 and 3 3 % according to city. N o trend can be found in the evolution of tariff degression between 1978 and 1984. Tariffs containing progressive price blocks are also found. This pecularity applies to space heating and explains why there is some-times a small range of unit price between the consumers D„,D„, and D,. It seems that two
o 3b 4
objectives, not always easy to reconcile are being followed: not to encourage energy-waste with low prices and to encourage the use of natural gas, particularly for heating by offering attractive prices.
1 TAL Y
natural gas for domestic uses is around LIT 12 000 per gigajoule, thus a little less than the price of heating gasoil, 1 5 % cheaper than paraffin oil (kerosene) and twice as cheap as LPG and electricity. If one adds the taxes, principally VAT, the range is greater disfavouring gasoil and paraffin. Natural gas currently finds itself in a very favourable position t o sell the increased availability imported from Algeria.
The large increases in the price of gas have followed those for other energy sources while maintaining a current advantage. To examine these increases in current prices one must look at the index of gas prices in the light of the implied gross domestic product
(GDP) price index. Two examples, for Milan and Rome give the following results:
1975 = 100
1978
1979
1980
1981
1982
1983
1984
GDP p r i c e index
160.0
185.4
223.7
264.7
310.9
3 5 6 . 02
3 9 5 . 22
S e l l
Di
201.6
207.6
258.6
311.6
333.8
504.5
557.9
ing p r i c e (
D2
196.8
203.2
257.4
320.6
344.1
490.7
539.8
i n c l . a l l t a x e s ) - Milan
D3
214.1
2 2 2 . 3
314.6
404.0
434.4
587.9
683.4
D3 b
216.2
224.4
319.9
409.3
440.1
593.1
675.9
D4
2 1 9 . 3
228.0
331.4
429.1
461.5
622.0
680.6
ITALY
1978
1979
1980
1981
1982
1 9 8 3
1984
GDP p r i c e i n d e x
1 6 0 . 0
1 8 5 . 4
2 2 3 . 7
2 6 4 . 7
3 1 0 . 9
3 5 6 . 02
3 9 5 . 23
S e l l i n g p r i c e
Di
2 1 5 . 2
1 9 1 . 4
2 8 7 . 4
4 9 9 . 7
5 3 2 . 0
7 5 4 . 5
8 5 1 . 1
D2
2 9 4 . 0
2 4 9 . 5
3 6 6 . 5
5