mechanism underlying glucocorticoid resistance in B lineage ALL and re-sensitization by
JNK inhibition
.
White Rose Research Online URL for this paper:
http://eprints.whiterose.ac.uk/146600/
Version: Published Version
Article:
Nicholson, L., Evans, C.A. orcid.org/0000-0003-4356-9216, Matheson, E. et al. (13 more
authors) (2015) Quantitative proteomic analysis reveals maturation as a mechanism
underlying glucocorticoid resistance in B lineage ALL and re-sensitization by JNK
inhibition. British Journal of Haematology, 171 (4). pp. 595-605. ISSN 0007-1048
https://doi.org/10.1111/bjh.13647
eprints@whiterose.ac.uk
https://eprints.whiterose.ac.uk/
Reuse
This article is distributed under the terms of the Creative Commons Attribution (CC BY) licence. This licence
allows you to distribute, remix, tweak, and build upon the work, even commercially, as long as you credit the
authors for the original work. More information and the full terms of the licence here:
https://creativecommons.org/licenses/
Takedown
If you consider content in White Rose Research Online to be in breach of UK law, please notify us by
Quantitative proteomic analysis reveals maturation as a
mechanism underlying glucocorticoid resistance in B lineage
ALL and re-sensitization by JNK inhibition
Lindsay Nicholson,1Caroline A. Evans,2 Elizabeth Matheson,1Lynne Minto,1 Christopher Keilty,1Maryna Sanichar,1 Marian Case,1Claire Schwab,1 Daniel Williamson,1Johannes Rainer,3 Christine J. Harrison,1Reinhard Kofler,3 Andrew G. Hall,1Christopher P. F. Redfern,1Anthony D. Whetton2and Julie A. E. Irving1
1Newcastle Cancer Centre at the Northern
Insti-tute for Cancer Research, Newcastle University, Newcastle upon Tyne,2Stem Cell and Leukaemia Proteomics Laboratory, School of Cancer and Enabling Sciences, Manchester Academic Health Science Centre, University of Manchester, Manchester, UK, and3Tyrolean Cancer Research
Institute, Innsbruck, Austria
Received 24 February 2015; accepted for publication 1 July 2015
Correspondence: Dr Julie Irving, Northern Institute for Cancer Research, Paul O’Gorman building, Framlington Place, Newcastle upon Tyne, Tyne and Wear NE2 4HH, UK. E-mail: j.a.e.irving@ncl.ac.uk
Summary
Glucocorticoid (GC) resistance is a continuing clinical problem in child-hood acute lymphoblastic leukaemia (ALL) but the underlying mechanisms remain unclear. A proteomic approach was used to compare profiles of the B-lineage ALL GC-sensitive cell line, PreB 697, and its GC-resistant sub-line, R3F9, pre- and post-dexamethasone exposure. PAX5, a transcription factor critical to B-cell development was differentially regulated in the PreB 697 compared to the R3F9 cell line in response to GC. PAX5 basal protein expression was less in R3F9 compared to its GC-sensitive parent and con-firmed to be lower in other GC-resistant sub-lines of Pre B 697 and was associated with a decreased expression of the PAX5 transcriptional target, CD19. Gene set enrichment analysis showed that increasing GC-resistance was associated with differentiation from preB-II to an immature B-lympho-cyte stage. GC-resistant sub-lines were shown to have higher levels of phosphorylated JNK compared to the parent line and JNK inhibition caused re-sensitization to GC. Exploiting this maturation may be key to overcoming GC resistance and targeting signalling pathways linked to the maturation state, such as JNK, may be a novel approach.
Keywords: iTRAQ proteomics, glucocorticoid resistance, childhood acute lymphoblastic leukaemia, B cell differentiation, JNK signalling.
Acute lymphoblastic leukaemia (ALL) is the most common cancer in children and is characterized by the clonal expan-sion of poorly differentiated lymphoid precursors within the bone marrow. The treatment of ALL is a highly complex protocol comprising several chemotherapeutic agents, of which glucocorticoids (GCs) are integral due to their ability to specifically induce apoptosis in immature lymphoid cells (Gaynon & Carrel, 1999). These effects are mediated by the glucocorticoid receptor (GR, encoded by NR3C1), a ligand-activated transcription factor belonging to the nuclear recep-tor superfamily. Once bound to ligand, the GR translocates to the nucleus where it mediates GC-induced cell death by transactivation or transrepression of target genes.
Although current chemotherapy protocols successfully cure most childhood ALL cases, treatment still fails approxi-mately 15% (Pui et al, 2012). This treatment failure can
often be attributed to the development of chemotherapy resistance and response to GCsin vitro andin vivo has been shown to be one of the most significant prognostic indicators of event outcome (Riehm et al, 1987; Reiter et al, 1994; Schrappe et al, 2000). GC-resistance is a well-documented feature of relapse, with leukaemic cells being up to 300-fold more resistant to GCin vitrocompared to those at diagnosis (Klumperet al, 1995; Kasperset al, 2005). Furthermore, leu-kaemic cells from high-risk groups, such as T-ALL, infant ALL and adult ALL, are more resistant to GCs in vitro
(Maung et al, 1995; Pieters et al, 1998). However, despite their important role of GC in all ALL treatment protocols, the mechanisms underlying GC resistance are poorly under-stood and remain a continuing clinical problem.
In mostin vitro cell line models of childhood ALL, such as Jurkat and CCRF-CEM, a common cause of GC-therapy
ª2015 The Authors.British Journal of Haematologypublished by John Wiley & Sons Ltd. British Journal of Haematology, 2015,171,595–605
This is an open access article under the terms of the Creative Commons Attribution License, which permits use, distribution and reproduction in any medium,
resistance is mutation/deletion of the NR3C1gene (encoding GR), causing impaired receptor function (Powerset al, 1993; Hala et al, 1996; Schmidt et al, 2006). However, acquired somatic mutations or deletions of theNR3C1rarely occur in primary samples and thus, cannot account for most cases of GC-insensitivity (Irving et al, 2005; Tissinget al, 2005; Kus-teret al, 2011). Therefore, this opens up the possibility that understanding the mechanisms underlying GC-resistance may allow its pharmacological reversal and improve out-come. Microarray analyses comparing gene expression pro-files of GC-sensitive ‘versus’ GC-resistant cell lines and primary ALL samples have yielded important, yet limited, information of the pathways leading to this drug insensitiv-ity. A review by Schmidtet al(2004) reported that although 900 different genes were identified as GC-regulated, only 70 genes were reproduced in more than one publication. This suggests that RNA-based methods may be limiting and there is growing evidence that levels of mRNA transcripts do not necessarily reflect protein amounts (Unwinet al, 2006).
Proteomic technologies are rapidly emerging as useful tools to gain insight into complex biological systems at the level of protein expression. One discovery proteomic approach uses isobaric Tags for Relative and Absolute Quan-tification (iTRAQ proteomics), coupled with two-dimen-sional liquid chromatography/tandem mass spectrometry (LC-LCMS/MS). The iTRAQ method relies on differentially labelling peptides from individual proteolytic digests by cova-lent binding of isobaric tags and allows identification and quantification of peptides in multiple samples in a single experiment (Unwinet al, 2005). Using this methodology, we compared a well-characterized GC-sensitive cell line, PreB 697, and a GC-resistant sub-clone (R3F9) in response to 24-h exposure to a p24-harmacologically-relevant dose of dexam-ethasone (01lmol/l). We have previously shown that both cell lines recapitulate several features of GC-resistant primary samples, including having two wild type NR3C1 alleles,
expressing equivalent levels of GR protein and undergoing GR nuclear translocation in response to Dex but with reduced induction of GR target genes in the resistant subline (Nicholsonet al, 2010). We report that the critical mediator of B-cell lineage commitment, PAX5, is differentially expressed between GC-sensitive and GC-resistant clones and is associated with maturation, JNK activation and that re-sensitization to GC can be achieved by JNK inhibition.
Materials and methods
Cell lines
The PreB lineage childhood ALL cell line PreB 697 (recently re-named EU-3 by the original author (Zhou et al, 2002) and also referred to as ‘697’ in cell line repositories) and its GC-resistant descendents, R3C3, R3G7, R3F9, R4C10 and R3D11, were created by continuous culture in 10 7mol/l dexamethasone for 3–4 weeks (Schmidtet al, 2006).
Dexam-ethasone GI50 values (i.e. the dexamethasone concentration
that results in 50% of maximal inhibition of cell prolifera-tion) at 96 h, as measured by MTS (3-(4,5-dimethylthiazol- 2-yl)-5-(3-carboxymethoxyphenyl)-2-(4-sulfophenyl)-2H-te-trazolium) assay, are 37 nmol/l (PreB 697), 86 nmol/l (R3C3), 132lmol/l (R3G7), 143 lmol/l (R4C10) and >10lmol/l (R3F9, R3D11). Other cell lines were obtained from European Collection of Cell Cultures (Salisbury, UK) or the American Tissue Culture Collection (Manassas, VA, USA) and all were cultured in RPMI 1640 medium (Invitro-gen, Paisley, UK) supplemented with 10% (v/v) foetal bovine serum (Invitrogen) at 37°C and 5% (v/v) carbon dioxide. All cell lines were routinely tested for mycoplasma contamina-tion using MycoAlert(Lonza, Basel, Switzerland).
Proteomics methods
Detailed proteomic methods are shown in the supplementary material.
Western blotting
Whole cell lysates were prepared using cell lysis buffer (50 mmol/l Tris-HCl, pH 75, 150 mmol/l NaCl, 1% Triton X-100, 05% Na-deoxycholate, 01% sodium dodecyl sul-phate) supplemented with protease inhibitor cocktail (Roche, West Sussex, UK). Antibodies to detect PAX5 (E-9) (Santa Cruz Biotechnology, Santa Cruz, CA, USA), a-Tubulin (Sigma-Aldrich), IRF4, phospho-SAPK/JNK (Thr183/ Tyr185), SAPK/JNK (all Cell Signaling Technology, Danvers, MA, USA) were used. Secondary antibodies used were horse-radish peroxidase conjugates of either rabbit or anti-mouse IgG (both Dako, Glostrup, Denmark). Quantification was carried out by imaging the enhanced chemiluminescence (ECL)-plus exposed polyvinylidene difluoride membranes using the Fuji LAS-3000 Luminescent Image Analyser System (Fujifilm, Tokyo, Japan) and analysing the intensity of the protein bands using an Automatic Image Data Analysis (AIDA) software image analysis program (Fujifilm). PAX5 basal protein levels in the cell lines were calculated by divid-ing the intensity of the PAX5 protein band by the intensity of the loading control, a-tubulin, band, thereby normalizing for any loading inaccuracies.
Real-time polymerase chain reaction (PCR)
Briefly, total RNA was extracted from cell pellets using the Qiagen RNeasy Mini kit (Qiagen, Crawley, UK) and cDNA synthesis was carried out using the Applied Biosystem High-Capacity cDNA Reverse Transcriptase kit according to the manufacturer’s instructions. Primers and probes for PAX5
(Hs00277134_m1) and TATA-binding protein (TBP) were purchased from Assays-On-Demand (Applied Biosystems, Warrington, UK). Samples were assayed in duplicate on three independent occasions with the ABI 7500 Fast Real-Time
PCR System (Applied Biosystems) using the TaqMan uni-versal PCR MasterMix (Applied Biosystems). To quantify mRNA levels the 2 DCT or 2 DDCT method was used with TBPas the endogenous control, as indicated.
PAX5copy number analysis with quantitative genomic PCR
This assay was performed as described in An et al (2008) with ATP10A as the control gene. Briefly, 5-point standard curves ranging from 150 ng to 1 ng/reaction were con-structed using normal human genomic DNA and amplified for the 3 targetPAX5exons (exons 3, 6, and 8) and control
ATP10gene. Assays were performed in duplicate with 50 ng of genomic DNA from each cell line per 20ll reaction, using an ABI 7500 Fast Real-Time PCR System (Applied Biosys-tems). PAX5 gene dosage for each exon was calculated by dividing the value obtained for PAX5 by the corresponding value forATP10A.
Mutational screening
PAX5exons 2-10 were mutationally screened by direct DNA sequencing. Briefly, genomic DNA was extracted from cell lines using the Qiagen Mini kit (Qiagen) and amplified by PCR. Primer sequences and annealing temperatures are shown in Table SI. DNA sequencing was performed by puri-fying 100ll of PCR product using a QIAquick PCR Purifica-tion kit (Qiagen) with a final eluPurifica-tion volume of 30ll and then sequenced using both forward and reverse primers with the ABI Version 3 BigDye Terminator Cycle Sequencing kit and analysed on an ABI Prism DNA sequencer (Applied Biosystems).
Multiplex ligation-dependent probe amplification (MLPA)
Cell line DNA was analysed using the SALSA MLPA kit P335-A2 (MRC Holland, Amsterdam, Netherlands) as described previously (Schwab et al, 2010). Relative copy number was obtained after normalization of peaks against known normal control samples extracted by the same method. Values between 075 and 13 were considered to be within the normal range. Values below 075 or above 13 indicated loss or gain, respectively. A value below 025 indicated biallelic loss. These values correspond to copy numbers of 1, 3+ or 0, respectively, with 2 being the nor-mal copy number.
In vitrodrug sensitivity
Cells were plated out in triplicate at 29105cells/ml into
96-well plates and treated with dexamethasone to a range of final concentrations, as indicated, either alone, or in combi-nation with 5lmol/l JNK inhibitor, SP600125 (Selleckchem,
distributed via Stratech Scientific Ltd, Suffolk, UK) or 2 -5 nmol/l Bortezomib (Selleckchem). Following a 96-h drug exposure, cytotoxicity was assessed using the CellTiter 96 Aqueous One kit (Promega, Southampton, UK), also known as MTS assay, which assesses the capacity of cells to reduce formazan and thus is a measure of metabolically active cells. The resulting absorbances were averaged and expressed as a percentage of the control vehicle. Survival curves were plot-ted using GraphPad Prism software (GraphPad software Inc., San Diego, CA, USA). Drug interactions were assessed using the Chou-Talalay method, which is based on the median effect equation (Chou & Talalay, 1984).
Flow cytometry
Cell surface CD antigen expression: Cells were stained with directly conjugated antibodies to CD19-allophycocyanin (APC) and CD10-phycoerythrin (PE) or the corresponding isotype control. Ten thousand events for each sample were acquired using a FACSCalibur flow cytometer (BD Bio-sciences, Oxford, UK) and analysed using CellQuest software (BD Biosciences) on three independent occasions.
Annexin V assays for apoptosis. Cells were stained with Annexin V (Abcam, Cambridge, UK) and evaluated for apoptosis by flow cytometry following the manufacturer’s protocol. Ten thousand events for each sample were acquired using a FACSCalibur flow cytometer (BD Biosciences) and analysed using CellQuest software (BD Biosciences).
Exon array and gene set enrichment analysis (GSEA)
Total RNA was harvested and extracted using the Qiagen RNeasy Mini kit according to the manufacturer’s intructions and subjected to expression profiling using Affymetrix Human Exon 1.0 ST GeneChips (Affymetrix, Santa Clara, CA, USA). Exon microarray hybridization and pre-processing was carried out as previously described (Rainer et al, 2012). Raw and pre-processed microarray data has been deposited in Gene Expression Omnibus, accession number GSE63335. GSEA was performed using the standalone application (Broad Institute, Cambridge, MA, USA) and MSIGDB library C2.v3.1 (http:// www.broadinstitute.org/gsea/msigdb/index.jsp). Genes were pre-ranked according to their Pearson correlation with 50% inhibitory concentration (IC50) values for individual PreB 697
cell lines.
Statistical analysis
Graph plotting and statistical analyses were performed using GraphPad Prism version 4 (GraphPad software Inc.). Each experiment was repeated at least three times, unless indi-cated. TheP values were calculated using a two-tailed paired Student’st test or two-way ANOVA where appropriate. Sta-tistical significance was defined as aPvalue≤005.
Results
iTRAQ quantitative analysis identifies differences in PAX5 protein levels between GC-sensitive PreB 697 cell line and GC-resistant R3F9 cell line in response to 24-h Dexamethasone exposure
To identify differentially expressed, low abundance, nuclear proteins related to GC-resistance, nuclear lysates from untreated and dexamethasone-treated (DEX) or ethanol con-trol vehicle (CV) were prepared from PreB 697 and R3F9 cells. Lysates were labelled with a distinct isobaric tag for relative quantification and analysed by two dimensional liquid chromatography/tandem mass spectrometry (PreB 697+CV=114 isobaric tag, PreB 697+DEX=115, R3F9+CV=116 and R3F9+DEX=117). In total, 811 unique proteins were identified at greater than 95% confi-dence, most of which did not show any differential expres-sion between samples (Tables SII and SIII).
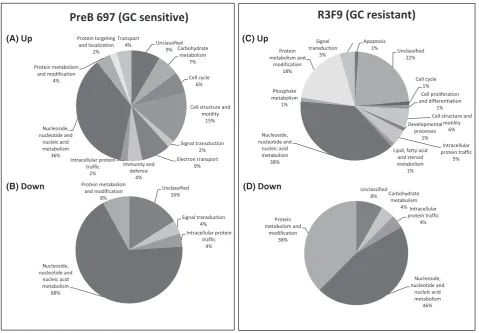
Ratios were calculated for dexamethasone-treated ‘versus’ control vehicle for each cell line. Data mining of the Excel
spreadsheets (see Tables SIIA, B and SIIIA, B) identified a number of proteins differentially expressed between cell lines and treated ‘versus’ control. Figure 1A-D shows the expres-sion of proteins involved in different cellular processes that were either up- or down-regulated after dexamethasone-treatment in the PreB 697 (Fig 1A and B, respectively) and R3F9 (Fig 1C and D, respectively). Unsurprisingly, given the use of nuclear lysates, the biological function that showed the biggest protein change in each comparison was nucle-oside, nucleotide and nucleic acid metabolism. Within this group, the top 2 proteins found to be differentially upregu-lated in the GC-sensitive parental cell line compared to the resistant sub-line was SMAD4 (P =0001) and PAX5 (P =002). For PAX5, a single peptide (amino acid sequence: ANLASPTADIGSSVPGPQSYPIVTGR) was identified in all four samples (697 Dex: 697 CV, iTRAQ ratio of 181,
P =002, compared to 090, P=014, for R3F9, Figure S1 and Table SIV). A second B cell transcription factor, IRF4, based on two peptide sequences (LFDTQQFLSELQA-FAHHGR and LITAHVEPLLAR) was also identified to be differentially unregulated in the GC-sensitive cell line, but
PreB 697 (GC sensitive)
R3F9 (GC resistant)
Unclassified 8% Carbohydrate
metabolism 4% Intracellular
protein traffic 4%
Nucleoside, nucleotide and
nucleic acid metabolism
46% Protein
metabolism and modification
38%
Apoptosis
1% Unclassified 22%
Cell cycle 1% Cell proliferation and differentiation
1% Cell structure and
motility 6% Developmental
processes 1%
Intracellular protein traffic
5% Lipid, fatty acid
and steroid metabolism
1% Nucleoside,
nucleotide and nucleic acid metabolism
38% Phosphate metabolism
1% Protein metabolism and
modification 18%
Signal transduction
5% Unclassified
9% Carbohydrate metabolism
7%
Cell cycle 6%
Cell structure and motility
15%
Signal transduction 2% Electron transport
9% Intracellular protein
traffic 2% Nucleoside, nucleotide and
nucleic acid metabolism
36% Protein metabolism
and modification 4%
Protein targeting and localization
2%
Transport 4%
Unclassified 16%
Signal transduction 4% Intracellular protein
traffic 4%
Nucleoside, nucleotide and
nucleic acid metabolism
68%
Protein metabolism and modification
8%
Immunity and defence
4%
(A) Up
(B) Down
(C) Up
(D) Down
Fig 1. Protein changes in PreB 697 and R3F9 cells in response to dexamethasone treatment. Proteins that showed significant changes (Up and Down) in expression levels in response to 24 h 01lmol/l dexamethasone-treatment in PreB 697 (A, B) and R3F9 (C, D) cells, classed according to biological function by entering their protein identification numbers into the PANTHER (Protein Analysis Through Evolutionary Relationships) classification system.
[image:5.595.70.550.354.687.2]did not achieve statistical significance (697 Dex: 697 CV, iTRAQ ratio of 139, P=019), while the IRF4 levels in the treated R3F9 cell line remained unchanged (Dex: R3F9 CV, iTRAQ ratio of 102,P=084). This differential upregulation of IRF4 and PAX5 in response to GC in the sensitive com-pared to the resistant line was verified by Western blot (Fig 2 and Figure S2). Conversely, for SMAD4, differential upregu-lation could not be confirmed by Western analyses (data not shown).
Parallel real-time quantitative reverse transcription PCR (RQ-PCR) and Western blotting analyses showed that PreB 697 cells significantly upregulated PAX5 in response to dex-amethasone, both at the mRNA (P=0016, 0 vs. 24 h by Student’s t-test) and protein level at 24 h, while R3F9 cell line failed to upregulate PAX5 significantly at either the mRNA (P=0299) or protein level (Fig 2A). Importantly, it was noted that R3F9 had a reduced PAX5 protein expression at a basal, untreated level, in comparison to its GC-sensitive parental cell line. Other GC-resistant sub lines derived from PreB 697 previously characterized for GC sensitivity and GR status (Nicholson et al, 2010) including R3C3, R3G7, R3F9 and R4C10, (GI50range 861 nmol/l to>10lmol/l; GR wild
type; normal GR levels) also showed reduced basal and induced PAX5 levels, relative to the GC-sensitive parent (Fig 2B and Figure S3). An exception was R3D11 (GI50>10lmol/l; GR wild type) but this cell line, as we
have previously shown, is GR deficient (Nicholson et al, 2010). These data suggest that the B cell transcription factors,
PAX5 and IRF4, are transcriptional targets of GR and that lower PAX5 basal protein expression is associated with a GC-resistant phenotype.
Lower PAX5 protein levels in GC-resistant sub-clones is a post-transcriptional effect that has functional
consequences
Recent studies have shown that PAX5 inactivation, most commonly due to deletion or point mutation, is a frequent occurrence in B-progenitor cases of ALL and results in a cor-responding loss or disruption of the PAX5 protein (Mul-lighanet al, 2007). Thus, to investigate likely mechanisms for decreased expression of PAX5 protein in the GC-resistant sub-lines, RQ-PCR for gene copy number and mutational screening of all coding exons was performed in PreB 697 and its GC-resistant derivatives. There was no evidence for decreased allele copy number in the resistant lines (exon 3,
P=≥0232; exon 6, P=≥0468; exon 8, P =≥0242) (Fig 3A, B and C, respectively) and mutational screening found no evidence for acquired mutations in the resistant lines. The identification of a common single nucleotide poly-morphism (rs2297105) in exon 2, found to be heterozygous in all lines, is further evidence that GC-resistant sub lines, like the parent line, have two intact wild type PAX5 alleles and MLPA also detected a normal copy number for PAX5
along with IKZF1, CDKN2A/B, ETV6, BTG1, RB1 and the PAR1 region in all 6 cell lines. EBF1 showed gain (3-5
(A) (B)
P
A
X5 protein lev
e
ls
(P
A
X
5:
α
-tub
ul
in)
PAX5
mRNA
(normal
iz
e
d to
TB
P
)
0 750
250 500
0 H CV Dex CV Dex 0 H CV Dex CV Dex
6 24 6 24
Time (h)
R3F9
PreB 697 1·5
1·0
0·5
0·0
R3D 11 R3F9 R4C1
0 R3G
7 R3C
3
Pre B 6
97
CV Dex CV Dex
PreB 697 R3F9
PAX5
α-tubulin
PAX5
α-tubulin
PreB 697R3C3 R3G7 R3F9R4C 10
R3D11
Fig 2. GC-resistant sub-clones express lower PAX5 protein levels. (A) Differential induction ofPAX5mRNA and PAX5 protein in PreB 697 com-pared to R3F9 cells in response to 01lmol/l dexamethasone exposure. Cell lines were treated with either control vehicle (CV) or 01lmol/l dex-amethasone for 6 and 24 h before harvesting for protein and RNA. Upper panel: equal amounts of whole cell lysate extracted from cell pellets at the 24-h time point were subjected to Western blotting and probed with anti-PAX5 and anti-a-tubulin antibodies. The blot is representative of three independent experiments. Lower panel: Quantification ofPAX5mRNA expression by quantitative real-time PCR, levels were normalized to an endogenous control,TBP, by the 2 DCtmethod. The histogram shows meanSEM from at least three independent experiments. (B) GC-re-sistant sub-clones express lower PAX5 protein levels. Upper panel: Protein was extracted from each of the indicated cell lines and equal amounts of whole cell lysate were subjected to Western blotting and probed with anti-PAX5 and anti-a-tubulin antibodies. Lower panel: Densitometry was performed to determine the expression of PAX5 protein in each of the cell lines. This was calculated by dividing the intensity of the PAX5 band over that of the loading control,a-tubulin. The histogram shows meanSEM from three independent experiments.
copies) in exons 10, 14, and 16 but showed a normal copy number for exon 1 for all 6 cell lines (Figure S4).
RQ-RT-PCR ofPAX5showed that mRNA levels were sim-ilar in all cell lines (p= >02251) (Fig 3D), suggesting that the reduced PAX5 protein level in GC-resistant sub-lines is post-transcriptional. Protein stability experiments showed no apparent difference in the half-life of the PAX5 protein in GC-sensitive compared to GC-resistant cell lines (Figure S5). To assess the functional consequences of lower PAX5 protein levels, the principal transcriptional target of PAX5, CD19, was assessed by flow cytometry (Fig 3E). As expected, the parental cell line, PreB 697, had the highest level of CD19 expression, with lower levels in 3 out of the 4 GC-resistant sub-lines, which was statistically significant for R3F9 and R3C3 (P =0023 and 0007, respectively) but not for R3G7 (P=0219). Again, the GR-deficient RD11 cell line with nor-mal levels of PAX5 had similar CD19 levels to the GC-sensi-tive parent.
GC resistance is associated with increased B-cell maturity in the PreB 697 cell line model
As PAX5 is integral to B-cell commitment and differentia-tion, we investigated whether the reduced levels of PAX5 are
a reflection of an altered maturation state by using gene expression arrays. GSEA was used to analyse the state of dif-ferentiation of GC-resistant sub-lines and genes were ranked according to the correlation of gene expression with dexam-ethasone IC50 values for the individual sub-lines. A set of
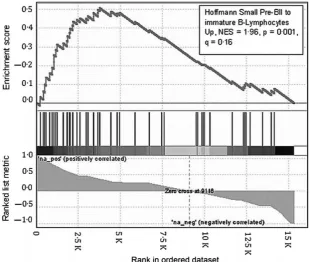
genes whose expression describes the transition from a preB-II differentiation state to immature B-lymphocytes, was sig-nificantly enriched in the GC-resistant sub-lines; Normalized Enrichment Score =196, P =0001, q=016 (Fig 4).(Hoff-mann et al, 2002) Thus increasing GC-resistance is coupled to a single step in B cell maturation and was further con-firmed by additional immunophenotyping that demonstrated a significant decrease in CD10 basal expression in 3 of 4 GC resistant sub lines (Figure S6; P <0005). All cell lines were found to be negative for CD20 expression, a mature B cell differentiation marker, and also the stem cell marker, CD34 (data not shown).
GC resistance is associated with JNK activation and inhibition re-sensitizes GC response
Given that activation of the JNK pathway has been associated with GC resistance (Milleret al, 2007; Garzaet al, 2009) and degradation of proteins (Leung et al, 2008), we assessed Calib.
DN A
PreB 697
R3C3 R3G7 R3F9R4C10 R3D11
2·5
2·0
2·5
1·0
0·5
0·0
Rati
o to
ATP10A
PAX5 Exon 3
R4C 10
R3D1 1 R3C3 R3G
7 R3F9 Cali
b. DN A
PreB 697
PAX5 Exon 6
2·5
2·0
2·5
1·0
0·5
0·0
Rati
o to
ATP10A
PAX5 Exon 8
2·5
2·0
2·5
1·0
0·5
0·0
Rati
o to
ATP10A
R4C 10
R3D 11 R3C
3
R3G7 R3F9 Cali
b. D NA
PreB 697
(A)
(D) (E)
(B) (C)
PreB 697
R3C3 R3G7 R3F9 R4C10 R3D11
PAX
5
mRN
A
exp
res
sion
(n
ormalized to
TB
P
)
0 200
100 500
300 400
CD19 expr
ession
(C
D19:i
s
oty
p
e control)
PreB 697 R3C
3
R3G7 R3F9 R4C10 R3D11
0 100
50 150 200
Fig 3. Lower PAX5 levels in GC-resistant sub-clones is post-transcriptional and functional. (A–C) Quantification ofPAX5 gene expression by
real-time genomic PCR to assess copy number loss. Levels ofPAX5exons 3, 6 and 8 were quantified and PCR results were expressed as a ratio of
PAX5/ATP10A.Ratios of less than 07 defined a deletion. (D) Quantification of basalPAX5 mRNA expression by quantitative real-time PCR. Levels were normalized to an endogenous control,TBP, by the 2 DCtmethod. The histogram shows mean
SEM from at least three indepen-dent experiments. (E) FACS analysis of CD19 expression in the GC-sensitive, PreB 697, and four GC-resistant ‘R’ clones. Data plotted are the mean fluorescence intensity (MFI) and is the ratio between the CD19 MFI and isotype control MFI. Error bars represent the SEM of triplicate experiments; statistical significance was assessed with a pairedttest*P<005,**P<0005.
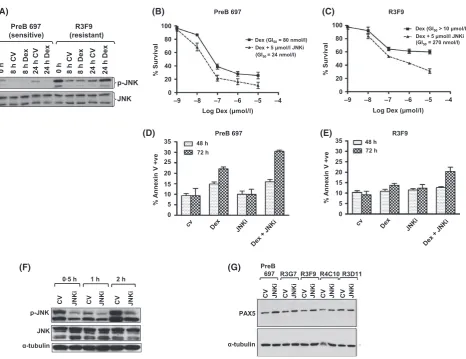
[image:7.595.70.545.77.348.2]levels of phosphorylated JNK (pJNK) both basally and in response to dexamethasone in PreB 697 and R3F9 cells. Basal levels of pJNK were significantly elevated in the GC-resistant cell line compared to the PreB 697 cells (Fig 5A) and GC reduced the low level pJNK in these sensitive but not resis-tant cells. Higher basal pJNK levels were also evident in the other GC-resistant cell lines (Figure S7). Using a non-toxic dose (5lmol/l, Figure S8) of the pan-specific JNK inhibitor, SP600125 in combination with dexamethasone, there was a 30-fold increase in GC sensitivity in R3F9 cells, with an IC50
of >10lmol/l lowering to 273 nmol/l (P<00001) and a modest sensitization was also seen in the sensitive parent line, 80–24 nmol/l (P <00001) (Fig 5B and C). The
combi-nation index in R3F9 was indicative of strong synergy and this sensitization was also seen in other GC resistant cell lines (Figure S9) and was associated with increased numbers of apoptotic cells, as measured by annexin V binding (Fig 5D and E) and JNK inhibition (Fig 5F). In addition, SP600125 alone increased levels of PAX5 in all cell lines (Fig 5G), sug-gesting a link between JNK activation, PAX5 levels, matura-tion and GC resistance. The proteasome inhibitor, Bortezomib was not able to mirror these effects (Figure S10). As JNK activation has also been associated with GC resis-tance in T ALL, (Milleret al, 2007) we explored GC sensitiza-tion by JNK inhibisensitiza-tion in a panel of T ALL lines and found significant sensitization in all four cell lines (Figure S11).
Discussion
This is the first study to couple a discovery proteomic/mass spectrometry approach with a GC-resistant ALL model
sys-tem. It has identified differential expression of PAX5, both basally and in response to GC, in a GC-sensitive compared to GC-resistant sub-line. Importantly, this finding was subse-quently confirmed in additional GC-resistant sub-lines. The PAX family of transcription factors have a DNA-binding paired-box and homeobox domain and act as crucial regula-tors of tissue development, cell proliferation, migration and survival. PAX5 is the only member to be expressed within the haematopoietic system and is indispensable in the com-mitment of early lymphoid progenitors to the B-cell lineage and maintenance of B-cell identity (Cobaleda et al, 2007; Nutt & Kee, 2007). Its role as a tumour suppressor in leukae-mogenesis has recently gained prominence in that PAX5
inactivation has been shown to be one of the most common genetic alterations in pre-B ALL and results in a reversible differentiation block (Mullighanet al, 2007, 2008, 2009; Neb-ralet al, 2009; Liuet al, 2014).
The lower basal PAX5 levels in GC-resistant lines, together with gene expression profiling and lowering CD19 and CD10 are indicative of increased B cell maturation that the sub lines have acquired to evade GC-induced apoptosis. The maturation state of a B cell has an inverse relationship with sensitivity to both synthetic and endogenous GCs, with early B-cell progenitors readily undergoing apoptosis compared to more mature B cells (Lill-Elghanianet al, 2002; Igarashiet al, 2005). Physiologically, this may serve to regulate steady-state lymphopoiesis (Lill-Elghanianet al, 2002), as well as control-ling positive selection in thymocytes to prevent autoreactive T-cells (Vacchio & Ashwell, 1997). Although our study focuses on cell lines and not primary cells, this phenomenon of GC-resistance maturation has been observed in clinical
Fig 4. GSEA reveals a more mature B-cell gene expression pattern in the GC-resistant clones. Plot showing significant enrichment in GC-re-sistant sub-clones of PreB 697 of a set of genes whose expression is upregulated during the transition from pre-BII to immature B-lym-phocytes. Vertical lines show the position in ranking of genes of individual genes in the gene set. NES, Normalized Enrichment Score.
[image:8.595.218.529.79.341.2]samples: Rhein et al(2007) showed that ALL cells persisting
in vivo after 8 d of GC-monotherapy had acquired a more mature B-cell phenotype and, in a study by Dworzak et al
(2008), CD20, a B cell differentiation antigen, was upregu-lated after prednisolone exposure in residual blasts in some patients. An important difference we show here is that the maturation was a subtle one-step progression from preB-II towards immature B-lymphocytes, but prior to upregulation of CD20. While we have investigated acquired GC resistance, it is also possible that maturation influences primary GC response as a study of gene expression profiling of leukaemia cells from children with a poor prednisolone responsein vivo
showed lower levels of genes important in B-cell develop-ment, prior to treatment. (Carioet al, 2008).
The increased maturation state in GC resistance sublines was associated with reduced PAX5 levels and enhanced JNK signalling. While little is known about the regulation of PAX5 protein levels, our data implicates the JNK pathway in modifying PAX5 protein levels and indeed other PAX family members have been shown to be substrates of JNK (Caiet al, 2003; Boutet et al, 2007). JNK inhibition significantly sensi-tized very resistant ALL cells to GC by 30-fold and reduced the GI50of these cells to clinically achievable dexamethasone
levels and at concentrations that clearly inhibited JNK sig-nalling. In T-ALL cells, JNK activation has also been shown to be associated with etoposide resistance through a mecha-nism that involved direct phosphorylation of Bim(EL) (also termed BCL2L11) by JNK, which triggered proteasomal
(C)
(D) (E)
48 h 72 h
% A
n
n
e
xi
n
V
+v
e
0 5 10 15 20 25 30 35
PreB 697
0 5 10 15 20 25 30 35
%
An
n
e
x
in
V +
ve
48 h 72 h
R3F9 0
20 40 60 80 100
% S
u
rv
iv
a
l
Dex (GI50> 10 μmol/l)
Dex + 5 μmol/l JNKi (GI50= 270 nmol/l)
Log Dex (μmol/l) R3F9 (B)
–9 –8 –7 –6 –5 –4 –9 –8 –7 –6 –5 –4
Log Dex (μmol/l) 0
20 40 60 80 100
% S
u
rv
iv
a
l Dex (GI50= 80 nmol/l)
Dex + 5 μmol/l JNKi (GI50= 24 nmol/l)
PreB 697
CV JNKi CV JNKi CV JNKi CV JNKi CV JNKi PreB
697 R3G7 R3F9 R4C10 R3D11
PAX5
α-tubulin (G)
α-tubulin p-JNK
JNK
CV JNKi CV CV
0·5 h 1 h 2 h
JNKi JNKi (F)
p-JNK
JNK
0 h 8 h 0 h
CV
8 h CV
8 h Dex 24 h CV 24 h Dex 8 h Dex 24 h CV 24 h Dex
PreB 697 (sensitive)
R3F9 (resistant)
(A)
Fig 5. JNK signalling is aberrant in GC-resistant clones and inhibition can re-sensitize. Western analyses of PreB 697 and R3F9 cells treated with Dexamethasone (Dex) or control vehicle (CV) (A). Protein was extracted from each of the indicated cell lines and equal amounts of whole cell lysate were probed using antibodies targeting phosphorylated JNK (p-JNK) and JNK. GC-sensitive (PreB697, B) and -resistant (R3F9, C) cells were cultured for 96 h with a range of dexamethasone concentrations (1 nm–10lmol/l) in the presence (broken line) or absence (solid line) of
5lmol/l JNK inhibitor SP600125 (JNKi). Error bars represent SEM forn=3 assays. PreB 697(D) and R3F9 (E) cells were treated with control vehicle, 100 nmol/l dexamethasone, 5lmol/l JNK inhibitor or a combination of Dex and JNK inhibitor for 48 or 72 h before measuring the level of apoptosis by Annexin V staining and flow cytometry. Values represent the meanSEM of a minimum of three independent experiments. R3F9 cell lines were treated with either control vehicle or 5lmol/l JNK inhibitor for the times shown and whole cell lysates were subjected to Western blotting and probed using antibodies targeting pJNK and JNK (F). All sublines were treated with either control vehicle or 5lmol/l JNK inhibitor and analysed by Western analyses for PAX5 expression, witha-tubulin serving as a loading control (G). GI50, drug concentration that
results in 50% of maximal inhibition of cell proliferation.
[image:9.595.77.544.74.433.2]degradation; JNK inhibitors were similarly able to re-sensitize to this drug (Leung et al, 2008). Thus, our observed GC-re-sensitization by JNK inhibition may be similarly mediated through direct phosphorylation of Bim, and may also co-sen-sitize to other chemotherapeutics agents. Miller et al (2007) also implicated JNK activation levels in determining GC response in T ALL cells, which we confirm. They showed the mechanism to involve modulation of GR transcriptional activity by JNK. Thus, JNK inhibition, or a key downstream JNK target, may allow GC sensitization in both B- and T-lin-eage ALL. Our data adds to the increasing evidence that MAPK pathways modulate GC response in ALL cells and, more recently, anisomycin, a protein synthesis inhibitor and p38 (also termed MAPK14) agonist, was shown to resensitize GC response via activation of both p38 and JNK (Miller
et al, 2007; Garzaet al, 2009; Liuet al, 2013).
In conclusion, we report the first study to use discovery proteomics to investigate GC-resistance in a childhood ALL cell line model and identify subtle single step maturation as a recurrent mechanism in a cell line model. Exploiting this maturation may be key to overcoming GC resistance and might involve antibody therapies, such as Rituximab, if CD20 is induced (Dworzaket al, 2008) or, as we show, tar-geting signalling pathways linked to the maturation state, such as JNK.
Acknowledgements
This work was supported by grants from Leukaemia and Lymphoma Research (London, United Kingdom) (ADW, JAEI, AH). We gratefully acknowledge Lee Lancashire for the preliminary analysis of the iTRAQ dataset.
Author contributions
J.A.E.I., C.P., F.R., A.W. and L.N. conceived and gained funding for the study. All authors performed research and analysed data. L.N. and J.A.E.I. drafted the article and all authors critically appraised and approved the final version.
Conflict of interest disclosure
The authors declare no competing financial interests.
Supporting Information
Additional Supporting Information may be found in the online version of this article:
Figure S1. Representative tandem mass spectrum for PAX-5 protein (peptide sequence:ANLASPTPA-DIGSSVPGPQSYPIVTGR). 932.8, triply charged ion. The inset shows the peak area at the low mass/charge (m/z) region with the iTRAQ reporter ions.
Figure S2.Differential induction of IRF4 protein in PreB 697 compared to R3F9 cell lines in response to dexametha-sone exposure.
Figure S3. Reduced induction of PAX5 in GC-resistant sublines.
Figure S4. MLPA result for the R3C3 cell line using the MRC Holland P335-IKZF1 ALL kit.
Figure S5. PAX5 protein stability in GC sensitive and resistant sublines.
Figure S6.CD10 expression is lower in GC resistant sub lines.
Figure S7.Phospho-JNK levels are higher basally in GC-resistance sub lines.
Figure S8.Determining a non-toxic dose of JNKi. Figure S9. JNK inhibition significantly sensitises to dex-amethasone in PreB 697 GC resistant sublines lines and is synergistic.
Figure S10. Bortezomib does not mimic JNKi in GC resensitisation.
Figure S11.JNK inhibition significantly sensitises to dex-amethasone in T-ALL cell lines.
Table SI.PAX5 Primer sequences.
Table SII. (A) List of differentially up-regulated proteins in PreB 697 in response to 24 h dexamethasone exposure as quantified in iTRAQ experiment. (B) List of differentially down-regulated proteins in PreB 697 in response to 24 h dexamethasone exposure as quantified in iTRAQ experiment. Table SIII.(A) List of differentially up-regulated proteins in R3F9 in response to 24 h dexamethasone exposure as quantified in iTRAQ experiment. (B) List of differentially down-regulated proteins in R3F9 in response to 24 h dexam-ethasone exposure as quantified in iTRAQ experiment.
Table SIV.PAX5 protein identification based on a single peptide.
References
An, Q., Wright, S.L., Konn, Z.J., Matheson, E., Minto, L., Moorman, A.V., Parker, H., Grif-fiths, M., Ross, F.M., Davies, T., Hall, A.G., Harrison, C.J., Irving, J.A. & Strefford, J.C. (2008) Variable breakpoints target PAX5 in patients with dicentric chromosomes: a model for the basis of unbalanced translocations in cancer.Proceedings of the National Academy of Sciences of the United States of America,105, 17050–17054.
Boutet, S.C., Disatnik, M.H., Chan, L.S., Iori, K. & Rando, T.A. (2007) Regulation of Pax3 by pro-teasomal degradation of monoubiquitinated protein in skeletal muscle progenitors.Cell,130, 349–362.
Cai, Y., Brophy, P.D., Levitan, I., Stifani, S. & Dressler, G.R. (2003) Groucho suppresses Pax2 transactivation by inhibition of JNK-mediated phosphorylation.EMBO Journal,22, 5522–5529.
Cario, G., Fetz, A., Bretscher, C., Moricke, A., Schrauder, A., Stanulla, M. & Schrappe, M. (2008) Initial leukemic gene expression profiles
of patients with poor in vivo prednisone response are similar to those of blasts persisting under prednisone treatment in childhood acute lymphoblastic leukemia. Annals of Hematology, 87, 709–716.
Chou, T.C. & Talalay, P. (1984) Quantitative analysis of dose-effect relationships: the com-bined effects of multiple drugs or enzyme inhibitors. Advances in Enzyme Regulation,22, 27–55.
Cobaleda, C., Schebesta, A., Delogu, A. & Bus-slinger, M. (2007) Pax5: the guardian of B cell
identity and function. Nature Immunology, 8, 463–470.
Dworzak, M.N., Schumich, A., Printz, D., Potsch-ger, U., Husak, Z., Attarbaschi, A., Basso, G., Gaipa, G., Ratei, R., Mann, G. & Gadner, H. (2008) CD20 up-regulation in pediatric B-cell precursor acute lymphoblastic leukemia during induction treatment: setting the stage for anti-CD20 directed immunotherapy. Blood, 112, 3982–3988.
Garza, A.S., Miller, A.L., Johnson, B.H. & Thomp-son, E.B. (2009) Converting cell lines represent-ing hematological malignancies from glucocorticoid-resistant to glucocorticoid-sensi-tive: signaling pathway interactions. Leukemia Research,33, 717–727.
Gaynon, P.S. & Carrel, A.L. (1999) Glucocorticos-teroid therapy in childhood acute lymphoblastic leukemia. Advances in Experimental Medicine and Biology,457, 593–605.
Hala, M., Hartmann, B.L., Bock, G., Geley, S. & Kofler, R. (1996) Glucocorticoid-receptor-gene defects and resistance to glucocorticoid-induced apoptosis in human leukemic cell lines. Interna-tional Journal of Cancer,68, 663–668.
Hoffmann, R., Seidl, T., Neeb, M., Rolink, A. & Melchers, F. (2002) Changes in gene expression profiles in developing B cells of murine bone marrow.Genome Research,12, 98–111.
Igarashi, H., Medina, K.L., Yokota, T., Rossi, M.I., Sakaguchi, N., Comp, P.C. & Kincade, P.W. (2005) Early lymphoid progenitors in mouse and man are highly sensitive to glucocorticoids.
International Immunology,17, 501–511.
Irving, J.A., Minto, L., Bailey, S. & Hall, A.G. (2005) Loss of heterozygosity and somatic muta-tions of the glucocorticoid receptor gene are rarely found at relapse in pediatric acute lym-phoblastic leukemia but may occur in a subpop-ulation early in the disease course. Cancer Research,65, 9712–9718.
Kaspers, G.J., Wijnands, J.J., Hartmann, R., Huis-mans, L., Loonen, A.H., Stackelberg, A., Henze, G., Pieters, R., Hahlen, K., Van Wering, E.R. & Veerman, A.J. (2005) Immunophenotypic cell lineage andin vitrocellular drug resistance in childhood relapsed acute lymphoblastic leukae-mia.European Journal of Cancer,41, 1300–1303.
Klumper, E., Pieters, R., Veerman, A., Huismans, D., Loonen, A., Hahlen, K., Kaspers, G., van Wering, E., Hartmann, R. & Henze, G. (1995)
In vitrocellular drug resistance in children with relapsed/refractory acute lymphoblastic leuke-mia.Blood,86, 3861–3868.
Kuster, L., Grausenburger, R., Fuka, G., Kaindl, U., Krapf, G., Inthal, A., Mann, G., Kauer, M., Rainer, J., Kofler, R., Hall, A., Metzler, M., Meyer, L.H., Meyer, C., Harbott, J., Marschalek, R., Strehl, S., Haas, O.A. & Panzer-Grumayer, R. (2011) ETV6/RUNX1-positive relapses evolve from an ancestral clone and frequently acquire deletions of genes implicated in glucocorticoid signaling.Blood,117, 2658–2667.
Leung, K.T., Li, K.K., Sun, S.S., Chan, P.K., Ooi, V.E. & Chiu, L.C. (2008) Activation of the JNK
pathway promotes phosphorylation and degra-dation of BimEL–a novel mechanism of
chemoresistance in T-cell acute lymphoblastic leukemia.Carcinogenesis,29, 544–551.
Lill-Elghanian, D., Schwartz, K., King, L. & Fraker, P. (2002) Glucocorticoid-induced apoptosis in early B cells from human bone marrow. Experi-mental Biology and Medicine,227, 763–770.
Liu, Y., Ge, J., Li, Q., Gu, L., Guo, X., Ma, Z.G. & Zhu, Y.P. (2013) Anisomycin induces apoptosis of glucocorticoid resistant acute lymphoblastic leukemia CEM-C1 cells via activation of mito-gen-activated protein kinases p38 and JNK. Neo-plasma,60, 101–110.
Liu, G.J., Cimmino, L., Jude, J.G., Hu, Y., Wit-kowski, M.T., McKenzie, M.D., Kartal-Kaess, M., Best, S.A., Tuohey, L., Liao, Y., Shi, W., Mullighan, C.G., Farrar, M.A., Nutt, S.L., Smyth, G.K., Zuber, J. & Dickins, R.A. (2014) Pax5 loss imposes a reversible differentiation block in B-progenitor acute lymphoblastic leu-kemia.Genes & Development,28, 1337–1350.
Maung, Z., Reid, M., Matheson, E., Taylor, P., Procter, S. & Hall, A. (1995) Corticosteroid resistance is increased in lymphoblasts from adults compared with children: preliminary results ofin vitrodrug sensitivity study in adults with acute lymphoblastic leukaemia. British Journal of Haematology,91, 93–100.
Miller, A.L., Garza, A.S., Johnson, B.H. & Thomp-son, E.B. (2007) Pathway interactions between MAPKs, mTOR, PKA, and the glucocorticoid receptor in lymphoid cells.Cancer Cell Interna-tional,7, 3.
Mullighan, C.G., Goorha, S., Radtke, I., Miller, C.B., Coustan-Smith, E., Dalton, J.D., Girtman, K., Mathew, S., Ma, J., Pounds, S.B., Su, X., Pui, C.H., Relling, M.V., Evans, W.E., Shurtleff, S.A. & Downing, J.R. (2007) Genome-wide analysis of genetic alterations in acute lymphoblastic leu-kaemia.Nature,446, 758–764.
Mullighan, C.G., Phillips, L.A., Su, X., Ma, J., Miller, C.B., Shurtleff, S.A. & Downing, J.R. (2008) Genomic analysis of the clonal origins of relapsed acute lymphoblastic leukemia. Science, 322, 1377–1380.
Mullighan, C.G., Su, X., Zhang, J., Radtke, I., Phil-lips, L.A., Miller, C.B., Ma, J., Liu, W., Cheng, C., Schulman, B.A., Harvey, R.C., Chen, I.M., Clifford, R.J., Carroll, W.L., Reaman, G., Bow-man, W.P., Devidas, M., Gerhard, D.S., Yang, W., Relling, M.V., Shurtleff, S.A., Campana, D., Borowitz, M.J., Pui, C.H., Smith, M., Hunger, S.P., Willman, C.L., Downing, J.R. & Children’s Oncology Group (2009) Deletion of IKZF1 and prognosis in acute lymphoblastic leukemia.New England Journal of Medicine,360, 470–480.
Nebral, K., Denk, D., Attarbaschi, A., Konig, M., Mann, G., Haas, O.A. & Strehl, S. (2009) Inci-dence and diversity of PAX5 fusion genes in childhood acute lymphoblastic leukemia. Leuke-mia,23, 134–143.
Nicholson, L., Hall, A.G., Redfern, C.P. & Irving, J. (2010) NFkappaB modulators in a model of glucocorticoid resistant, childhood acute
lym-phoblastic leukemia. Leukemia Research, 34, 1366–1373.
Nutt, S.L. & Kee, B.L. (2007) The transcriptional regulation of B cell lineage commitment. Immu-nity,26, 715–725.
Pieters, R., den Boer, M.L., Durian, M., Janka, G., Schmiegelow, K., Kaspers, G.J., van Wering, E.R. & Veerman, A.J. (1998) Relation between age, immunophenotype andin vitro drug resistance in 395 children with acute lymphoblastic leukemia–implications for treatment of infants. Leukemia,12, 1344–1348.
Powers, J.H., Hillmann, A.G., Tang, D.C. & Har-mon, J.M. (1993) Cloning and expression of mutant glucocorticoid receptors from glucocor-ticoid-sensitive and -resistant human leukemic cells.Cancer Research,53, 4059–4065.
Pui, C.H., Mullighan, C.G., Evans, W.E. & Relling, M.V. (2012) Pediatric acute lymphoblastic leu-kemia: where are we going and how do we get there?Blood,120, 1165–1174.
Rainer, J., Lelong, J., Bindreither, D., Mantinger, C., Ploner, C., Geley, S. & Kofler, R. (2012) Re-search resource: transcriptional response to glu-cocorticoids in childhood acute lymphoblastic leukemia.Molecular Endocrinology,26, 178–193.
Reiter, A., Schrappe, M., Ludwig, W.D., Hidde-mann, W., Sauter, S., Henze, G., ZimmerHidde-mann, M., Lampert, F., Havers, W., Niethammer, D., Odenwald, E., Ritter, J., Mann, G., Welte, K., Gadner, H. & Riehm, H. (1994) Chemotherapy in 998 unselected childhood acute lymphoblastic leukemia patients. Results and conclusions of the multicenter trial ALL-BFM 86. Blood, 84, 3122–3133.
Rhein, P., Scheid, S., Ratei, R., Hagemeier, C., See-ger, K., Kirschner-Schwabe, R., Moericke, A., Schrappe, M., Spang, R., Ludwig, W.D. & Karawajew, L. (2007) Gene expression shift towards normal B cells, decreased proliferative capacity and distinct surface receptors character-ize leukemic blasts persisting during induction therapy in childhood acute lymphoblastic leuke-mia.Leukemia,21, 897–905.
Riehm, H., Reiter, A., Schrappe, M., Berthold, F., Dopfer, R., Gerein, V., Ludwig, R., Ritter, J., Stollmann, B. & Henze, G. (1987) Corticos-teroid-dependent reduction of leukocyte count in blood as a prognostic factor in acute lym-phoblastic leukemia in childhood (therapy study ALL-BFM 83).Klinische Padiatrie,199, 151–160.
Schmidt, S., Rainer, J., Ploner, C., Presul, E., Riml, S. & Kofler, R. (2004) Glucocorticoid-induced apoptosis and glucocorticoid resistance: molecu-lar mechanisms and clinical relevance. Cell Death and Differentiation,11, S45–S55.
Schmidt, S., Irving, J.A., Minto, L., Matheson, E., Nicholson, L., Ploner, A., Parson, W., Kofler, A., Amort, M., Erdel, M., Hall, A. & Kofler, R. (2006) Glucocorticoid resistance in two key models of acute lymphoblastic leukemia occurs at the level of the glucocorticoid receptor.
FASEB Journal,20, 2600–2602.
Schrappe, M., Reiter, A., Zimmermann, M., Har-bott, J., Ludwig, W.D., Henze, G., Gadner, H.,
Odenwald, E. & Riehm, H. (2000) Long-term results of four consecutive trials in childhood ALL performed by the ALL-BFM study group from 1981 to 1995. Berlin-Frankfurt-Munster.
Leukemia,14, 2205–2222.
Schwab, C.J., Jones, L.R., Morrison, H., Ryan, S.L., Yigittop, H., Schouten, J.P. & Harrison, C.J. (2010) Evaluation of multiplex ligation-depen-dent probe amplification as a method for the detection of copy number abnormalities in B-cell precursor acute lymphoblastic leukemia. Ge-nes Chromosomes Cancer,49, 1104–1113.
Tissing, W.J., Meijerink, J.P., den Boer, M.L., Brin-khof, B., van Rossum, E.F., van Wering, E.R., Koper, J.W., Sonneveld, P. & Pieters, R. (2005)
Genetic variations in the glucocorticoid receptor gene are not related to glucocorticoid resistance in childhood acute lymphoblastic leukemia.
Clinical Cancer Research,11, 6050–6056.
Unwin, R.D., Pierce, A., Watson, R.B., Sternberg, D.W. & Whetton, A.D. (2005) Quantitative pro-teomic analysis using isobaric protein tags enables rapid comparison of changes in tran-script and protein levels in transformed cells.
Molecular & Cellular Proteomics: MCP,4, 924–
935.
Unwin, R.D., Smith, D.L., Blinco, D., Wilson, C.L., Miller, C.J., Evans, C.A., Jaworska, E., Baldwin, S.A., Barnes, K., Pierce, A., Spooncer, E. & Whetton, A.D. (2006) Quantitative proteomics
reveals posttranslational control as a regulatory factor in primary hematopoietic stem cells.
Blood,107, 4687–4694.
Vacchio, M.S. & Ashwell, J.D. (1997) Thymus-derived glucocorticoids regulate antigen-specific positive selection.Journal of Experimental Medi-cine,185, 2033–2038.
Zhou, M., Gu, L., Li, F., Zhu, Y., Woods, W.G. & Findley, H.W. (2002) DNA damage induces a novel p53-survivin signaling pathway regulating cell cycle and apoptosis in acute lymphoblastic leukemia cells. Journal of Pharmacology and Experimental Therapeutics,303, 124–131.