An improved imaging algorithm for spaceborne
MAPs sliding spotlight SAR with high-resolution
wide-swath capability
Kuang Hui
a, Chen Jie
a, Yang Wei
a,*, Liu Wei
ba
School of Electronic and Information Engineering, Beihang University, Beijing 100191, China
b
Electronic and Electrical Engineering Department, University of Sheffield, Sheffield S1 3JD, UK
Received 1 November 2014; revised 2 January 2015; accepted 9 February 2015 Available online 19 June 2015
KEYWORDS High resolution; Imaging;
Multiple-azimuth-phases; Sliding spotlight; Synthetic aperture radar; Wide swath
Abstract Conventional synthetic aperture radar (SAR) systems cannot achieve both high-resolution and wide-swath imaging simultaneously. This problem can be mitigated by employing multiple-azimuth-phases (MAPs) technology for spaceborne sliding spotlight SAR systems. However, traditional imaging algorithms have met challenges to process the data accurately, due to range model error, MAPs data reconstruction problem, high-order cross-coupling phase error and variation of Doppler parameters along the azimuth direction. Therefore, an improved imaging algorithm is proposed for solving the above problems. Firstly, a modified hyperbolic range equation (MHRE) is proposed by introducing a cubic term into the traditional hyperbolic range equation (THRE). And two curved orbit correction methods are derived based on the proposed range model. Then, a MAPs sliding spotlight data reconstruction method is introduced, which solves the spectral aliasing problem by a de-rotation operation. Finally, high-order cross-coupling phases and variation of Doppler parameters are analyzed and the corresponding compensation methods are proposed. Simulation results for point-target scene are provided to verify the effectiveness of the proposed algorithm.
ª2015 Production and hosting by Elsevier Ltd. on behalf of CSAA & BUAA. This is an open access article under the CC BY-NC-ND license (http://creativecommons.org/licenses/by-nc-nd/4.0/).
1. Introduction
In the past decades, significant progress has been made in remote sensing with the aid of spaceborne synthetic aperture radar (SAR). To meet the needs of specific applications and also improve the performance of spaceborne SAR systems, dif-ferent imaging modes have been developed, such as stripmap, ScanSAR, spotlight, sliding spotlight, TOPS (terrain observa-tion by progressive scan) and inverse TOPS.1–4 However, many of them are incapable of imaging wide swath with high * Corresponding author. Tel.: +86 10 82338670.
E-mail address:[email protected](W. Yang).
Peer review under responsibility of Editorial Committee of CJA.
Production and hosting by Elsevier
Chinese Society of Aeronautics and Astronautics
& Beihang University
Chinese Journal of Aeronautics
[email protected] www.sciencedirect.com
http://dx.doi.org/10.1016/j.cja.2015.06.009
1000-9361ª2015 Production and hosting by Elsevier Ltd. on behalf of CSAA & BUAA.
geometric resolution. This problem can be solved by employ-ing multiple-azimuth-phases (MAPs) technology in slidemploy-ing spotlight mode, which will be implemented in TerraSAR-X2 in the future and is named as multiple-azimuth-phases very-high-resolution (MAPs-VHR) sliding spotlight mode.5
Several factors should be considered for high-resolution wide-swath (HRWS) imaging. Firstly, traditional imaging algorithms are derived based on the straight trajectory assumption, which leads to un-negligible phase error for high-resolution SAR systems. Therefore, the phase error caused by a curved orbit should be compensated in some ways. Secondly, as for the MAPs-VHR sliding spotlight mode, to obtain a wide swath, the pulse repetition frequency (PRF) is selected to be less than the Doppler bandwidth, resulting in spectral aliasing in azimuth direction. As a result, different from MAPs stripmap data reconstruction, MAPs-VHR sliding spotlight data should be reconstructed with under-sampling. Thirdly, with high-resolution and wide-swath, high-order cross-coupling phases between azimuth and range become so large that they should be compensated too, especially for tar-gets at the edge of the scene. At last, Doppler parameters vary slightly along azimuth direction due to rotation of Earth and curved orbit. This variation cannot be ignored in high-resolution systems.
With the above considerations, several methods have been proposed. In Ref.6, a numerical method is presented for com-pensating the error caused by a curved orbit. However, this method cannot guarantee image quality at the edge of the scene. An advanced hyperbolic range equation (AHRE) is pro-posed to describe the curved orbit for medium-Earth-orbit (MEO) in Ref.7, which only performs well for medium/low-resolution spaceborne SAR systems. For the high medium/low-resolution case, two methods are described to compensate the curved orbit error in Ref.8, by applying corrections in the azimuth fre-quency domain and azimuth time domain, respectively. A novel fourth-order Doppler range model (DRM4) is proposed for high-resolution LEO SAR in Ref.9, which needs to utilize fourth-order Doppler parameters. To overcome the spectral aliasing problem in monostatic sliding spotlight SAR, a mod-ified deramp chirp scaling algorithm (MDCS) is proposed in Ref.10 Compared with the two-step algorithm for spotlight SAR data processing in Ref.11, a de-rotation operation is implemented in the first step. But the MDCS algorithm ignores the azimuth re-sampling effect caused by de-rotation opera-tion, which may result in image aliasing in azimuth direction. A baseband azimuth scaling (BAS) algorithm is derived in Ref.12, based on the extended chirp scaling (ECS) algorithm.13 It can avoid spectral aliasing in azimuth direction by adding a post-processing step. However, as a sub-aperture algorithm, spectrum splitting is needed for BAS algorithm, leading to strict requirements on phase preserving accuracy. Contrary to the BAS algorithm, a three-step full-aperture algorithm is proposed in Ref.14, where a de-rotation operation is performed first to avoid data division, followed by a deramp operation to avoid image aliasing. For MAPs SAR systems, the data should be reconstructed first using methods proposed in Ref.15–17. However, such methods are based on the condition that the total Doppler bandwidth should be smaller than the equivalent PRF, which cannot be satisfied in MPAs-VHR sliding spotlight SAR system. In Ref.18, a novel ‘‘staircase’’ method is presented to reconstruct the MPAs TOPS SAR data, which can be adopted for the MPAs sliding spotlight mode.19 But
the ‘‘staircase’’ method needs to split the raw data into aperture in azimuth direction, thus an additional sub-aperture combining operation has to be applied in azimuth frequency domain, which is only suitable for sub-aperture imaging algorithms. To solve the problem, full aperture azimuth processing for MPAs Beam Steering SAR (BS-SAR) is proposed in Ref.20, based on beam compression and azimuth bandwidth compression of signals in the Doppler-array and slow time-angle planes, which is a very complicated process.
Based on the above analysis, a refined three-step algorithm is proposed in this paper for accurately processing MAPs-VHR sliding spotlight SAR data. In order to describe the curved orbit more accurately, a modified hyperbolic range equation (MHRE) is presented firstly, which adds a cubic term into the traditional hyperbolic range equation (THRE). Two methods for compensating the curved orbit error are derived based on the MHRE. Then, a reconstruction method for MPAs-VHR sliding spotlight SAR data is introduced, which contains three main steps, including Dechirp Operation, Filter Operation, and Rechirp Operation. This method can perform reconstruction and de-rotation operations simultane-ously. After data reconstruction, the spectrum in azimuth is no longer aliased and frequency focusing algorithms can be applied. Furthermore, high-order cross-coupling phases between range and azimuth are analyzed and a corresponding compensation method is provided. Variation of Doppler parameters along the azimuth direction is considered during data processing. The effectiveness of our proposed method is verified by extensive simulations.
This paper is organized as follows. Section2 reviews the MPAs-VHR sliding spotlight mode based on the MHRE and discusses the signal property. Section 3 addresses the derivation of MPAs-VHR sliding spotlight SAR data process-ing algorithm, includprocess-ing MAPs data reconstruction, curved orbit correction, high-order cross-coupling phases compensa-tion and Doppler parameters updating along azimuth. Imaging results of simulated point targets are given in Section 4 to validate the proposed focusing algorithm, and conclusions are drawn in Section5.
2. MPAs-VHR sliding spotlight mode
The MPAs-VHR sliding spotlight mode is proposed for high resolution and wide swath imaging. In this section, imaging geometry of the proposed mode is reviewed based on MHRE and the signal characteristic is analyzed in detail.
2.1. Imaging geometry
Imaging geometry of the MPAs-VHR sliding spotlight mode is shown inFig. 1, wherevsis the velocity of the satellite,vgthe
velocity of the beam center on the ground,Othe center of the scene, O0 the rotation center of the azimuth antenna-beam which is located at a point below the scene surface,Rrsthe
YðrÞ ¼Rrsr Rrs
ð1Þ
2.2. MHRE
The THRE is used by most spaceborne SAR processors, which assumes that the trajectory of the sensor is a straight line. In practice, the trajectory of the satellite is curved based on the Keplerian orbit. The straight trajectory assumption becomes less accurate as the aperture time becomes longer, especially when the resolution is higher than 0.5 m. In Ref.21, THRE is given by
Rðt;rÞ ¼
ffiffiffiffiffiffiffiffiffiffiffiffiffiffiffiffiffiffiffiffiffiffiffiffiffiffiffiffiffiffiffiffiffiffiffiffiffiffiffiffiffiffiffiffiffiffiffiffiffiffiffi r2þ ðv
rtÞ 2
2rvrtcosueq
q
ð2Þ
wheretis azimuth time,ueqequivalent angle, andvr ffiffiffiffiffiffiffiffivsvg
p
effective radar velocity.22To describe the satellite orbit more
accurately, in this paper, an additional cubic coefficientk 6cðrÞ is introduced into the THRE to form the MHRE model
Rðt;rÞ ¼
ffiffiffiffiffiffiffiffiffiffiffiffiffiffiffiffiffiffiffiffiffiffiffiffiffiffiffiffiffiffiffiffiffiffiffiffiffiffiffiffiffiffiffiffiffiffiffiffiffiffiffi r2þ ðv
rtÞ22rvrtcosueq
q
þk 6cðrÞt
3 ð3Þ
wherekis carrier wavelength andcðrÞis relative to the slant range and there is no analytic expression for it. Thus, it needs to be estimated by numerical approaches for every image scene.
2.3. Signal mode
The signal of a point target at azimuth timet¼0 and slant rangerfor theith receive channel can be described as
Siðs;t;rÞ ¼rrect 1 Tp
s1
c Rðt;rÞ þR t di vr ;r
rect YðrÞvrt X
rect t
Tscene
exp j2pk s
Rðt;rÞ þR tdi vr;r
c 0 @ 1 A 2 2 6 4 3 7 5 exp j2p
Rðt;rÞ þR tdi vr;r
k 2 4 3 5 ð4Þ
where r represents the target cross-section, s range time , Xkr=L the azimuth antenna footprint, L the length of antenna, Tscene the azimuth integration time, c the speed of
light, k the FM rate of the transmitted chirp pulse, di the along-track displacement of theith receive channel center rel-ative to the transmitter channel center,Rðt;rÞthe slant range between the transmitter channel center and the target point,
and R tdi vr
;r
the slant range between the target point
and theith receive channel center.
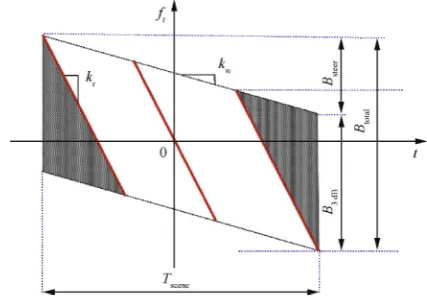
Fig. 2 shows the time–frequency diagram of the sliding spotlight mode, ft is azimuth frequency ,kr andkw represent
Doppler rate and antenna sweep rate, respectively, given by
kr¼
2v2 rcos
2u eq kr
kw¼
2v2 rcos2ueq
kRrs
8 > > < > > : ð5Þ
B3 dB represents 3 dB Doppler bandwidth, and Bsteer the
Doppler bandwidth resulting from azimuth antenna-beam steering, which can be written as
Bsteer¼ jkwjTscene ð6Þ
The total Doppler bandwidthBtotal¼B3dBþBsteeris much
lar-ger than the equivalent pulse repetition frequency MPRF, whereMdenotes the number of azimuth receive channels.
3. MPAs-VHR SAR processing algorithm
This section considers several specific aspects for processing the MAPs-VHR spaceborne sliding spotlight SAR data. For each aspect, a corresponding solution is provided. Then, an algorithm is proposed based on the overall analyses.
3.1. MPAs data reconstruction
For MPAs-VHR sliding spotlight mode, as the Doppler band-width is much larger than the equivalent PRF, MPAs data reconstruction should be applied with azimuth under-sampling. Similar to the MPAs stripmap mode, the character-istics of the signal in azimuth are analyzed first. Eq.(4)can be simplified as follows, which only considers the azimuth signal Fig. 1 Imaging geometry of MPAs-VHR sliding spotlight mode.
[image:3.595.73.274.53.202.2] [image:3.595.321.535.555.704.2]hiðt;rÞ ¼rrect YðrÞvrt
X
rect t T
exp j2p
k Rðt;rÞ þR t
di vr ;r ð7Þ
Expanding Eq.(3)using Taylor series up to the second order yields
hiðt;rÞ rrect YðrÞvrt X
rect t T
exp j2p
k 2R t
di 2vr
;r
þkrd
2
i 8v2 r
ð8Þ
Thus, the transfer functionHiðftÞbetween the transmitter and
theith receiver with respect to the monostatic impulse response is given by15
HiðftÞ ¼exp j
pkrd2i 4v2
r
exp j2pft
di 2vr
ð9Þ
where MPRF=26ft6MPRF=2. Note that the phase
offset pkrd
2
i 4v2
r
is variant corresponding to azimuth time with
the steering of azimuth antenna beam, leading to modulation in azimuth, which may degrade image quality when it is large. Fortunately, the phase offset variation is normally smaller than 0.1and therefore can be ignored.18However, in order to guarantee an acceptable image quality, the residual phase offset is compensated as well. Based on the transfer function HiðftÞ for every channel, the reconstructed filters PiðftÞ can
be obtained with the method in Ref.15
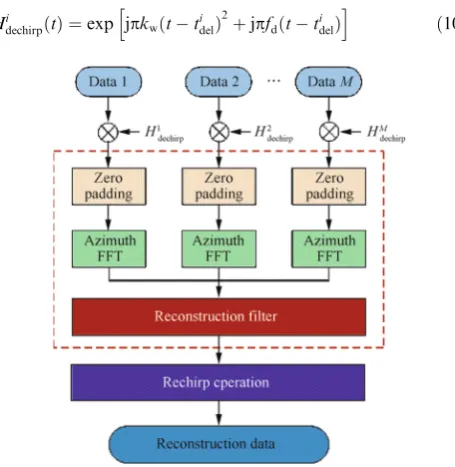
With the reconstructed filter, an MPAs data reconstruction method is proposed based on the de-rotation operation.14The method contains three main steps, including dechirp opera-tion, filter operation and rechirp operaopera-tion, as shown in Fig. 3, and the detailed operations are described as follows.
(1) Dechirp operationThe dechirp operation can be realized by multiplying theith channel signalSiðt;s;rÞwith the corresponding dechirp filterHi
dechirpðtÞ.
Hi
dechirpðtÞ ¼exp jpkwðttidelÞ 2
þjpfdðtti
delÞ
h i
ð10Þ
whereti
del¼
di 2vs
denotes the ith channel delay time, the
index iindicates theith channel, andfd is the Doppler centroid of the raw data.
(2) Filter operationAfter the dechirp Operation, the Filter Operation can be applied as for the MAPs stripmap SAR data. First, zero padding is applied for every channel data, followed by azimuth FFT. Then, effective azimuth spectral reconstruction can be carried out using the method in Ref.15with the reconstructed filter
PiðfÞ. (3) Rechirp operationThe rechirp operation is carried out using the rechirp filter HrechirpðtÞ which performs
re-sampling in azimuth frequency domain.
HrechirpðtÞ ¼expðjpkwt2Þ ð11Þ
After MAPs data reconstruction, we have several observations.
The sample rate in azimuth becomesfPRF, given by
fPRF¼
Nakw
MPRF ð12Þ
whereNa is the point number after zero padding in azimuth.
fPRFis a linear function ofNa. In order to avoid azimuth
spec-trum aliasing, Na should be selected properly to satisfy
fPRF>Btotal. The MAPs data are reconstructed without
spec-tral aliasing so that frequency focusing algorithms can be applied.
3.2. Curved orbit correction
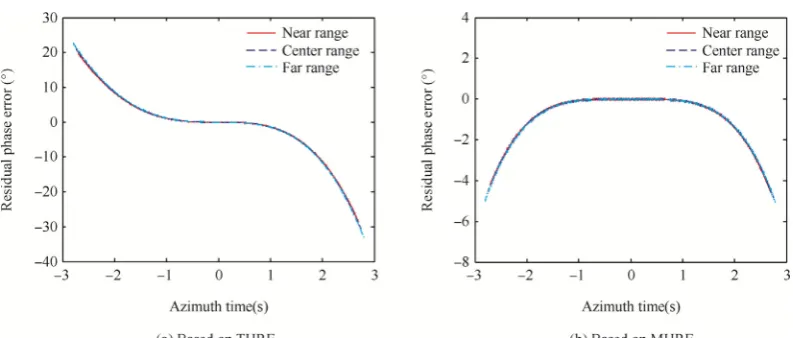
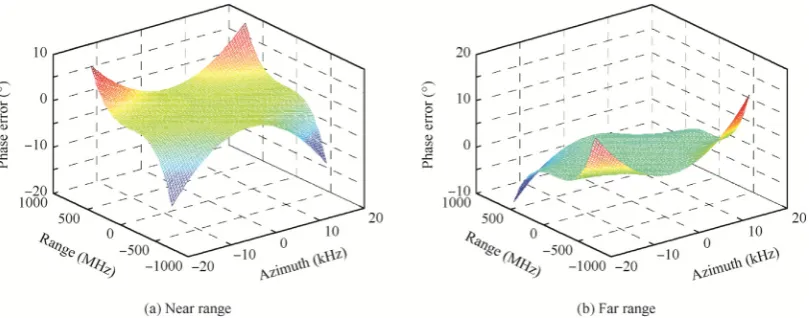
The MHRE is introduced to describe the orbit in Section2. In order to demonstrate its accuracy, simulations are performed. Table 1 shows the selected Keplerian orbit parameters. The scene center is located at the 0 altitude over the WGS-84 ellip-soid. The look angle is 30. The analyzed point targets are located 5 km away from each other along the range direction. Fig. 4(a) and (b) show the residual phase errors 4pDRðt;rÞ=k
based on the THRE and MHRE models, respectively, with 0.25 m resolution in azimuth.DRðt;rÞis the range error caused by the hyperbolic range equation for describing the curved orbit.
As illustrated inFig. 4(a), the residual phase error based on the THRE model is more than 30, which can lead to azimuth broadening and asymmetric sidelobes and degrade the image quality. On the other hand, when the MHRE model is used, there is mainly residual biquadratic phase error which is smal-ler than 5as shown inFig. 4(b). The effect of this residual phase error on image quality can be ignored. These results demonstrate that the proposed MHRE can effectively remove
Fig. 3 Flowchart of MPAs data reconstruction process.
Table 1 Orbit parameters.
Parameter Value
Eccentricity 0.0011
Inclination 97.44
Semi-major axis 7003.819 km
Argument of perigee 90.0
[image:4.595.50.278.480.714.2]the cubic phase error and provide a better fitting to the actual satellite orbit.
However, there are still two problems to be considered. One is how to calculate the coefficientcðrÞ; the other one is how to compensate the cubic phase error.
Firstly, cðrÞ can be obtained by the following method. Based on the ephemeris parameters of the satellite, we can acquire the position vector RSðt;rÞ, the velocity vector
VSðt;rÞ, the accelerated velocity vectorASðt;rÞof the satellite
and the position vector RTðt;rÞ, the velocity vector VTðt;rÞ,
the accelerated velocity vectorATðt;rÞ of the point target in
Earth-centered Earth-fixed coordinates. So the range RðtÞ between the satellite and the point target can be calculated by Eq.(13)
Rðt;rÞ ¼ jRSðt;rÞ RTðt;rÞj ð13Þ
The coefficients f0ðrÞ;f1ðrÞ;f2ðrÞ;f3ðrÞ can be obtained by a
curve fitting operation on the range Rðt;rÞ. And Rðt;rÞ can be expressed as
Rðt;rÞ f0ðrÞ þf1ðrÞtþf2ðrÞt2þf 3ðrÞt
3 ð14Þ
The equivalent speed and equivalent angle can be computed by
vr¼
ffiffiffiffiffiffiffiffiffiffiffiffiffiffiffiffiffiffiffiffiffiffiffiffiffiffiffiffiffiffiffiffiffiffiffiffiffiffiffiffiffiffiffiffiffiffiffi
kf0ðrÞf2ðrÞ
2 þ
kf1ðrÞ 2
2
s
ð15Þ
ueq¼arccos kf1ðrÞ 2vr
ð16Þ
Then,cðrÞcan be obtained as follows:
cðrÞ ¼f3ðrÞ v
3 r
2f20sin
2
ueqcosueq ð17Þ
Note thatcðrÞis variant with the range and it is very difficult to compensate. However,cðrÞcan be split into range independent and range dependent components. The range independent component is cðrrefÞ, corresponding to the reference range
rref. And the range dependent component is
DcðrÞ ¼cðrÞ cðrrefÞ. The range dependent component is so
small that it can be neglected in most cases.8 Therefore, we only focus on the range independent component.
There are two methods to correct phase error for the range independent component: one in the azimuth-time
range-frequency domain and the other one in the two-dimensional (2-D) frequency domain. For the first method, we should transform the MAPs data to range frequency domain by range FFT operation; then the correction can be realized by multi-plying the data with the following filter in the azimuth-time range-frequency domain.
Horbit 1ðt;fs;rrefÞ ¼exp j
2p 3
k
ccðrrefÞt
3ðf
sþf0Þ
ð18Þ
where fs is range frequency. After multiplication, the data should be transformed to the 2-D time domain by range inverse FFT operation. We can find that both phase and envel-ope of the signal are changed after correction. The basic idea of this method is to compensate the curved orbit to a straight trajectory; then the MAPs data reconstruction method and traditional algorithms based on the THRE model can be applied without any modification. For the 2-D frequency domain method, we have to obtain the 2-D spectrum of the signal based on the MHRE model. Assume that tkðfs;ftÞ is
the stationary point obtained by the principle of stationary phase (POSP). The correction can be realized by multiplying the data with the following filter in the 2-D frequency domain.
Horbit 2ðft;fs;rrefÞ ¼exp j
4 3pcðrrefÞt
3
kðfs;ftÞ
ð19Þ
And
tkðfs;ftÞ ¼
rrefcosuref
vref
rrefftsinuref
2v2 ref
ffiffiffiffiffiffiffiffiffiffiffiffiffiffiffiffiffiffiffiffiffiffiffiffiffiffiffiffiffiffiffiffiffiffiffiffiffiffiffiffiffiffiffiffi 1
kþ
fs c
2
ft
2vref
2
s ð20Þ
whereurefandvrefare equivalent angle and equivalent speed in
the reference range, respectively. In a word, both methods can compensate the error caused by the curved orbit validly. The first method is more accurate but less efficient compared with the second one.
3.3. High-order cross-coupling phases compensation
[image:5.595.105.502.50.219.2]cross-coupling phases cannot be ignored in high-resolution applications.
The 2-D Fourier transform of the signal impulse response has the following form
Sðfs;ft;rÞ ¼rwðftÞ aðfsÞ expfjwðfs;ft;rÞg ð21Þ
where wðftÞis the transform of antenna weighting, and aðfsÞ
the pulse envelope. The phase term wðfs;ft;rÞ has an exact
expression given below:
wðfs;ft;rÞ ¼
4prsinur k
ffiffiffiffiffiffiffiffiffiffiffiffiffiffiffiffiffiffiffiffiffiffiffi 1 kft
2vr
2
s
ffiffiffiffiffiffiffiffiffiffiffiffiffiffiffiffiffiffiffiffiffiffiffiffiffiffiffiffiffiffiffiffiffiffiffi
1 2fsk
c þ fsk
c
2
1 kft
2vr
2 v u u u u u u t ð22Þ
With Taylor series expansion on the range frequencyfs,ur is equivalent angle in the range, wðfs;ft;rÞ has the following
form
wiðfs;ft;rÞ ¼w0ðft;rÞ þw1ðft;rÞfsþw2ðft;rÞf 2
s þ wiðft;rÞf
i
sþ ð23Þ
whereiis the order of the Taylor series expansion.wiðfs;ft;rÞ
becomes a closer approximation to wðfs;ft;rÞ as i increases. The residual phase error when we expand Eq.(22) to theith order can be calculated by
Dwiðfs;ft;rÞ ¼wðfs;ft;rÞ wiðfs;ft;rÞ ð24Þ
Residual phase errors fori¼3;4 and 5 are shown inFig. 5. We can see that the higher-order cross-coupling phase error is up to 400at the edge of the bandwidth if Eq.(22)is only expanded to the 3rd order. This residual phase error can lead to a defocused/blurred image. The residual phase errors are less than 20and 0.2if Eq.(22) is expanded to the 4th and 5th orders, as shown in Fig. 5(b) and (c), respectively. Therefore, the high-order cross-coupling phase errors have to be compensated to obtain a high image quality. In this case, we only take into account the terms up to the 5th order and ignore the higher order terms. The phase error can be compen-sated in the 2-D frequency domain by the following phase filter
Hcoupleðft;fs;rrefÞ ¼expfjðw3ðft;rrefÞf3sþw4ðft;rrefÞf4s
þw5ðft;rrefÞf5sÞg ð25Þ
And
w3ðft;rrefÞ ¼
2pk2r
refsinuref
c3D5ð
ftÞ
kft
2vref
2
ð26Þ
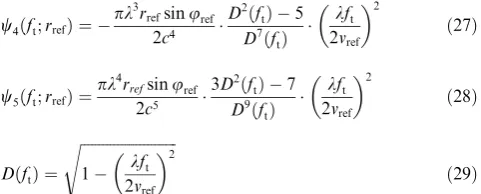
w4ðft;rrefÞ ¼
pk3rrefsinuref
2c4
D2ðf tÞ 5
D7ðf tÞ
kft 2vref
2
ð27Þ
w5ðft;rrefÞ ¼
pk4rrefsinuref
2c5
3D2ðf tÞ 7
D9ðftÞ
kft
2vref
2
ð28Þ
DðftÞ ¼
ffiffiffiffiffiffiffiffiffiffiffiffiffiffiffiffiffiffiffiffiffiffiffiffiffiffi 1 kft
2vref
2
s
ð29Þ
However, for higher resolution case, the high-order cross-coupling phase errors are much larger, and higher order terms should be taken into account in Eq.(25). What’s more, the phase filter in Eq.(25) is relative to the reference range rref,
which can compensate the high-order cross-coupling phases for targets in the reference range. For targets in ranger, there exists residual phase described as
Ducoupleðft;fs;rÞ ¼ ðw3ðft;rrefÞf3sþw4ðft;rrefÞf4s
þw5ðft;rrefÞf5sÞ ðw3ðft;rÞf 3
s þw4ðft;rÞf
4
sþw5ðft;rÞf 5
sÞ ð30Þ
Note that the residual phase increases with range displacement Dr(defined asrrref) from Eq.(30).Fig. 6(a) and (b) show
the residual phase for targets in near range and far range, respectively. It can be seen that the maximal residual phase is only about 10and can be ignored in this case. However, as swath becomes larger and resolution becomes better, the residual phase will correspondingly become larger. To guaran-tee the image quality in the whole scene, the maximal residual phase should be less thanp=4.
3.4. Doppler parameters updating along azimuth
The chirp scaling (CS) algorithm is an efficient algorithm for updating the Doppler parameters along the range direction. However, it assumes that the Doppler parameters are invariant along the azimuth direction. In reality, they change slightly due to rotation of the Earth and curved orbit. Such variations can-not be ignored for high-resolution and wide-swath SAR sys-tems. To find the variation characteristics of the Doppler parameters along the azimuth direction, the Doppler rates of the point targets with the same closest range located at differ-ent azimuth positions are calculated. The simulation parame-ters are the same as those in Section3.2.Fig. 7(a) shows the results. We can see that the variation changes almost linearly with the distance to the azimuth center. The largest deviation
[image:6.595.302.543.53.150.2]is up to 0.03 Hz/s at the azimuth edge, yielding about 50 phase error with 0.25 m resolution in azimuth, which can degrade the azimuth resolution. The phase error caused by Doppler rate variation is given inFig. 7(b).
To guarantee the image quality along the azimuth direc-tion, the data can be processed by azimuth segmentation. In each segment, the Doppler rate variation can be updated cor-respondingly. The steps are given as follows.
Step 1. Divide the image data into segments along the azi-muth direction with maximal phase error caused by Doppler rate variation less thanp=8 (black solid line in Fig. 7(b)).
Step 2. Transform the segment data into range Doppler domain by azimuth FFT operation.
Step 3. Compute the azimuth segment compensation filter Haz comðxm;r;ftÞ according to Eq. (31) for each
seg-ment, where the azimuth positionxmis updated to the azimuth middle position of each segment, kaðxm;rÞ andkaðx0;rÞare Doppler rates of targets at the position
ðxm;rÞ and the azimuth reference position ðx0;rÞ,
respectively. And then, multiply it with the data.
Haz comðxm;r;ftÞ ¼exp jpf 2 t
kaðxm;rÞ kaðx0;rÞ
kaðxm;rÞ kaðx0;rÞ
ð31Þ
Step 4. Transform the data into image domain by azimuth inverse FFT operation.
Then, the segment image data can be combined together and an exact focused image of the whole scene is obtained.
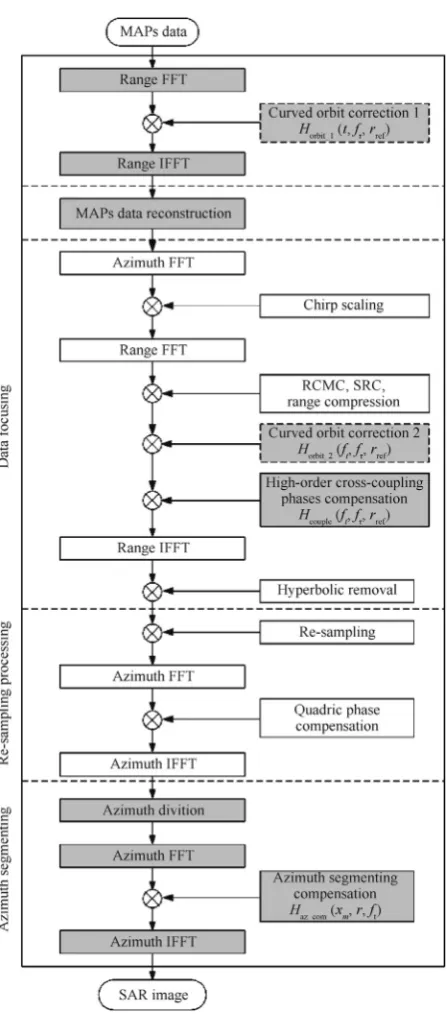
3.5. Summary of the proposed imaging algorithm
A flowchart for our proposed imaging algorithm is shown in Fig. 8. It has four steps: MAPs Data Reconstruction, Data Focusing, Re-sampling Processing and Azimuth Segmenting. The first and third steps are analyzed in detail in Section 3.1 and in Ref.14, respectively. The proposed algo-rithm makes some modifications at the second step to com-pensate the phase errors caused by the curved orbit and high-order cross-coupling phase approximation. The last step is to compensate the phase error caused by the Doppler parameters variation along the azimuth direction. Considering the accuracy and efficiency, the CS algorithm Fig. 6 Residual phase after compensation for targets in near range and far range.
[image:7.595.101.506.54.213.2] [image:7.595.98.509.271.434.2]is chosen as the imaging algorithm kernel, which implements range cell migration correction (RCMC), range compression, second range compression (SRC), as well as hyperbolic phase removal. Furthermore, some operations are added to the CS algorithm as shown in Fig. 7. The curved orbit correction is applied using the phase filter Horbit 1ðt;fs;rrefÞ given by
Eq. (18) or Horbit 2ðft;fs;rrefÞ given by Eq. (19). Moreover,
the high-order cross-coupling phases can be compensated in the 2-D frequency domain using the phase filter Hcoupleðft;fs;rrefÞgiven by Eq. (25).
4. Simulation results
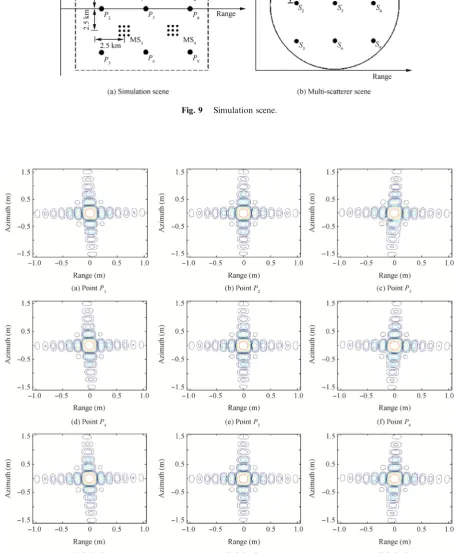
Simulations are performed to assess the imaging result of the proposed algorithm for processing the MAPs-VHR space-borne sliding spotlight SAR data. The required parameters are listed in Table 2. Fig. 9 shows the designed simulation scene. InFig. 9(a), nine isolated-scatterer points (P1–P9) with
a uniform spacing of 5 km from each other are included to validate the proposed algorithm in full scene. Also four multi-scatterer points (MS1–MS4) are set to analyze the
per-formance of resolution. The multi-scatterer point includes nine points (S1–S9) with tight interval of 0.3 m as shown in
Fig. 9(b).
The contour plots of the impulse response function (IRF) of the nine isolated-scatterer points are shown in Fig. 10. It can be seen that all of the nine isolated-scatterer points are well focused, although there exist small squint angles of the isolated-scatterer point at the azimuth edges due to azimuth antenna-beam steering in the sliding spotlight mode.
The obtained image quality parameters including impulse response width (IRW), peak sidelobe ratio (PSLR), and inte-grated sidelobe ratio (ISLR) in both azimuth and range are computed and listed inTable 3, where we can see that all of them are close to ideal values. The broadening of IRW is smal-ler than 1% in both azimuth and range. Moreover, the changes of IRW in azimuth are observed and the IRW for the isolated-scatterer point at near slant range is better than the one in far slant range.
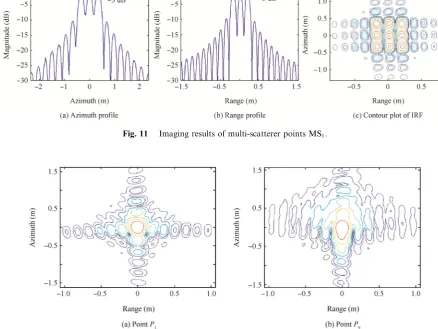
What’s more, to analyze the performance of resolution, Fig. 11 shows the imaging results of multi-scatterer points MS1.Fig. 11(a) and (b) show the azimuth profile and range
profile, respectively. It can be seen that the three points are separated obviously at 3 dB. The contour plot of the IRF of MS1 is given in Fig. 11(c), and the nine points are well
focused. The results indicate that the proposed algorithm has a good performance of resolution.
As a result, both the imaging results of the isolated-scatterer points and multi-isolated-scatterer points demonstrate the effectiveness of the proposed imaging algorithm. Furthermore, to show the necessity of curve orbit correction and high-order cross-coupling phases compensation, Fig. 12 gives the contour plots of the IRF for isolated-scatterer points P1andP9using the CS kernel without any corrections. It can
be seen that the IRFs are severely degraded, especially for isolated-scatterer points at the edge of the scene.
[image:8.595.54.278.47.555.2]Fig. 8 Flowchart of the proposed imaging algorithm for MAPs-VHR spaceborne sliding spotlight SAR.
Table 2 Simulation parameters.
Parameter Value
Platform height 514.0 km
Wavelength 0.03 m
PRF 2300 Hz
Bandwidth 1000 MHz
Sample frequency 1200 MHz
Look angle 30.0
Number of channels 3
[image:8.595.308.540.606.717.2]Fig. 9 Simulation scene.
[image:9.595.72.531.118.672.2]5. Conclusion
Based on the MAPs-VHR spaceborne sliding spotlight SAR system, a new method has been proposed for high-resolution and wide-swath imaging. To improve the performance of the MAPs-VHR spaceborne sliding spotlight SAR system, firstly, the MHRE model is introduced to describe the curved orbit more accurately with the corresponding corrections presented; secondly, to deal with the azimuth spectral aliasing problem
when the Doppler bandwidth of the MAPs-VHR SAR data is larger than the equivalent PRF, a data reconstruction method based on the de-rotation operation is proposed; thirdly, to guarantee image quality of the whole scene, the high-order cross-coupling phases are compensated and varia-tions of the Doppler parameters along the azimuth direction are considered. With all these considerations, a novel algo-rithm for MAPs-VHR sliding spotlight SAR data processing has been proposed based on the previously developed three-Table 3 Quality measurement results.
Point Azimuth Range
IRW(m) PSLR(dB) ISLR(dB) IRW(m) PSLR(dB) ISLR(dB)
P1 0.246 13.264 10.266 0.133 13.129 10.063
P2 0.246 13.274 10.251 0.133 13.213 10.010
P3 0.246 13.226 10.306 0.133 13.151 10.097
P4 0.242 13.238 10.263 0.132 13.071 10.101
P5 0.242 13.275 10.251 0.133 13.241 10.029
P6 0.242 13.208 10.292 0.132 13.177 10.123
P7 0.238 13.265 10.275 0.132 13.034 10.074
P8 0.239 13.273 10.250 0.133 13.273 10.450
[image:10.595.48.539.59.194.2]P9 0.239 13.207 10.287 0.133 13.066 10.113
[image:10.595.68.507.245.574.2]Fig. 11 Imaging results of multi-scatterer points MS1.
[image:10.595.94.492.393.574.2]step algorithm. The effectiveness of the proposed method has been verified by simulation results for a scene with isolated-scatterer points and multi-isolated-scatterer points.
Acknowledgement
This work was supported by the National Natural Science Foundation of China (No. 61132006).
References
1. Sun GC, Xing MD, Xia XG, Yang J, Wu Y, Bao Z. A unified focusing algorithm for several modes of SAR based on FrFT. IEEE Trans Geosci Remote Sens2013;51(5):3139–55.
2. Liu M, Zhang L, Li CL. Nonuniform three-dimensional config-uration distributed SAR signal reconstruction clutter suppression. Chin J Aeronaut2012;25(3):425–9.
3. Guo J, Xu YS, Fu LS. An extended chirp scaling algorithm for spaceborne sliding spotlight synthetic aperture radar imaging. Chin J Aeronaut2014;27(4):892–902.
4. De ZF, Monti GA. TOPSAR: Terrain observation by progressive Scans.IEEE Trans Geosci Remote Sens2006;44(9):2352–60. 5. Juergen J, Steffen G, Wolfgang K, Alexander K, Christian F.
TerraSAR-X2 – mission overview.Proceedings of IEEE
interna-tional geoscience and remote sensing symposium; 2012 Jul 22–27;
Munich, Germany. Piscataway, NJ: IEEE Press; 2012. p. 217–20. 6. Han B, Zhang YJ, Hu DH, Huang LJ. Research on mending of spaceborne sliding spotlight SAR imaging model error.J Electron Inf Technol2011;33(7):1694–9 Chinese.
7. Huang LJ, Qiu XL, Hu DH, Ding CB. Focusing of medium-earth-orbit SAR with advanced nonlinear chirp scaling algorithm.IEEE Trans Geosci Remote Sens2011;49(1):500–8.
8. Prats-Iraola P, Scheiber R, Rodriguez CM, Mittermayer J, Wollstadt S, De ZF, et al. On the processing of very high resolution spaceborne SAR data.IEEE Trans Geosci Remote Sens 2014;52(10):6003–16.
9. Luo YH, Zhao BJ, Han XL, Wang R, Song HJ, Deng YK. A novel order range model and imaging approach for high-resolution LEO SAR. IEEE Trans Geosci Remote Sens 2014;52(16):3473–85.
10. Lanari R, Zoffoli S, Sansosti E, Formaro G, Serafino F. New approach for hybrid Strip-map/Spotlight SAR data focusing.IET Radar Sonar Navig2011;148(6):363–72.
11. Lanari R, Tesauro M, Sansosti E, Fornaro G. Spotlight SAR data focusing based on a two-step processing approach.IEEE Trans Geosci Remote Sens2001;39(9):1993–2004.
12. Prats P, Scheiber R, Mittermayer J, Meta A, Moreira A. Processing of sliding spotlight and TOPS SAR data using baseband azimuth scaling. IEEE Trans Geosci Remote Sens 2010;48(2):770–80.
13. Mittermayer J, Lord R, Borner E. Sliding spotlight SAR process-ing for TerraSAR-X usprocess-ing a new formulation of the extended chirp scaling algorithm. Proceedings of IEEE international
geo-science and remote sensing symposium; 2003 Jul 21–25; Toulouse,
France. Piscataway, NJ: IEEE Press; 2003. p. 1462–4.
14. Yang W, Chen J, Zeng HC, Zhou J, Wang PB, Li CS. A novel three-step image formation scheme for unified focusing on spaceborne SAR data.Prog Electromagnet Res2013;137:621–42. 15. Krieger G, Gebert N, Moreira A. Unambiguous SAR signal
reconstruction from nonuniform displaced phase center sampling. IEEE Geosci Remote Sens Lett2004;1(4):260–4.
16. Jing W, Xing MD, Qiu CW, Bao Z, Yeo TS. Unambiguous reconstruction and high-resolution imaging for multiple-channel
SAR and airborne experiment results.IEEE Geosci Remote Sens Lett2009;6(1):102–6.
17. Li ZF, Wang HY, Su T, Bao Z. Generation of wide-swath and high-resolution SAR images from multichannel small spaceborne SAR systems.IEEE Geosci Remote Sens Lett2005;2(1):82–6. 18. Gebert N, Krieger G, Moreira A. Multichannel azimuth
process-ing in ScanSAR and TOPS mode operation.IEEE Trans Geosci Remote Sens2010;48(7):2994–3008.
19. Chen Q, Deng YK, Wang R, Liu YD. Investigation of multi-channel sliding spotlight SAR for ultrahigh-resolution and wide-swath imaging. IEEE Geosci Remote Sens Lett 2013;10(6): 1339–43.
20. Sun GC, Xing MD, Xia XG, Wu YF, Huang PP, Wu YR, et al. Multichannel full-aperture azimuth processing for beam steering SAR.IEEE Trans Geosci Remote Sens2013;51(9):4761–78. 21. Wang GD. A deramp chirp scaling algorithm for processing
spaceborne spotlight SAR data. Proceedings of microwave and
millimeter wave technology; 2004 Aug 18–21; Beijing, China;
Piscataway, NJ: IEEE Press; 2004. p. 659–63.
22. Cumming IG, Wong FH.Digital processing of synthetic aperture
radar data: algorithms and implementation. Boston: Artech House;
2005. p. 127.
23. Raney RK, Runge H, Bamler R, Cumming IG, Wong FH. Precision SAR processing using chirp scaling.IEEE Trans Geosci Remote Sens1994;32(4):786–99.
24. Moreira A, Mittermayer J, Scheiber R. Extended chirp scaling algorithm for air- and spaceborne SAR data processing in stripmap and scanSAR imaging modes. IEEE Trans Geosci Remote Sens1996;34(5):1123–36.
Kuang Hui is a Ph.D. student at the school of electronic and infor-mation engineering, Beihang University (BUAA). He received his B.S. degree from Beihang University in 2008. His research is signal pro-cessing of high-resolution and wide-swath mode in spaceborne SAR.
Chen Jieis a professor and Ph.D. supervisor at the school of electronic and information engineering, Beihang University (BUAA), Beijing, China. He received the B.S. and Ph.D. degrees in information and communication engineering from the same university in 1996 and 2002, respectively. His main research interests include multimodal remote sensing data fusion, topside ionosphere exploration with spaceborne high-frequency/very high-frequency synthetic aperture radar (SAR) systems, high-resolution spaceborne SAR image forma-tion and SAR image quality enhancement.
Yang Weireceived the M.S. and Ph.D. degrees in signal and infor-mation processing from Beihang University (BUAA) in 2008 and 2011, respectively, and then became a teacher there. His main research interests include ultrahigh-resolution spaceborne SAR image forma-tion, modeling and data simulation and novel techniques for space-borne SAR systems.