UN1VERSITI TEKNIKAL MALAYSIA MELAKA
UNIVERSITI TEKNIKAL MALAYSIA MELAKA
THE DEVELOPMENT OF PRESSURE SENSOR FOR PIPING
SYSTEM
This report is submitted in accordance with the requirement of the Universiti Teknikal Malaysia Meiaka (UTeM) for the Bachelor in Manufacturing Engineering
Technology (Process and Technology) with Honours
by
NORAZRAIE BIN MOHD SALIM B071210432
900115055129
UTeM
UNIVERSITI TEKNIKAL MALAYSIA MELAKA
UNIVERSITI TEKNIKAL MALAYSIA MELAKA
BORANG PENGESAHAN STATUS LAPORAN PROJEK SARJANA MUDA
TAJUK: THE DEVELOPMENT OF PRESSURE SENSOR FOR PIPING SYSTEM
SESI PENGAJIAN: 2015/ 2016 Semester 1
Saya NORAZRAIE BIN MOHD SALIM
mengaku membenarkan Laporan PSM ini disimpan di Perpustakaan Universiti Teknikal Malaysia Melaka (UTeM) dengan syarat-syarat kegunaan seperti berikut: 1. Laporan PSM adalah hak milik Universiti Teknikal Malaysia Meiaka dan penulis. 2. Perpustakaan Universiti Teknikal Malaysia Melaka dibenarkan membuat salinan
untuk tujuan pengajian sahaja dengan izin penulis.
3. Perpustakaan dibenarkan membuat salinan laporan PSM ini sebagai bahan pertukaran antara institusi pengajian tinggi.
4. **Silatandakan(^)
n
n
0
SULIT TERHAD(Mengandungi maklumat yang berdarjah keselamatan atau kepentingan Malaysia sebagaimana yang termaktub dalam AKTA RAHSIA RASMI 1972)
(Mengandungi maklumat TERHAD yang telah ditentukan oleh organisasi/badan di mana penyelidikan dijalankan) TIDAK TERHAD
Disahkan oleh:
Alamat Tetap:
128 Blok F Felda Raja Alias 3. 72120 Bandar Seri Jempol. Negeri Sembilan.
Cop Rasmi:
MOHAMMAD KHAUD BIN WAHID
Jobatan Teknologi Kejuruteraan Pembuoton Fakulti Teknologt l^ejL^uleraan Universiti Teknikal Malaysia
Tarikh:
ii
DECLARATION
I hereby, declared this report entitled “The Development of Pressure Sensor for Piping System” is the results of my own research except as cited in references.
iii
APPROVAL
This report is submitted to the Faculty of Engineering Technology of UTeM as a partial fulfilment of the requirements for the degree of Bachelor in Manufacturing Engineering Technology (Process and Technology) (Hons.). The member of the supervisory is as follow:
iv
ABSTRACT
v
ABSTRAK
vi
DEDICATION
To my parents loved that never cease to teach me how to stand with their feet
but never tired to stand behind me and prayed that I managed to spend learning the
bachelor's degree level. Thanks also to my colleagues where you are constantly
helping me and encouraging me when are in distress. I wish a thousand thanks to
friends at home I never give up to provide translation and enlightening for me to
understand the problems that I have faced. I went through all this is a challenge to
myself to be successful in the future. Thanks goes to lecturers who have taught me,
since the first day I set foot in UTeM. Do not forget also to assistant engineer who
helped me during the workshop. In addition I also say thousands of thanks to the
people who helped me and I regard you all as a family on my own. We are all one
vii
ACKNOWLEDGEMENT
Bismillahirrahmanirrahim…
In the name of Allah, the Almighty who guide us to the truth, the knowledge and with regards to Prophet Muhammad S.A.W for guiding us to the light. I thank to Allah for giving me the chance to finish the writing of this report.
I would like to take this opportunity to express my appreciation to my supervisor, Mohammad Khalid bin Wahid for his kindness, advice and guidance to help me accomplish this project from day one and beyond. I cannot pay back for all his contributions were definitely helped me a lot in this project.
I would also like to thank all partners for their significant advice and help and also for my beloved one, who always supported me throughout this project and for helping me get through it. Just calm can repay all the kindness you all. Furthermore, I also thank my parents Mohd Salim Bin Abdulah and Normaizam Binti Abd Latif which helped a lot in terms of finance, advice and encouragement.
viii
TABLE OF CONTENTS
DECLARATION ... ii
APPROVAL ... iii
ABSTRACT ... iv
ABSTRAK ... v
DEDICATION ... vi
ACKNOWLEDGEMENT ... vii
TABLE OF CONTENTS ... viii
LIST OF FIGURES ... x
LIST OF TABLE ... xii
CHAPTER 1 INTRODUCTION Background ... 1
1.0 Problem Statement ... 4
1.1 Objective ... 4
1.2 Scope ... 5
1.3 CHAPTER 2 LITERATURE REVIEW Introduction of Diaphragm Pressure Sensor ... 6
2.0 Design of Diaphragm Structure ... 8
2.1 2.1.1 Flat Structure ... 8
2.1.2 Solid Bossed Structure ... 12
2.1.3 Hollow Bossed Structure ... 16
2.1.4 Peninsula Structure... 19
Comparison of Diaphragm Structure... 22
2.2 Material Used for Sensing Element ... 23
2.3 2.3.1 Properties of Material (Aluminium Alloy 6061) ... 24
ix CHAPTER 3
METHODOLOGY
Introduction ... 26
3.0 Design Selection ... 27
3.1 3.1.1 Project Design ... 28
3.1.2 Detail design... 29
Project Analysis ... 30
3.2 Project Manufacturing ... 31
3.3 CHAPTER 4 RESULT AND DISCUSSION 4.0 Introduction ... 33
4.1 Data analysis ... 34
4.1.1 Diaphragm thickness 1mm ... 35
4.1.2 Diaphragm Thickness 2mm ... 37
4.1.3 Diaphragm thickness 3mm ... 39
4.1.4 Diaphragm thickness 4mm ... 41
4.2 Comparison of Diaphragm Thickness ... 43
4.3 Discussion ... 45
CHAPTER 5 CONCLUSION AND RECOMMENDATION Introduction ... 47
5.0 Conclusion ... 47
5.1 Recommendation ... 48
5.2 Suggestion for Future Work ... 48
5.3 REFERENCES ... 49
APPENDICES Appendix A – FEA model theory ... 51
x
LIST OF FIGURES
FIGURE 1.1:DIAPHRAGM PRESSURE SENSOR. 1
FIGURE 1.2:PIEZO-ELECTRIC PRESSURE TRANSDUCER 2
FIGURE 2.1:DIAPHRAGM PRESSURE SENSOR 7
FIGURE 2.2:FLAT STRUCTURE DIAPHRAGM 8
FIGURE 2.3:SCHEMATIC OF A FLAT PRESSURE SENSOR DIAPHRAGM 9
FIGURE 2.4:ANALYTICAL NRL DIAPHRAGM DEFLECTION 10
FIGURE 2.5:ANALYTICAL PET DIAPHRAGM DEFLECTION 10
FIGURE 2.6:FREQUENCY RESPONSE CURVES USING THE VISCOUS FEM MODEL 11
FIGURE 2.7:SOLID BOSSED STRUCTURE 12
FIGURE 2.8:SENSITIVITY FOR DIAPHRAGM THICKNESS AND DEPTH 13
FIGURE 2.9:STRESS FOR A DOUBLE BOSS VS. FLAT DIAPHRAGM 13
FIGURE 2.10:STRESS THIN SECTION VS. THICKNESS OF DOUBLE BOSS DESIGN 14
FIGURE 2.11:RESONANT FREQUENCY VS. THICKNESS OF DOUBLE BOSS DIAPHRAGM 15
FIGURE 2.12:HOLLOW BOSS STRUCTURE 16
FIGURE 2.13:CROSS SECTIONAL SCHEMATIC VIEW OF A BOSS ETCHED 17
FIGURE 2.14:AREA OF MAXIMUM AND MINIMUM STRESS BETWEEN THE HOLLOW 17
FIGURE 2.15:THE RESISTOR POSITION ON THREE HOLLOW BOSSES ON A DIAPHRAGM 18
FIGURE 2.16:PENINSULA STRUCTURE 19
FIGURE 2.17:THE STRESS INTENSITY DISTRIBUTION FOR A MODEL OF THE SENSOR 20
FIGURE 2.18:STRESS DIFFERENCE FROM CENTRAL POINT TO DIAPHRAGM EDGE 20
FIGURE 2.19:STRESS AROUND THE NARROW BEAM OF THE PENINSULA STRUCTURE 21
FIGURE 2.20:LATCHE MACHINE PROCESSING 25
FIGURE 3.1:FLOW CHART OF THE PROJECT. 26
FIGURE 3.2:SELECTED DESIGN 28
FIGURE 3.3:DESIGN OF THE DIAPHRAGM PRESSURE SENSOR 29
FIGURE 3.4:LATHE MACHINE. 31
FIGURE 3.5:TURNING PROCESS. 31
xi
FIGURE 3.7:DRILLING PROCESS. 32
FIGURE 3.8:BORING PROCESS 32
FIGURE 4.1:DESIGN OF ANALYSIS 33
FIGURE 4.2:IMAGE OF ANALYSIS BASED ON DISPLACEMENT AND STRESS 34
FIGURE 4.3:STRESS AGAINST PRESSURE FOR 1MM THICKNESS 35
FIGURE 4.4:DISPLACEMENT AGAINST PRESSURE FOR 1MM THICKNESS 36
FIGURE 4.5:STRESS AGAINST PRESSURE FOR 2MM THICKNESS 37
FIGURE 4.6:DISPLACEMENT AGAINST PRESSURE FOR 2MM THICKNESS 38
FIGURE 4.7:STRESS AGAINST PRESSURE FOR 3MM THICKNESS 39
FIGURE 4.8:DISPLACEMENT AGAINST PRESSURE FOR 3MM THICKNESS 40
FIGURE 4.9:STRESS AGAINST PRESSURE FOR 3MM THICKNESS 41
FIGURE 4.10:DISPLACEMENT AGAINST PRESSURE FOR 2MM THICKNESS 42
FIGURE 4.11:STRESS AGAINST PRESSURE 43
FIGURE 4.12:DISPLACEMENT AGAINST PRESSURE 44
FIGURE 4.13:STRESS STRAIN GRAPH 45
xii
LIST OF TABLE
TABLE 1.1DIFFERENT TYPES OF PRESSURE SENSOR. ... 3
TABLE 2.1:PARAMETERS OF A REPRESENTATIVE PRESSURE SENSOR ... 11
TABLE 2.2:COMPARISON OF DIAPHRAGM STRUCTURE PERFORMANCE ... 22
TABLE 2.3:PROPERTIES OF MATERIAL ... 23
TABLE 2.4:COST OF THE MATERIAL PER KILOGRAM ... 24
TABLE 3.1:MANUFACTURING PROCESS OF DIAPHRAGM STRUCTURE. ... 27
TABLE 4.1:ALUMINUM PROPERTIES ... 34
TABLE 4.2:DATA OF THICKNESS 1MM ... 35
TABLE 4.3:DATA OF THICKNESS 2MM ... 37
TABLE 4.4:DATA OF THICKNESS 3MM ... 39
TABLE 4.5:DATA OF THICKNESS 4MM ... 41
1
CHAPTER 1
INTRODUCTION
Background 1.0
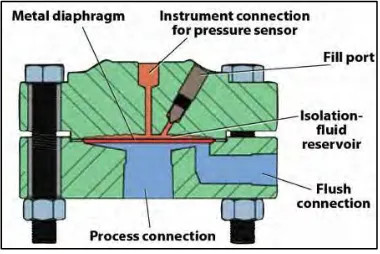
[image:14.595.224.414.541.668.2]Over the years technologies for measuring pressure have been developed. Each technology has its own strengths and weaknesses. The key design parameters of accuracy, long term stability, operating temperature range, and price are used to identify which type of pressure sensor is best suited for a particular task. There are technologies with sensors function and the technology includes the bellows, the diaphragm, and the bourdon tube. Piston technology uses a sealed piston to measure changes in pressure while mechanical deflection uses an elastic or flexible element to mechanically deflect with a change in pressure, for example a diaphragm and Bourdon tube. Figure 1.1 below show example one of the mechanical pressure sensing element technologies.
2
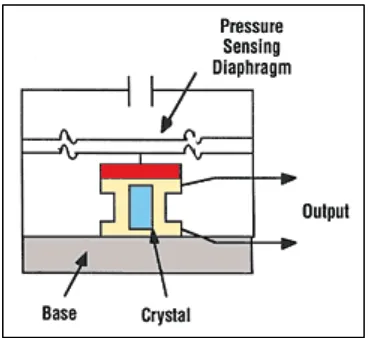
Piezo-electric pressure sensors as shown on figure 1.2 consist of ceramic materials which have naturally occurring electrical properties. They are capable of converting stress into an electric potential and vice versa. The operation are charge mode, which generates a high impedance charge output and voltage mode, which uses an amplifier to convert the high impedance charge into a low impedance output voltage. The sensors can only be used for verifying pressures.
[image:15.595.227.411.235.404.2]
Figure 1.2: Piezo-electric Pressure Transducer
3
The difficulty with pressure sensors lies primarily in choosing the best compromise between:
i. Price.
ii. Performance.
iii. Production technology.
iv. Used materials.
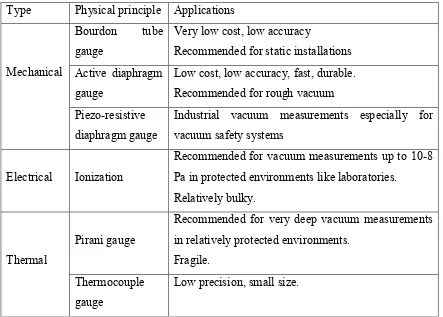
Microelectronic technology adapted to micro systems allows bold, highly integrated and very economic designs. In addition, the progress made in the quality of materials, and the increasing power of data processing, allows the simplification of the geometry of the sensing element. Thus, most pressure sensors today use cylindrical or diaphragm elements. Table 1.1 below shows that the different types of pressure sensor that normally used in industries. (Pavel Ripka, 2007)
Type Physical principle Applications
Mechanical
Bourdon tube
gauge
Very low cost, low accuracy
Recommended for static installations Active diaphragm
gauge
Low cost, low accuracy, fast, durable. Recommended for rough vacuum Piezo-resistive
diaphragm gauge
Industrial vacuum measurements especially for vacuum safety systems
Electrical Ionization
Recommended for vacuum measurements up to 10-8 Pa in protected environments like laboratories. Relatively bulky.
Thermal
Pirani gauge
Recommended for very deep vacuum measurements in relatively protected environments.
Fragile. Thermocouple
gauge
[image:16.595.107.550.379.696.2]Low precision, small size.
4
Problem Statement 1.1
Pressure sensor nowadays is more sensitive and advances but the more the more complex of production technology need for the production process. The sensitivity of the pressure sensor is not only depending on the type of the sensor but also the material use. So, this project will overcome the cost to manufacture the pressure sensor by using low cost of material which is aluminium but still can give the better result as a pressure sensor. Complexity of design in pressure sensor also adds the process to manufacture it where advance machining or advance engineering processes are need. So, to overcome the process of producing the pressure sensor, the conventional technology in process of production is considered compare of high production technology.
Objective 1.2
To overcome the problem of pressure sensor production, these are the objective of this project:
I. To design a pressure sensor using diaphragm system and aluminium
material.
5
Scope 1.3
There are will be 3 scopes carry out in this experiment and below are the scope:
1. Design of the pressure sensor is base on the diaphragm system using
aluminium material.
2. Design is draw using CAD software (CATIA) and the complete design of
pressure sensor is run for simulation, which is CAE software (HYPERWORK) to analysis the finite element. The finite element analysis conduct is only to analyze base on the mechanical characteristic of the diaphragm pressure sensor and not involve any of electrical function on it.
3. The process of manufacturing the pressure sensor is using of lathe machine
6
CHAPTER 2
LITERATURE REVIEW
Introduction of Diaphragm Pressure Sensor 2.0
At present time the semiconductor pressure sensors are most wide spread. These sensors consist of the thin diaphragm made from monocrystalline silicon as an elastic member and tensoresistors on the diaphragm as a sensitive member. The wide spread of the such sensors is caused by high quality of mechanical characteristics of monocrystalline silicon and high piezoresistive effect of silicon, the opportunity of sensor production by microelectronic technology methods. However, silicon diaphragm manufacturing technique contains nonplanar operations bilateral lithography and deep anisotropic etching of a silicon technological substrate.
7
[image:20.595.213.427.300.436.2]Sensors that measure the level of gas or liquid pressure employ an elastically deformable diaphragm, with an integrated sensing element. The measuring principle of these pressure level sensors can be divided into detecting resistance change, by attaching strain gauges on the surface of diaphragms, or detecting changes in the capacitance between the diaphragm and another electrode. The unification of pressure sensitivity can be achieved by replacement a diaphragm type principle of pressure sensor fabrication on a multiplicative principle. Multiplicative sensor includes a hard pressure concentrator of the greater area, which connected with the hard sensitive of the smaller area. The ratio of the greater area to the smaller area defines the pressure sensitivity.
8
Design of Diaphragm Structure 2.1
2.1.1 Flat Structure
[image:21.595.237.404.388.526.2]In the first approach, the diaphragm is usually modelled as a thin plate or a membrane as shown in Figure 2.2. A geometric compatibility condition of diaphragm that is continuous displacement when interface. In previous investigation the use of kinetic energy of the diaphragm relative to the air cavity distinguish the predominantly structural modes from the predominantly acoustic modes. It should be noted these models mostly focus on the free vibration problem and the viscous effect is neglected. For some small pressure sensors, when the air cavity is short, the large damping due to the squeeze film effect can significantly reduce the sensor band width, which is typically designed to be the flat region of the response spectrum below the fundamental natural frequency of the air backed diaphragm.
Figure 2.2: Flat structure diaphragm (Xian Huang, 2014)
9
of a large range from orders of magnitudes larger than the diaphragm size to orders of magnitudes smaller.
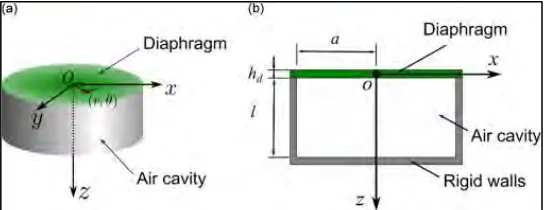
[image:22.595.183.458.340.445.2]For example, when the film thickness (i.e. the cavity length) is larger than or comparable to the diaphragm size, the pressure cannot be assumed to be uniform in the direction perpendicular to the film, and the air flow cannot be considered planar. Without loss of generality, consider a typical pressure sensor configuration shown in Figure 2.3, which consists of a circular diaphragm of radius (a) and thickness (h) and an air backed cylindrical cavity length (l). The circular diaphragm is modeled as a plate with in-plane tension. Depending on a normalized tension parameter, this diaphragm model can capture the behaviours of a pure plate with zero tension, a pure membrane with a large initial tension, and the in-between cases. (H.Liu et al., 2013)
Figure 2.3: Schematic of a flat pressure sensor diaphragm (Haijun Liu, 2013)
10
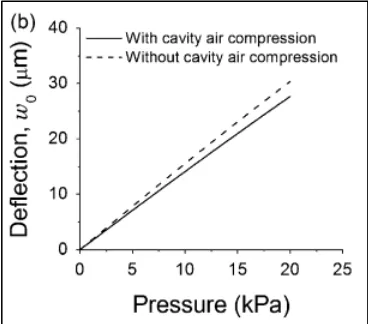
[image:23.595.225.413.174.345.2]In addition, Figure 2.4 shows the flexible NRL diaphragm deflection is significantly different according to whether the compressed air in the cavity is considered or not, where as a slight decrease in the deflection of the PET diaphragm is resulted by considering the air compression within the cavity shown in Figure 2.5.
Figure 2.4: Analytical NRL diaphragm deflection (Ho Young Lee, 2014)
Figure 2.5: Analytical PET diaphragm deflection (Ho Young Lee, 2014)
[image:23.595.226.410.397.559.2]11
Parameters of a representative pressure sensor
Diaphragm silicon
Young's modulus 169 GPa
Poisson's ratio 0.25
Density 2.3 103 kg/m3
Radius 500 μm
Thickness 0.5 μm
Pressure 1.01 105 Pa
[image:24.595.103.534.84.264.2]Sound speed 343 m
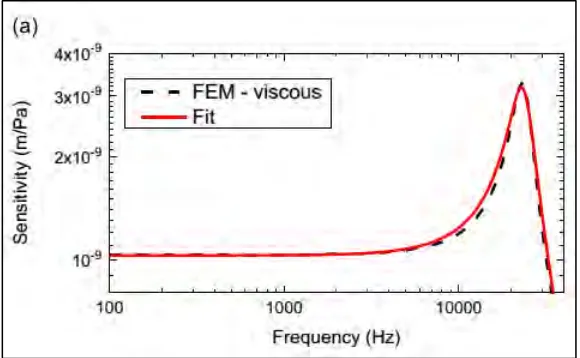
Table 2.1: Parameters of a representative pressure sensor
[image:24.595.174.464.461.640.2]When the air cavity is completely trapped in the boundary layer, the damping is approaching the critical damping. This result indicates that for a particular sensor configuration that the equivalent damping should be treated differently in the different cavity length regions. From the perspective of sensor design, there is no benefit to have a cavity length less than 0.04a, due to the reduced sensitivity and bandwidth as evidenced in the results shown in Figure 2.6.