Zinc isotopes as a tool to investigate zinc
biogeochemical cycling in the SW Pacific Ocean
Moneesha Samanta
May 2017
iii Declaration
iv
Acknowledgements
During this PhD, I got the opportunity to meet some amazing people for which I’ll always be grateful. This PhD would not have been possible without the involvement of these people.
First and foremost, I would like to convey my heartfelt gratitude to Michael Ellwood for his continued guidance, support and patience. Thank you, Michael, for being an outstanding supervisor and for helping me in so many ways. I could not have wished for a more understanding supervisor.
I would like to thank Graham Mortimer for all his advice and help in the laboratory. Thank you, Graham, for being such a great friend and guide.
My gratitude to Robert Strzepek for introducing me to the world of algal culturing and providing me with valuable suggestions.
The technical support and advice of Les Kinsley and Steve Eggins is much appreciated. I would like to thank the RSES student body, academic and administrative staff for being so helpful and making my time here an enjoyable one. Particularly, Sarah, Vikashni, Lucy, Scott, Aimee, Kate, Claire, Sareh, Ali, Graham, John, Ian, Jochen, Ulli, Maree.
I thank the Australian Government for the financial support. The ANU PhD Scholarship and RSES Supplementary Scholarship is gratefully acknowledged.
vi Abstract
Marine phytoplankton account for more than 40% of global primary production and hence play an important role in moderating global climate through ocean-atmosphere CO2 exchange. Zinc (Zn) is an essential micronutrient and plays an important role in the
carbon acquisition system within marine phytoplankton, thus, it has the potential to influence marine primary production. In seawater, Zn bioavailability is dependent on its concentration and its chemical speciation. The free Zn2+ ion concentration of the
surface ocean is usually in the low picomolar range with the potential to be growth limiting for some phytoplankton species.
The aim of this research is to better understand Zn cycling in the ocean and the
relationship between primary production and Zn bioavailability by exploiting variations in the Zn isotope composition of phytoplankton and seawater samples.
To realise this aim, a procedure was developed to measure the Zn isotope composition of marine samples. This procedure utilises the double spike (DS) technique in
conjunction with the pre-concentration of Zn from seawater to determine processes that influence the Zn biogeochemical cycling in the ocean. Seawater samples, collected as part of a 2010 GEOTRACES process study, contrasting oligotrophic waters of north Tasman Sea and the mesotrophic waters of south Tasman Sea, were analysed using this technique.
In this study, variability in δ66Zn of dissolved Zn is observed in the upper ocean (0-200
vii
values coincided with the chlorophyll maxima suggesting preferential uptake of lighter Zn isotopes by phytoplankton.
To complement the field work, a Tasman Sea isolate of the coccolithophore Emiliania
huxleyi was cultured across a range of free Zn2+ ion concentrations to determine the
extent of Zn isotope fractionation during Zn uptake. The laboratory results support the field observation that the resident phytoplankton community controls δ66Zn
composition of the upper water column in the south Tasman Sea.
The intermediate and deep waters of the south Tasman Sea have Southern Ocean origin. The Southern Ocean plays a significant role in the global carbon cycle
influencing both ocean circulation and biogeochemistry. Much of the surface waters of the Southern Ocean have low iron (Fe) bioavailability. I investigated the role Fe
limitation plays in Zn accumulation and Zn isotope fractionation by the Southern Ocean haptophyte Phaeocystis antarctica, a major component of the Southern Ocean phytoplankton assemblage. Under Fe-limiting condition an increased cellular quota for Zn (expressed as Zn:P) and heavier δ66Zn values within the cells is observed; Whereas,
cells grown under Fe-replete conditions have a lower Zn quota and a lighter δ66Zn
composition. Thus, Fe bioavailability could regulate the dissolved Zn isotope
composition of the Southern Ocean, which in turn would be reflected in other parts of the world ocean.
This study highlights the importance of carefully analysing phytoplankton community structure and the trace metal composition while interpreting δ66Zn composition of the
ix Table of Contents
Declaration ………..……… iii
Acknowledgements ……… iv
Abstract ……….. vi
List of Figures ………... xv
List of Tables ……….……….….. xx
Chapter 1: Introduction to marine zinc biogeochemistry and PhD thesis proposal ……… 1-19 Introduction ……….………... 1
1.1 Biological importance of Zn in phytoplankton ……… 1
1.2 Zinc biogeochemistry ……….. 3
1.3 Zinc isotopes and isotope fractionation ………. 8
1.4 Thesis aims and approach ………. 15
1.5 Thesis structure..……… 17
Chapter 2: A method for determining the isotopic composition of dissolved zinc in seawater by MC-ICP-MS with 67Zn-68Zn double spike……… 21-56 Abstract………. 21
2.1 Introduction ………. 23
2.1.1 Choice of double spike ………..25
2.1.2 Calibration of the double spike……… ……….. 28
x
2.1.4 The iterative solution method for calculation of δ66Zn of a sample... 32
2.1.5 Pre-concentration of trace metals from seawater………. 34
2.1.6 Ion exchange chromatography for Zn separation ………....…… 35
2.2 Experimental ……….37
2.2.1 Reagents ……….37
2.2.2 Preparation of the double spike ………37
2.2.3 Pre-concentration of trace metals ………..38
2.2.3.1 Optimising pH and elution efficiency………...……....39
2.2.4 Ion exchange chromatography for Zn separation ……….40
2.2.5 Isotope mass spectrometry ………..43
2.3 Results and Discussion ………..46
2.3.1 Solid phase extraction versus the solvent extraction technique …………46
2.3.2 Optimising loading pH for extraction and elution efficiency ……….. 46
2.3.2.1 Testing the use of HCl over HNO3 .…….…………...……..………… 46
2.3.2.2 Recovery versus pH ………..………….………. 49
2.3.3 Anion exchange chromatography ……… 50
2.3.4 Method Blanks ………..………. 51
2.3.5 Reproducibility ……… 51
2.3.6 Inter-calibration samples ……….….. 52
2.4 Conclusions ………54
Acknowledgements ………..……….. 55
xi
Chapter 3: Dissolved zinc isotope cycling in the Tasman Sea, SW Pacific Ocean
….………. 58-101
Abstract ….………58
3.1 Introduction ………..60
3.2 Experimental ……….65
3.2.1 Cleaning ………..65
3.2.2 Sampling ……….65
3.2.3 Biological measurements ………67
3.2.4 Procedure for dissolved Zn isotope analysis ……….68
3.3 Results and Discussion ………..71
3.3.1 Hydrography ………71
3.3.2 Biological data ………75
3.3.3 Dissolved Zn concentration and isotope results ………….……..………80
3.3.3.1 Biological control on Zn isotope fractionation and Zn speciation in the upper water column ……….… 89
3.3.4 Dissolved Zn and silicic acid ………..93
3.3.4.1 Zn*and 66Zn ………..………..……... 93
3.3.4.2 66Zn and 30Si ………..………. 96
3.4 Conclusions ………..…… 98
Acknowledgements ……….……….………..…….99
xii
Chapter 4: Zinc isotope fractionation by Emiliania huxleyi cultured across a range of free zinc ion concentrations ………. 103-135
Abstract ……….……….…….. 103
4.1 Introduction ……….. 105
4.2 Methods ………...108
4.2.1 Study organism and experimental design ………..……….108
4.2.2 Cleaning protocol ………..…109
4.2.3 Medium preparation ………..109
4.2.4 Growth rate measurement ……… 111
4.2.5 Measurement of photophysiological parameters …..……….………… 111
4.2.6 Cell sizing and cell density ………..112
4.2.7 Scanning Electron Microscope imaging ……….113
4.2.8 Cellular chlorophyll a measurement ……….. 113
4.2.9 Cell harvesting, Zn:P and Zn isotope determination …………..……..……114
4.2.10 Statistical analysis ……….….………. 117
4.3 Results and Discussion ………118
4.3.1 Specific growth rates and cell morphology ……….118
4.3.2 Photophysiology and cellular chlorophyll a concentration ……….121
4.3.3 Zn:P ratio and Zn isotope fractionation ……… 125
4.4 Conclusions ………... 133
Acknowledgements ……….. 134
xiii
Chapter 5: Variability in zinc isotope fractionation in Phaeocystis antarctica under iron replete and iron limiting conditions ……….137-179
Abstract ………..…..……….. 137
5.1 Introduction ………140
5.2 Methods ………144
5.2.1 Study organism and experimental design ..………144
5.2.2 Medium preparation ………....………..145
5.2.3 Growth rate measurement ………147
5.2.4 Photophysiological parameters ……….147
5.2.5 Cell sizing and cell density ………….……….. 152
5.2.6 Cellular chlorophyll a measurement ……….……….….. 152
5.2.7 Cellular Zn isotope composition and Zn and P concentrations .…….. 153
5.2.7.1 Cellular Zn and P concentrations .……….… 154
5.2.7.2 Cellular Zn isotope composition ………... 156
5.3 Results and Discussion ………157
5.3.1 Effect of Fe and Zn limitation on growth rates and cell morphology ………..157
5.3.1.1 Growth rates ……… 157
5.3.1.2 Cell morphology ………... 159
5.3.2 Effect of Fe and Zn limitation on photophysiological response and chlorophyll a concentration of cells ..………161
5.3.3 Effect of Fe and Zn limitation on Zn:P ratio and Zn isotope fractionation ………..………164
xiv
5.3.3.1.i Comparison with Zn:P ratio of natural phytoplankton
assemblages in the Southern Ocean and implications …………. 166
5.3.3.2 Zn isotope fractionation ……… 167
5.4 Conclusions ……….177
Acknowledgements ……….. 179
Chapter 6: Thesis Conclusions ………181-191 6.1 Summary ………...181
6.1.1 Chapter 2 ………. 181
6.1.2 Chapter 3 ………..182
6.1.3 Chapter 4 ………..183
6.1.4 Chapter 5 ………..185
6.2 General conclusions ……….……….. 187
6.3 Future research directions ………..188
xv List of Figures
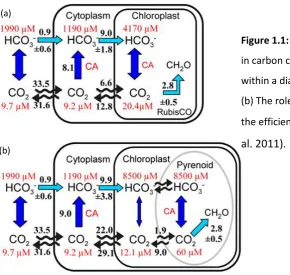
Figure 1.1: (a) The possible role of carbonic anhydrase in carbon concentration mechanism within a diatom cell. (b) The role of Pyrenoid in increasing the efficiency of CCM (Hopkinson et al. 2011) …………...……….3 Figure 1.2: Concentration profiles versus depth of dissolved (A.) Nitrate, (B.) Phosphate, (C.) Silicic acid and (D.) Zn in the central North Pacific and North Atlantic Oceans. Figure adapted from (Sunda 2012) …………...……….4 Figure 1.3: Schematic diagrams showing the Zn isotope mass balance in the global ocean with the inputs sources and outputs sinks. Figures adapted from (Little et al. 2014) and (Vance et al. 2016)………...………....……. 14 Figure 1.4 and 3.1: Maps of A. Seafloor bathymetry; B. Surface nitrate concentration; C. Particulate inorganic carbonate (PIC) concentration and; D. Chlorophyll a concentration of the three process stations (P1, P2 and P3) from which samples were collected for the dissolved Zn isotope work during the 2010 PINTS voyage. East Australian Current, Tasman Front and Subtropical Front are shown in the maps ……….………16 and 74
Figure 2.1: A 3D diagram showing the DS-sample mixing line, natural fractionation line (inset, magnified) and the instrumental fractionation line (mass bias) in 66Zn/64Zn, 67Zn/64Zn and 68Zn/64Zn space (X, Y and Z axes respectively)………26
Figure 2.2: Error magnification in calculating natural fractionation factor associated with varying relative proportion of 67Zn in 67Zn-68Zn DS, and DS in DS-sample mixture (Using MATLAB program by (Rudge et al. 2009)... 27 Figure 2.3: Calculated δ66Zn values of a sample with iteration steps.………..………….33
Figure 2.4: (a) Relative percentage recovery of Zn from the Toyopearl AF Chelate 650M resin for a deep seawater sample eluted with either 1 mol L-1 HCl or 1 mol L-1 HNO
3. (b)
xvi
deep seawater sample eluted from Toyopearl AF Chelate 650M resin using 1 mol L-1
HCl and 1 mol L-1 HNO
3………..….………...………..…47
Figure 2.5: δ66Zn values and concentration of dissolved Zn for replicates of a deep
seawater sample buffered at different pH before solid phase extraction………..…………49 Figure 2.6: Elution curves of different elements for anion exchange chromatography (using AG1X8 resin) loaded and washed with 0.5 mol L-1 HCl followed by elution with
0.5 mol L-1 HNO
3………..……….50
Figure 3.2. Profiles to 1500 m of: A. Temperature, B. Salinity, C. Dissolved oxygen, D. Si*, E. raw CTD fluorescence and F. a property-property plot of temperature versus salinity for process stations P1, P2 and P3 along with density lines for sigma-t of 26.8, 27.1 and 27.4....……….…………..75 Figure 3.3. Profiles of dissolved Zn, free Zn2+ ion and ligand concentrations for stations
A. P1, B. P2 and C. P3 versus depth from 0 to 500 m. Presented in adjacent panel is the
66Zn composition of dissolved Zn. Also present are the raw CTD fluorescence and
biomarker pigment data for each station. Free Zn2+ ion concentration, ligand
concentration and pigment data were taken from Sinoir et al. (2016) ………...78 Figure 3.3. (Chapter Appendix): The dissolved Zn, free Zn2+ ion and ligand
concentrations (from depth 0 to 500 m) of the three Process stations P1, P2 and P3 are shown in separate panels with different scales. Presented in adjacent panel is the 66Zn
composition of dissolved Zn of stations P1, P2 and P3 along with the deep ocean 66Zn
composition ……….……100 Figure 3.4. Seasonal variations in A. Picoeukaryotic (Picoeuk.) B. Synechococcus (Syn.) and Prochlorococcus (Pro.) cell abundance, C. Silicic acid concentration and D. Phosphate concentration versus depth for process station P1………..79 Figure 3.5: Profiles of A. dissolved Zn concentration, B. silicic acid concentration, and C. 66Zn versus depth. D. A property-property plot of Zn versus silicic acid
xvii
Figure 3.6: Property-property plots of 66Zn versus A. raw CTD fluorescence and B.
dissolved Zn concentration for process stations P2 and P3 between 0 and 200 m …..………...…84 Figure 3.7: Profiles of A. dissolved Zn concentration, B. 66Zn, and C. Picoeukaryote
and raw CTD fluorescence versus depth (in log scale) for process station P1 occupied in the 28-30 January 2010 (summer) and reoccupied on 20 May 2011 (late autumn)………..…92 Figure 3.7 (Chapter Appendix): Seasonal variation in A. dissolved Zn concentration, and B. 66Zn, versus depth for process station P1 ………..…….101
Figure 3.8: Profiles of Zn* versus depth for A. process stations P1, P2 and P3 and B. process station P1 occupied in the 28-30 January 2010 (summer) and reoccupied on 20 May 2011 (late autumn) ..……….94 Figure 3.9: Section of A. oxygen and B. salinity along the P11S line which extends into the Tasman Sea along 155 ˚E showing the different water masses in the Tasman Sea. A. Overlaying the oxygen section are the Zn* profiles for stations P1, P2 and P3. B. Overlaying the salinity section are density lines and Zn isotope profiles for stations P1, P2 and P3. ………...95 Figure 3.10: Property-property plots of 66Zn versus 30Si for samples collected
between 200 and 3500 m for station P3. The 30Si data is based on 29Si values
obtained by Cardinal et al (2005) for stations CTD17 and CTD24 located at the Subantarctic Zone at 46.9˚S and 48.8˚S, respectively at ~142˚E ………97
Figure 4.1: Variation in specific growth rates and cell size of E. huxleyi cultured across a range of free Zn2+ concentrations ……….………..119
Figure 4.2: Scanning electron microscope images of E. huxleyi cultured at different free Zn2+ concentrations; (a) pZn = 11.9, (b) pZn = 10.0 and (c) pZn = 8.5………..121
xviii
Pool; (c) the size of the functional absorption cross section of PSII and the size of the oxidised PQ pool; and (d) Variation in Chlorophyll a normalised per cell and per cell volume of E. huxleyi with increasing free Zn2+ concentrations ………123
Figure 4.4: The cellular Zn normalised to the P content of the cells of E. huxleyi (clone CS-1016; diamonds) compared with another clone of E. huxleyi (clone BT6; circles) (Sunda and Huntsman 1992) cultured across a range of free Zn2+ ion concentrations
………..……….125 Figure 4.5: (a) Zn isotope fractionation by E. huxleyi across a range of free Zn2+ ion
concentrations (unwashed/SOW washed cells and washed/oxalate-EDTA washed cells to remove extracellular Zn) compared to Zn isotope fractionation by the diatom
T. oceanica (John et al., 2007). (b) Specific Zn uptake rates (mol Zn (mol P)-1 day-1)
of E. huxleyi (clones CS-1016 (this study) and BT6 (Sunda and Huntsman 1992)) and
T. oceanica (clone CCMP 1005 (John et al., 2007) and clone 13-1 (Sunda and Huntsman
1992)) cultured across a range of free Zn2+ ion. ……….………130
Figure 4.5 (a) (Chapter Appendix): Zn isotope fractionation by E. huxleyi (corrected for relative difference between media and standard) across a range of free Zn2+ ion
concentrations compared to Zn isotope fractionation by the diatom T. oceanica (John et al., 2007) ……….….…135
xix
Figure 5.5: Variation in cellular biomass (obtained by multiplying cell volume with no. of cells per mL) of P. antarctica grown under high and low Fe and Zn conditions ……160 Figure 5.6: Variation in (a) Fv/Fm, (b) σPSII, (c) 1 and (d) 2 of P. antarctica grown under
high and low Fe and Zn conditions ………..……….……… 163 Figure 5.7: Variation in cellular chlorophyll a concentration (normalised to cell volume) of P. antarctica grown under high and low Fe and Zn conditions………. 162 Figure 5.8: Variation in cellular Zn normalised to P content in P. antarctica grown under high (+) and low (-), Fe and Zn conditions. (a)The Zn:P content of coccolithophore E. huxleyi under similar trace metal conditions is shown for comparison; (b) Variation in the Zn:P of natural phytoplankton assemblage (no Fe, no Zn) of the Southern Ocean with added (+) Fe and (+) Zn ; (data from (Cullen et al. 2003)) ……….……….………165 Figure 5.9: Zinc isotope fractionation by P. antarctica grown under high and low Fe and Zn conditions ……….……… 172 Figure 5.10: (a) Zinc isotope fractionation and (b) Zn:P ratio of P. antarctica cultured at a range of Fe’ concentrations (data from Grϋn 2016) ……….……….172 Figure 5.11: Schematic diagrams of alternate hypothesis hypothesis for observed heavy Zn isotopic composition of P. antarctica under Fe limiting (-Fe) conditions. (a) Release of isotopically light Zn in the late-exponential phase of growth in the Fe limited treatments due to cells being less robust than Fe replete (+Fe) treatments. (b) Uptake of isotopically heavy Zn by divalent surface Fe transporters in an attempt to scavenge Fe under Fe limiting conditions. In both senarios (a and b), lighter isotope of Zn is taken up by the cells in the Fe replete treatments………. 173 Figure 5.12: Profile of dissolved 66Zn versus depth, for process stations P1, P2 and P3
along with corresponding water masses (viz. Sub Antarctic Mode Water, Antarctic Intermediate Water and Circumpolar Deep Water) and the global deep ocean 66Zn
xx List of Tables
Table 1.1: Location of the three PINT stations sampled for Zn isotope analysis………….16
Table 2.1: Procedural steps involved in (a) extraction and (b) purification of dissolved Zn from seawater……….42 Table 2.2: Isobaric, doubly-charged and polyatomic interferences on Zn isotopes of interest………...45 Table 2.3: The cup configuration of the Thermo Finnigan Neptune Plus for Zn isotope determination……….45 Table 2.4: (a) Comparing variations in δ66Zn (‰) for a deep seawater sample
preconcentrated by Solvent extraction (using APDC and DDC as chelating agent) and Solid phase extraction (using Toyopearl AF Chelate 650M resin); (b) Comparing variations in δ66Zn (‰) for another deep seawater sample (1500 m) loaded onto
Toyopearl AF Chelate 650M resin using different sample loading buffers, MOPS buffer and ammonium acetate plus ammonium hydroxide buffer ……….………..……48 Table 2.5: Concentration and isotopic composition of Zn inter-calibration samples.……… 53 Table 2.6 (Chapter Appendix): Preparation of 67Zn-68Zn Double Spike………56
Table 3.1: Dissolved Zn isotope composition and concentration data for the process stations P1, P2 and P3 ………..………..85-88
Table 4.1: Effect of Zn on specific growth rates and cell morphology of E. huxleyi cultured across a range of free Zn2+ ion concentrations ……..………119
xxi
Table 4.3: Zn uptake and Zn isotope fractionation by E. huxleyi cultured accross a range of free Zn2+ ion concentrations………..……….126
Table 4.3 (Chapter Appendix): Zn isotope fractionation by E. huxleyi across a range of free Zn2+ ion concentrations. Δ66Zn relates Zn isotope composition of cells relative to
the media. The Zn isotope composition of the Zn added to the culture media is 0.06 ± 0.01 relative to the standard reference material (SRM) used to calculate 66Zn
cells. Since
the isotopic composition of the Zn added is similar to the SRM, no correction was made and the values for Δ66Zn
(cell-media) reported in the chapter is essentially 66Zncells. The
corrected Δ66Zn
(cell-media) are reported here by subtracting 0.06 from 66Zncells
………..……….135
Table 5.1: Photosynthetic parameters calculated by the LIFT-FRRF………….………151
Table 5.2: The specific growth rates of P. antarctica grown under high and low Fe and Zn conditions………..……… 158 Table 5.3: Effect of Fe and Zn limitation on cell morphology of P. antarctica …..……..160
Table 5.4. Effect of Fe and Zn limitation on Chlorophyll a concentration and photophysiological parameters of P. antarctica……… 163
Table 5.5: Effect of Fe and Zn limitation on cellular Zn and P incorporation of
1 Chapter 1:
Introduction to marine zinc biogeochemistry and PhD thesis proposal
1.1. Biological importance of zinc in phytoplankton
Marine phytoplankton are primary producers and form the base of the food chain. Of all primary productivity on earth, they account for about more than 40 % of the total (Falkowski 1994; Field et al. 1998). Thus, they play an important role in moderating the climate through the sequestration of carbon dioxide (CO2) by photosynthesis followed
by export of carbon to the deeper ocean. The trace metal micronutrient zinc (Zn) acts as the central metal in many enzymes within marine phytoplankton and so has a significant role in controlling the oceans primary production.
A major use of Zn by phytoplankton is in the enzyme carbonic anhydrase (CA) which catalyses the reversible hydration of carbon dioxide to bicarbonate and H+ ion.This
rapid conversion helps concentrate CO2 in phytoplankton chloroplasts, necessary for
efficient photosynthesis (Badger and Price 1994). Therefore this enzyme is critical to CO2 transport and fixation by phytoplankton (Christianson and Fierke 1996; Hopkinson
et al. 2011; Morel et al. 1994; Sunda and Huntsman 2005).
A probable model of how CA acts as a part of carbon concentrating mechanism (CCM) in diatoms was proposed by Hopkinson et al. (2011), (Figure 1.1). The diatom cell membrane is highly permeable to the non-polar molecules like CO2 and O2 but the
permeability is reduced for charged species like the HCO3- molecule. Since the
2
the abundant HCO3- to CO2 which can then diffuse into the cytoplasm (Milligan and
Morel 2002). Within the cytoplasm this CO2 is then converted back to HCO3- to prevent
the CO2 from escaping back to the bulk seawater medium. From the cytoplasm HCO3- is
actively transported across the chloroplast membrane into the chloroplast. Inside the chloroplast, HCO3- is converted back to CO2 by CA so that it can be fixed by the enzyme
ribulose-1, 5-bisphosphate carboxylase-oxygenase (RubisCO). The CO2 that diffuses
back into the cytoplasm from the chloroplast is recovered and converted back to HCO3
-by the CA in cytoplasm. According to Hopkinson et al. (2011), the presence of the pyrenoid (an organelle within the chloroplast where the CO2 fixating enzyme is
located) increases the efficiency of CCM (Figure 1.1 (b)). Since CA is confined within the pyrenoid there is little if any interconversion of HCO3- and CO2 within the chloroplast,
thus HCO3- can diffuse passively from the chloroplast into the proteinaceous pyrenoid
where it re-equilibrates. In the pyrenoid the CO2 concentration is raised and is
adequate for organic carbon production by RubisCO (Hopkinson et al. 2011). The high CA requirement for CCM highlights the importance of Zn in carbon acquisition by diatoms.
3 1.2. Zinc biogeochemistry
In seawater, the distribution of dissolved Zn is nutrient like with depletion in surface waters and higher concentrations at depth. The structure of the dissolved Zn
concentration versus depth profile is similar to that of silicate with deeper
regeneration relative to that other micro and macro nutrients (nitrate and phosphate; Figure 1.2), suggesting that Zn may be involved in either the uptake or the formation biogenic silica structures (opal) (Bruland et al. 1994; Hunter and Boyd 1999).
[image:25.595.123.414.66.341.2](b) (a)
Figure 1.1: (a) The possible role of CA
4
[image:26.595.52.385.59.582.2]
Figure 1.2: Concentration profiles versus depth of dissolved (A.) Nitrate, (B.) Phosphate, (C.)
5
Rueter and Morel (1981) observed that silicic acid uptake velocities for the marine diatom T. pseudonana were higher for cultures grown at higher Zn concentration. The uptake of silicic acid behaved in a similar way to the activity of alkaline phosphatase, a Zn dependent system. Silicic acid uptake rate and alkaline phosphatase activity were reduced when the free Zn2+ activity of the culture medium was reduced (Rueter and
Morel 1981). This observation suggests that Zn might mediate the uptake of silicon in diatoms through a Zn dependent silicon transporter (Rueter and Morel 1981).
Zinc, present as cofactor of the enzyme carbonic anhydrase, acts as a Lewis acid in the catalytic conversion of carbonic acid to CO2. An oxygen atom of the carbonic acid
donates its electron pair (via co-ordination bond) to the Zn atom thereby facilitating nucleophilic attack on the carbon atom bound to the oxygen atom. Silicic acid being analogous to carbonic acid may undergo similar nucleophilic attack on silicon atom in presence of a Lewis acid such as Zn (Sherbakova et al. 2005). In 2005, Sherbakova et al., proposed a model in which Zn2+ ion is chelated by the conserved motif of diatom
silicon transporters, SITs CMLD, to form a ternary complex with silicic acid (Grachev et al. 2005; Sherbakova et al. 2005). Thamatrakoln and Hildebrand (2008) tested this idea using a Zn specific membrane permeable chelator TPEN [N,
N,N’,N-tetrakis(2-pyriddylmethyl)ethylenediamine] at 10 fold molar excess to try and remove Zn from the SITs CMLD motif. However, they did not see any change in silicic acid uptake rates, but did note low free Zn2+ concentration inhibits growth of the cultures. These cultures
6
active in silicic acidabsorption on its own or in presence of Cu2+, Fe2+, Ni2+, Co2+, Cd2+
and Mn2+ ions. Contrastingly when PVI (poly vinyl imidazole) was substituted for PVA, it
did not show any silicic acid absorption. This results from PVI being less basic than PVA and q-PVI (poly 3-methyl-1-vinyl-imidazole-3-ium bromide) having a cationic group are not able to form complexes with Zn+2 ions. These results suggested a possibility of
complexed Zn2+ ions within SITs playing a role in assimilating silicon in SITs
(Danilovtseva et al. 2009).
7
2000). Vance et al. (2017) suggested that despite Zn and silicate being in different components of the diatom cell, is transported below the mixed layer in the deep Southern Ocean. As these water masses are laterally transported to the rest of the world oceans the biogeochemical signature of these two elements are also exported. This hypothesis was also supported by model simulations (Vance et al. 2017).
In natural aquatic environments, the interaction between phytoplankton and Zn is complex and depends on the concentration of Zn and its chemical speciation both of which affect Zn availability to phytoplankton. Also different phytoplankton species differ in their requirement for Zn and their response to Zn limitation and toxicity (Anderson et al. 1978).
In seawater the free Zn2+ ion concentration is highly dependent on Zn complexation to
natural organic ligands which determines Zn bioavailability (Anderson et al. 1978; Ellwood 2004; Ellwood and Van den Berg 2000; Sunda and Huntsman 1992). In the surface waters of the open ocean, approximately 98% of dissolved Zn is bound to strong organic ligands (Bruland 1989; Ellwood 2004; Ellwood and Van den Berg 2000; Jakuba et al. 2012; Sinoir et al. 2016b) with the remaining dissolved Zn available for uptake by phytoplankton. In the Southern Ocean, where there is upwelling of Zn rich waters the dissolved Zn concentration was in excess of the ligand concentrations (Baars and Croot 2011). The chemical species of Zn available for uptake by phytoplankton is the free Zn2+ ion (Anderson et al. 1978). However, it has been
suggested that Zn bound to weak complexes are bioavailable to the phytoplankton to some extent (Xu et al. 2012). In some parts of the surface ocean, the free Zn2+
8
air-sea CO2 exchange (Anderson et al. 1978; Brand et al. 1983; Sunda and Huntsman
1992).
1.3. Zn isotopes and isotope fractionation
Zinc has five naturally occurring stable isotopes: 64Zn, 66Zn, 67Zn, 68Zn and 70Zn with
natural abundances of 48.6%, 27.9%, 4.1%, 18.8% and 0.62%, respectively (Rosman 1972). Zinc isotopic fractionation is the process whereby one isotope becomes
enriched or depleted relative to a standard. Processes that can lead to isotope fraction can be physical, biological or chemical in nature (Bermin et al. 2006; Johnson et al. 2004; Pichat et al. 2003; Rosman 1972). These isotopic fractionation processes can be under kinetic or equilibrium control (Stewart 1975). It is represented by the following equation
([66Zn/64Zn]Sample – [66Zn/64Zn]Zn-standard )
[ 66Zn‰ = ––––––––––––––––––––––––––––––––––––––– X 1000 ] ... (1.1) [66Zn/64Zn]Zn-standard
Where, δ66Zn ‰ is the relative deviation of the 66Zn:64Zn ratio of the sample with
respect to a Zn standard (normally JMC Lyon Zn standard); expressed in parts per 1000.
Isotopic fractionation of Zn isotopes in the natural waters can occur as a result of variety of process, including complexation with organic ligands (Jouvin et al. 2009), biological uptake (Gelabert et al. 2006; John et al. 2007), and particle scavenging (John and Conway 2014). Therefore, knowing the potential processes that can lead to Zn isotope fractionation may facilitate its use as a biogeochemical tracer for
9
An example of biological processes leading to Zn isotopic fractionation has been observed in the marine diatom Thalassiosira oceanica and the chlorophyte Dunaliella
tertiolecta (John and Conway 2014; John et al. 2007) where, during Zn uptake the
lighter isotope, 64Zn, was preferentially taken up leading to a lower Zn isotope
composition within the cells relative to the media. Adsorption of Zn onto diatom cell surface has shown to lead to heavier isotopic composition (Gelabert et al. 2006; John et al. 2007). Quantum mechanical calculations suggest that more strongly bounded species prefer heavier isotopes (Criss 1999); therefore tetrahedral complexes with shorter bonds would be concentrated in 66Zn as compared to octahedral complexes.
The carboxylate species in the external polysaccharide layer of the diatom cell wall or protein side chains which form tetrahedral complexes with Zn2+ was shown, using
‘FITEQL thermodynamic modelling’, to be the dominant group in Zn2+ adsorption to the
diatom cell surface which explains the preferential adsorption of 66Zn relative to 64Zn
from the aqueous solution in which Zn2+ forms octahedral complexes with H 2O
molecule with longer Zn-O bond (Gelabert et al. 2006). Modelling of Zn isotope fractionation for co-existing Zn inorganic complexes in solution shows that Zn carbonate and bicarbonate complexes are isotopically heavy, whereas, Zn chloride complexes tend to be isotopically light (Fujii et al. 2014). However, Zn isotope
fractionations of Zn hydroxide and sulphate complexes are negligible at pH ≥ 8.1. This leads to an estimated negative 66Zn value for the free Zn2+ relative to the bulk
solution, though isotope fractionation is small (Fujii et al. 2014). In the open oceans >98% of dissolved Zn is bound to strong organic ligands so the remaining dissolved Zn available for uptake by diatoms is lighter. The diffusion of the lighter 64Zn is also faster
10
phytoplankton cells, even at low free Zn2+ concentrations (Bruland 1989; John et al.
2007). However, in a recent study looking at the effect of bioavailable Fe in Zn isotope fractionation by diatoms, Kӧbberich and Vance (2017) reported heavier Zn isotopic composition within the cells of the diatom species Chaetoceros at low bioavailable Fe concentration. At this limiting bioavailable Fe concentrations, the diatom grew at less than 60% of its maximum growth rate at ambient Fe concentration (Köbberich and Vance 2017) . The possible explanations put forward by Kӧberrich and Vance (2017), for the observed heavy Zn isotope composition of Chaetoceros species at low
bioavailable Fe concentrations are: (a) scavenging of heavy Zn by extracellular polymeric substances, and (b) slow Zn uptake rate leading to pseudo-equilibrium conditions at the transporter site where more stable surface complexes are formed with heavy Zn isotopes. However, for the diatom T. oceanica no such effect was observed and the diatom preferentially incorporated the lighter isotope of Zn even at very low bioavailable Fe concentration, although its growth was reduced by 50% of its maximum growth rate (Köbberich and Vance 2017).
Peel et al. (2009) reported that in a eutrophic lake, the Zn isotope composition of the settling particles were the lightest in the productive period and this Zn was chiefly associated with organic matter. This observation suggested that lighter Zn was preferentially taken up by phytoplankton (Peel et al. 2009).
Zinc isotope composition of ferromanganese (Fe-Mn) nodules (66Zn = 0.90 ± 0.28 ‰;
(Maréchal et al. 2000)), deep sea carbonates (66Zn = 0.91 ± 0.24 ‰; (Pichat et al.
2003)) diatom opal (66Zn = 1.03 ± 0.19 ‰; (Andersen et al. 2011)) and hexactinellid
11
record the Zn isotope signature of the seawater in which they were formed assuming no or little isotopic fractionation relative to the seawater. On the contrary, Zn isotope composition of demosponge spicule showed a wide range (66Zn = -0.35 to 1.04 ‰;
(Hendry and Andersen 2013)). This variation was theorised to be due to Zn isotope fractionation during internalisation of Zn from the particulate organic matter (POM) they feed on coupled with the wide range of Zn isotope composition of the POM (Hendry and Andersen 2013). It has also been suggested that the heavier Zn isotopic composition of seawater, reflected in the Fe-Mn nodules, biogenic carbonate and opal, could be due to uptake of lighter Zn by phytoplankton making the seawater dissolved Zn heavier (Andersen et al. 2011; Hendry and Andersen 2013; Pichat et al. 2003).
Zn isotope has also been used in geological record to determine resumption of primary production and hypothesise on the important sinks of Zn in the post-Marinoan ocean (John et al. 2017b; Kunzmann et al. 2013). Measurements of Zn isotopes in a
Neoproterozoic Nuccaleena cap dolostone, which serves as a proxy for past surface ocean Zn isotope composition, suggest that there was immediate resumption of primary production after snowball earth (Kunzmann et al. 2013). Heavier 66Zn value
(0.8 to 0.98 ‰) in the uppermost dolomite beds is proposed to be a result of removal of light Zn by biological material (John et al. 2017b; Kunzmann et al. 2013).The
variations in 66Zn of the cap dolostone (66Zn = 0.1 to 1.0 ‰) is explained by varying
12
though there may be an instantaneous isotope effect, could be attributed to closed-system behaviour where all of the Zn is precipitated in the presence of sulphide (John et al. 2017b).
However, until recently, only a few studies have investigated Zn isotope fractionation by phytoplankton and the evidence relating Zn isotope variations in the ocean due to biological activity has been weak. Measuring the dissolved Zn isotope composition is challenging due to contamination issues associated with the collection and handling of samples, the small range of isotope fractionation in natural waters, and the low Zn concentrations in surface waters. Advancements in analytical technique, including development of new generation resins for pre-concentration of trace metals from large volumes of seawater without introducing significant blank, along with the advent of the multi-collector inductively coupled plasma mass spectrometry (MC-ICPMS) have made it possible to measure the isotope composition of dissolved Zn. Recent studies have shown that the Zn isotope composition of the deep water is remarkably
homogeneous with a δ66Zn value of ~0.5 ‰ (excluding data near hydrothermal sources
and (margin) sediments which has lighter Zn isotopic composition) (Andersen et al. 2011; Bermin et al. 2006; Boyle et al. 2012; Conway and John 2014; Conway and John 2015; Conway et al. 2013; Little et al. 2014; Little et al. 2016; Zhao et al. 2014).
Whereas, the δ66Zn of upper water shows large variability; heavier dissolved Zn in the
surface ocean is associated with uptake of light Zn by phytoplankton and lighter dissolved Zn is attributed to scavenging of heavy Zn by sinking organic matter and/or release of light Zn from degrading phytoplankton (references as above).
The GEOTRACES programme, which is ‘an international study of the marine
13
facilitated access to wide range of seawater samples and enhanced our understanding of Zn isotope system in the ocean.
Despite the recent advancement and measurements of Zn isotopes in the marine realm, our knowledge of Zn isotope biogeochemistry is still limited. Little et al.(2014; 2016) put forward the oceanic mass balance of Zn isotopes compiling the isotopic composition of the different input sources (rivers, dust, hydrothermal fluids, and benthic) and output sinks (sediments including margin sediments, Fe-Mn oxides, biogenic carbonates and silicates (opal)) along with their estimated magnitude for the exchange fluxes between reservoirs (Figure 1.3). Most input sources have a Zn isotopic composition close to the lithogenic value of ≤0.3‰ which is lighter than the deep ocean (~0.5 ‰). This suggests that there are processes in the ocean that fractionates Zn making the isotopic composition of dissolved Zn heavier. The output sinks, except for margin sediments, are isotopically much heavier, suggesting that there is a large isotopically light Zn sink that is missing (Conway and John 2014; Little et al. 2014; Little et al. 2016). In a recent study by (Vance et al. 2016), which analysed Zn isotope
composition of seawater and sediments in the Black Sea, it is reported that the Zn isotopic composition of sediments is significantly lighter than the anoxic water above
66Zn
(anoxic deep water – euxinic sediment) = 0.6 ‰. Across the redoxcline in the Black Sea water
column, there is a shift in Zn speciation from oxide to sulfide species leading to
partitioning of the light Zn isotopes into these sulphide species. The partial removal of Zn sulphides from the dissolved pool results in heavier deep water and lighter
14
[image:36.595.56.456.132.653.2]seawater could explain the heavy Zn isotope composition of the deep ocean (Figure 1.3).
Figure 1.3: Schematic diagrams showing the Zn isotope mass balance in the global ocean with
the inputs sources and outputs sinks in the ocean. The Zn isotope compositions of the
lithogenic and seawater reservoirs are 0.3 (‰) and 0.5 (‰) respectively. Figures adapted from (Little et al. 2014) and (2016; Vance et al. 2016).
δ
15 1.4. Thesis aims and approach
The aim of this thesis is to determine the processes that influence the Zn cycling in the ocean and examine the role Zn plays facilitating marine primary production using Zn isotope composition of marine samples.
To understand the processes that lead to isotopic fractionation of Zn in the marine environment, measurement of the Zn isotopes in different oceanographic domains and in different phytoplankton species are necessary. My research focuses in
understanding Zn isotopic fractionation in the surface ocean due to Zn uptake by marine phytoplankton. To achieve this goal, I had to first, develop a method to
16
Figure 1.4: Maps of A. Seafloor bathymetry; B. Surface nitrate concentration; C. Particulate
inorganic carbonate (PIC) concentration and; D. Chlorophyll a concentration. Nitrate
[image:38.595.60.481.66.412.2]concentration data was extracted from the electronic version of the World Ocean Circulation Experiment database compiled by Schlitzer (2006). Surface chlorophyll and PIC data were extracted from the Aqua MODIS dataset via ERDDAP at NOAA (upwell.pfeg.noaa.gov/erddap/). The chlorophyll and PIC datasets cover the January-February sampling period during the 2010 PINTS voyage. P1, P2 and P3 denote the three process stations from which samples were collected for the dissolved Zn isotope work. The abbreviations EAC, TF and STF correspond to East Australian Current, Tasman Front and Subtropical Front, respectively.
Table 1.1: Location of the three PINT stations sampled for Zn isotope analysis.
Station ID Latitude (S) Longitude (E)
P1 30.0 165.0
P2 39.6 162.1
17 1.5. Thesis structure
The main chapters in this thesis are as follows:
In Chapter 2, I describe the method developed for determining the isotopic
composition of dissolved Zn in seawater by MC-ICP-MS using a 67Zn–68Zn double spike.
In this chapter, I document the mathematical and analytical procedures involved in determining the dissolved Zn isotopic composition of seawater using the double spike technique. The reproducibility and precision of this procedure along with the
measurements of GEOTRACES IC1 BATS and SAFe inter-calibration samples is reported.
In Chapter 3, I detail the dissolved Zn isotope profiles measured for the three biogeochemically distinctive sites in the Tasman Sea (Figure 1.4 and Table 1.1).
18
was a coccolithophore bloom at the south Tasman Sea site during sampling period which is corroborated by the Aqua MODIS calcite map.
In this chapter, I have explored the relationship between the dissolved Zn isotope composition of the surface waters and the resident phytoplankton community structure. Seasonality in Zn isotope fractionation in surface waters of the north Tasman Sea site is also discussed. Finally, I speculate on the relationship between the dissolved Zn and silicon isotopes in the deep ocean.
In Chapter 4, I examine the Zn isotope fractionation by a Tasman Sea isolate of cosmopolitan coccolithophore Emiliania huxleyi (CS-1016); cultured across a range of free Zn2+ ion concentrations encompassing the range observed in the world oceans.
Coccolithophores are marine phytoplankton species which produce calcium carbonate plates, thus they are important in the transport of both organic and inorganic carbon to the ocean’s interior. They are one of the major primary producers and are
widespread across the global oceans. Thus, understanding the influence of Zn on
E. huxleyi, a globally significant species, is important.
This work also complements the dissolved Zn isotope results of the surface waters at the south Tasman Sea site. I have further analysed the influence of Zn on growth of
E. huxleyi specifically, specific growth rates, cell morphology and photophysiological
19
In Chapter 5, I investigatethe effect of Fe and Zn limitation on growth (specific growth rates, photophysiology and cell morphology), Zn uptake and Zn isotope fractionation of the Southern Ocean haptophyte Phaeocystis antarctica.
The south Tasman Sea is characterised by water masses which has Southern Ocean origin (Sokolov and Rintoul 2000). The Southern Ocean connects the Atlantic Ocean, the Indian Ocean and the Pacific Ocean (Talley 2013). It also plays a crucial role in controlling many global oceanic processes which are reflected in other parts of the global ocean (Sarmiento et al. 2004; Sloyan and Rintoul 2001). Thus the Southern Ocean significantly influences both ocean circulation and biogeochemistry and plays an important role in the global carbon cycle (Sarmiento et al. 1998). To understand Zn isotope biogeochemistry in the Southern Ocean, measuring Zn isotope fractionation by Southern Ocean phytoplankton under relevant conditions is important. The
haptophyte Phaeocystis antarctica form a major component of the Southern Ocean phytoplankton assemblage (Arrigo et al. 1999). Since large parts of the Southern Ocean are iron limited potentially limiting phytoplankton growth (Boyd et al. 2000; Martin 1990), I investigated Zn accumulation and Zn isotope fractionation by P. antarctica under Fe limiting conditions.
21 Chapter 2:
A method for determining the isotopic composition of dissolved zinc in seawater by MC-ICP-MS with 67Zn-68Zn double spike.
Moneesha Samanta, Michael J. Ellwood and Graham E. Mortimer1
Abstract
The biogeochemical cycling of dissolved zinc (Zn) in seawater is dominated by
biological uptake in the surface ocean and its regeneration at depth leading to a large concentration gradient between the surface and deep ocean. The advent of multi-collector inductively coupled mass spectrometry (MC-ICP-MS) provides the marine community with a new way of probing the biogeochemical Zn cycle through changes in its isotope composition. In this chapter, we document the mathematical and analytical procedures involved in determining the dissolved Zn isotopic composition of seawater using the double spike (DS) technique. Seawater samples were spiked with a 67Zn-68Zn
DS before processing. Measurement of Zn by the MC-ICPMS requires the sample to be free of the seawater matrix and other interfering elements; for this purpose, Toyopearl AF-Chelate 650M and AG1X8 resins were used to pre-concentrate Zn from seawater and separate it from major cations and anions. The optimum pH range for loading Zn for affinity chromatography was between 5 and 8. After pre-concentration, Zn was purified from other trace element by anion exchange chromatography. The
reproducibility of the procedure was excellent for a deep seawater sample [6.55 ± 0.34
22
nmol L-1 and 0.59 ± 0.02 ‰ (n = 9) w.r.t JMC-Lyon] and a shallow seawater sample
[0.05 ± 0.01 nmol L-1 and 0.08 ± 0.02 ‰ (n = 3). w.r.t JMC- Lyon] analysed over a period
23 2.1. Introduction
Zinc acts as cofactors in many important enzymes within marine phytoplankton and hence plays a significant role in controlling the biology of oceans (Morel and Price 2003). Thus, changes in its bioavailability may influence biological production and hence the marine carbon cycle. Isotopic fractionation of Zn isotopes in the natural waters can occur as a result of a variety of process, including complexation with organic ligands (Jouvin et al. 2009), biological uptake (Gelabert et al. 2006; John et al. 2007), and particle scavenging (John and Conway 2014). Therefore, knowing the potential processes that can lead to Zn isotope fractionation may facilitate its use as a biogeochemical tracer for oceanographic research.
The mass dependent fractionation of Zn isotopes in nature is relatively small (Cloquet et al. 2008) and hence requires accurate and precise Zn isotope determination, which can be achieved by using the Multi Collector Inductively Coupled Plasma Mass
Spectrometry (MC-ICPMS) (Bermin et al. 2006; Shiel et al. 2009). One disadvantage of MC-ICPMS is that instrumental mass bias occurs, whereby a measured isotope ratio is different to the “true” isotope ratio. These deviations can occur during: (1) ionization within the plasma; (2) mass separation and; (3) ion detection. Mass bias can vary significantly with MC-ICPMS and is dependent on the instrument settings and time (Walczyk 2004).
24
conventional standard bracketing; b) doping samples with copper of an known isotope composition and; c) Zn double spike correction.
a) The conventional method of standard bracketing involves running a Zn standard with a known isotopic composition before and after every sample measurement. This requires the samples and the standard to have similar mass bias behaviour and also relatively stable mass bias with time (Archer and Vance 2004).
b) To further account for mass bias samples during Zn isotope analysis samples are usually doped with copper of a known isotopic composition (Archer and Vance 2004; Jouvin et al. 2009; Maréchal et al. 1999; Mason et al. 2004). This approach assumes similar mass bias behaviour of Zn and copper. Also for precise
relationships between the mass bias behaviour of Cu and Zn, the mass bias must be sufficiently variable within one analytical session. While this procedure generally works well mass bias can still occur and not be adequately accounted for (Bermin et al. 2006).
c) The double spike (DS) technique can be used to circumvent these issues. The DS technique involves spiking the sample with a mixture of two artificially enriched isotopes of the target element of a known isotope composition (Arnold et al. 2010; Bermin et al. 2006; Siebert et al. 2001). The DS method is only suitable for elements which have four or more naturally occurring stable isotopes. Zn has five stable isotopes
64Zn, 66Zn, 67Zn, 68Zn and 70Zn with natural abundances of 48.6%, 27.9%, 4.1%, 18.8%
25
with the ion exchange resin and during the elution process (Maréchal and Albarède 2002). These fractionation processes can be corrected for by adding the DS to the sample before processing. Thus, full recovery of element during sample preparation is not essential, although it is desirable.
2.1.1. Choice of double spike
To minimize error magnification on the natural isotope fractionation factor and for proper working of the DS, the isotope composition of the spike should be as different from the sample or standard as possible (Figure 2.1). Thus, 67Zn and 68Zn with natural
isotopic abundances 4.1% and 18.8%, respectively, were chosen for the DS. The minor isotope 70Zn was not chosen for the DS because it was not possible to measure both 70Zn and 62Ni with the available cup settings in the instrument used. 62Ni was measured
to monitor isobaric interference of 64Ni on 64Zn. Spectral interference on 70Zn from 70Ge can also be a potential problem. The optimum 67Zn-68Zn DS composition and
26
0
5
10
15
20
25
30
35
0.54
0.56
0.58
0.60
0.62
0.64
0.66
0
2
4
6
8
10
12
14
16
68
Zn/
64
Zn
66Zn/64Zn
67
Zn/
64
Zn
Corrected Standard [image:48.842.59.603.71.477.2]Corrected DS Measured Standard 0.3723 0.3724 0.3725 0.3726 0.3727 0.3728 0.3729 0.3730 0.3731 0.5635 0.5636 0.5637 0.5638 0.5639 0.5640 0.08186 0.08188 0.08190 0.08192 0.08194 0.08196 0.08198 0.08200 0.08202 0.08204 68 Zn / 64 Zn 66Zn /64Z n 67 Zn/ 64Zn Measured DS
Figure 2.1: A 3D diagram showing
the DS-sample mixing line, natural fractionation line (magnified; inset) and the instrumental fractionation line (mass bias) in 66Zn/64Zn, 67Zn/64Zn and 68Zn/64Zn space (X, Y
and Z axes respectively). To
27
Figure 2.2: (A) Contour plot showing error magnification in calculating natural fractionation factor (α) associated with varying relative proportion of 67Zn in
67
Zn-68Zn DS, and DS in DS-sample mixture; The symbol (x) gives the proportions at which the uncertainty in estimation of α is at a minimum. Error in α (1SD) associated with different relative proportion of (B) 67Zn in 67Zn-68Zn double spike and (C) double spike in double spike-sample mixture. Figures drawn using the MATLAB program by (Rudge et al. 2009)
(B)
28 2.1.2. Calibration of the double spike
In this study, the Zn DS was calibrated against the certified Zn standard IRMM-3702 utilising an in-house copper standard (Fluka, USA) to correct for mass dependent fractionation of Zn during the initial DS calibration. At the start of each analytical session mass dependent fractionation of the Zn standard in the MC-ICP-MS was corrected using copper by applying the exponential mass bias expression (Arnold et al. 2010).
Ra/b = ra b⁄ (mma
b)
P
(1)
Where (Ra/b) is the true ratio of isotopes a and b, (ra/b) is the measured ratio, ma/mb is
ratio of the atomic masses for a and b and P is the exponential mass fractionation factor.
The following steps were undertaken to calibrate the DS solution at the start of each session:
1. An IRMM-3702 Zn standard solution (100 µg L-1) containing copper (50 µg L-1) was
measured by MC-ICP-MS.
2. Based on the measured copper isotope values, the exponential fractionation factor (P′) was determined and used to calculate instrumental mass bias
P′ = ln( Cu 63 Cu 65 true Cu 63 Cu 65 measured ⁄ )
ln(62.9296 64.9280⁄ ) (2)
3. The newly calculated P′ was then used to correct the measured 66Zn/64Zn isotope. If
29
IRMM-3702 ratio, P′ was adjusted until they agreed. This new fully corrected exponential fractionation factor was termed P.
4. Using the new P factor the copper isotope composition in the IRMM-3702 standard solution was recalculated.
5. Next a DS solution (100 µg L-1) containing the same copper standard (50 µg L-1) was
measured by MC-ICP-MS.
6. Based on the newly calibrated copper isotope composition and the measured copper isotope value for the DS solution, a fractionation factor was calculated and used to correct measured Zn isotope ratios (64Zn/68Zn, 66Zn/68Zn, 67Zn/68Zn and 66Zn/64Zn) for the DS.
This procedure of calibrating the DS was undertaken at the beginning of each analytical session (Arnold et al. 2010). The Zn isotope composition of natural samples was
determined using the DS method and solved iteratively. The mass balance equations and how they were used and solved are detailed below.
2.1.3. Isotope dilution equation
If we consider a standard (Std) or a sample (Sa) – spike (Sp) mixture (Mix), the Zn isotope composition of the mixture will be equal to the total amount of Zn in the sample plus the spike.
Whereby,
ZnMix
67 = Zn
Sa
67 + Zn
Sp
30 And
ZnMix
68 = Zn
Sa
68 + Zn
Sp
68 (4)
Thus
ZnSp
67 = Zn
Sp
68 ×67ZnSp
ZnSp
68
⁄ (5)
ZnSa
67 = Zn
Sa
68 ×67ZnSa
ZnSa
68
⁄ (6)
Combing equations 3 and 4 we can write following equation:
Z 67 n Mix Z 68 n Mix=
ZnSa+67ZnSp 67
ZnSa+68ZnSp
68 (7)
Rearranging equation 7 we get:
Z
67 n
Mix
Z
68 n
Mix× ( ZnSa+ ZnSp
68
68 ) = Zn
Sa+ 67ZnSp 67
(8)
Combining equation 8 with equations 5 and 6 gives:
Zn
67
Zn
68 Mix ×68ZnSa+ Zn
67
Zn
68 Mix ×68ZnSp= 68ZnSa× Zn
67
Zn
68 Sa +68ZnSp×
Zn
67
Zn
68 Sp
(9)
This can be rearranged and simplified to give:
ZnSa
68 (67Zn Zn
68 Mix −
Zn
67
Zn
68 Sa ) = 68ZnSp( Zn
67
Zn
68 Sp −
Zn
67
Zn
68 Mix ) (10)
31 ZnSp 68 ZnSa 68 = ( Zn 67 Zn 68 Mix −
Zn 67
Zn 68 Sa )
( Zn
67 Zn 68 Sp −
Zn 67
Zn 68 Mix )
= Q (11)
We can write a similar equation whereby,
ZnSp 68 ZnSa 68 = ( Zn 66 Zn 68 Mix −
Zn 66
Zn 68 Sa )
( Zn
66 Zn 68 Sp −
Zn 66
Zn 68 Mix )
= Q (12)
Combining equations 11 and 12 gives:
( Zn
66 Zn 68 Mix −
Zn 66
Zn 68 Sa )
( Zn 66 Zn 68 Sp− Zn 66 Zn 68 Mix )
=
( Zn
67 Zn 68 Mix −
Zn 67
Zn 68 Sa )
( Zn 67 Zn 68 Sp− Zn 67 Zn 68 Mix )
(13)
If we generalise equation 13, the following isotope dilution equation can be written:
(Mix1−Sa1) (Sp1−Mix1) =
(Mix2−Sa2)
(Sp2−Mix2) (14)
Where, 1 and 2 denotes isotopic ratios with the same denominator.
Rearranging equation 14 the Sp1 ratio can be expressed as follows:
Sp1 = Mix1 −(Sa1−Mix1)×(Mix2−Sp2)
(Sa2−Mix2) (15)
And the Sa1 ratio in equation 14 can be expressed as:
Sa1 = Mix1 + (Mix1−Sp1)×(Sa2−Mix2)
(Mix2−Sp2) (16)
Following equation 15, we can express equation 13 as:
Zn
67
Zn
68 Sp =
Zn
67
Zn
68 Mix −
( Zn
67 Zn 68 Sa −
Zn 67 Zn 68 Mix)×( Zn 66 Zn 68 Mix −
Zn 66 Zn 68 Sp) ( Zn 66 Zn 68 Sa −
Zn 66
Zn
68 Mix)
32
And if we consider the ratios 1 and 2 to be 66Zn/64Zn and 68Zn/64Zn respectively,
equation 16 can be written as:
Zn
66
Zn
64 Sa =
Zn
66
Zn
64 Mix +
( Zn
68 Zn 64 Sa −
Zn 68 Zn 64 Mix)×( Zn 66 Zn 64 Mix −
Zn 66 Zn 64 Sp) ( Zn 68 Zn 64 Mix −
Zn 68
Zn
64 Sp)
(18)
This equation can be further manipulated to give:
Zn
66
Zn
64 Sa =
Zn
66
Zn
64 Mix +
( 1
Zn
64 ⁄68ZnSa−
1 Zn
64 ⁄68ZnMix)×( Zn 66
Zn 64 Mix −
Zn 66 Zn 64 Sp) ( 1 Zn
64 ⁄68ZnMix−
1 Zn
64 ⁄68ZnSp)
(19)
2.1.4. The iterative solution method for calculation of δ66Zn of a sample
To calculate the δ66Zn composition of samples spiked with the DS, we used an iterative
process. The traditional iterative solution method to calculate the natural isotope ratios of the sample can be used to review the calibration of the DS. It also allows us to see the propagation of an error through each iterative cycle. For a standard- or
sample-DS mixture, the 67Zn/68Zn ratio of the double spike (67Zn/68Zn
DS) in each
measurement cycle was estimated using isotope dilution equation 17. Once an estimate of 67Zn/68Zn
DS ratio was obtained, the mass fractionation factor (PMix) was
calculated using equation 2 but recomposed for the 67Zn/68Zn
DS ratio. This PMix factor
was then used to correct the measured Zn ratios for 64Zn/68Zn
mix, 66Zn/68Znmix, 67Zn/68Zn
mix, and 66Zn/64Znmix. Using these corrected ratios, the 66Zn/64Znsample ratio was
calculated using equation 19. Based on this newly calculated ratio a second mass fractionation factor (Psample) was calculated using equation 2 but recomposed for the 66Zn/64Zn
33
equal to the measured IRMM-3702 standard (but without added DS) along with the other measured isotope ratios required in equation 19. Using this Psample value, the
ratios for 64Zn/68Zn
sample, 66Zn/68Znsample, 67Zn/68Znsample were all corrected. This
procedure constituted one sample loop. These steps were then repeated until the corrected mixture and samples isotope ratios converge to a constant value. Most isotope ratios converged within 3 to 5 iterations (Figure 2.3). Finally, the 66Zn/64Zn ratio
was expressed in delta notation using the following equation:
δ Zn = ( Zn
66 ⁄64Zn
sample
Zn
66 ⁄64Zn
IRMM−3702
− 1) × 1000
66
(20)
All Zn isotope measured in the study are relative to the standard reference material IRMM-3702. This standard has an offset of -0.30 ± 0.01 (‰) from the Johnson Matthey (JMC) Lyon Zn standard, the traditional Zn isotope reference material (Archer et al. 2017; Cloquet et al. 2008; Moeller et al. 2011; Moynier et al. 2017).
Figure 2.3: Calculated δ66Zn values (w.r.t. IRMM-3702) of a sample with iteration steps. Error
34
2.1.5. Pre-concentration of trace metals from seawater
Three different Zn pre-concentration techniques to separate seawater matrix from trace metals have been reported.
The solvent extraction method involves the addition of a hydrophilic chelating agent, usually a dithiocarbamate-based molecule, to the seawater which becomes
hydrophobic when bound to a transition metal. The hydrophobic
metal-dithiocarbamate species is then extracted from the hydrophilic phase by partitioning it into a hydrophobic solvent (Bruland et al. 1979; Danielsson et al. 1982). The organic phase is collected and nitric acid is added to decompose the metal-dithiocarbamate complex. Upon decomposition of the complex, the free uncomplexed trace metal ions are partitioned back into the hydrophilic nitric acid phase. Though this technique has the advantage of being quick and easy to undertake, the major disadvantage is the potential interference of sulphur (32S
2) from the dithiocarbamate molecule on
measurement of 64Zn.
The co-precipitation technique involves the addition of a base (e.g. ammonium hydroxide) to the seawater to form a precipitate of magnesium hydroxide. As the precipitate forms, other trace elements are co-precipitated from the seawater matrix. The precipitate is separated from the supernatant liquid and further processed to separate Zn from magnesium by ion exchange chromatography. The main
disadvantage of this process is the potential interference of the polyatomic species
24Mg40Ar on 64Zn if magnesium is not fully removed (Bermin et al. 2006). Recently this
35
Zn concentration. However, the major drawbacks are relatively low recovery (70-90 %) and Zn blanks from aluminium solution (Zhao et al. 2014).
The solid phase extraction technique is an ion exchange chromatographic process whereby transition metals are complexed to a cation exchange resin, usually with iminodiacetate functional group, which forms a strong bond with polyvalent metal ions. When pH buffered seawater is passed across the resin the major elements are eluted out while transition metal ions are retained. These metal ions are eluted from the column at low pH. The extraction efficiency of Zn from seawater using this technique is reported to be 100.8 ± 0.7 % (n = 5) (Bermin et al. 2006). A major disadvantages of this technique is that it retains a large amount of calcium and magnesium on the resin along with the trace metal of interest (Bermin et al. 2006; Bruland et al. 1979). In recent past, development of new generation resins with quantitative recovery and low blank have made it possible to pre-concentrate Zn from large volumes of seawater (Conway et al. 2013; Takano et al. 2017).
2.1.6. Ion exchangecChromatography for Zn separation
After the preconcentration of Zn from seawater, it needs to be separated from other elements that could potentially interfere within the mass spectrometer. The procedure proposed by Maréchal and Albarède (2002) for the purification and separation of Zn from other trace elements involves use of a strong basic anion exchange resin, with a styrene divinylbenzene copolymer matrix and R-CH2N-(CH3)3 functional group
36
these conditions Zn forms an anionic chlorocomplex (ZnClx2-x) that reversibly
exchanges Cl- ions bound to the positively charged quaternary ammonium group,
R-CH2N+H(CH3)3, of the resin. Elements are eluted from the resin by passing hydrochloric