99
Published By:
Blue Eyes Intelligence Engineering & Sciences Publication
Retrieval Number: G10240587C219/19©BEIESP
Abstract— In this research, the hammering test method was employed to estimate the dynamic elastic modulus and void ratio of the natural transverse and longitudinal frequency for pervious concrete (PEC, porous concrete). The relationships between the natural frequencies, elastic modulus, and void ratio of PEC are examined and analyzed. Based on the experimental results, it was clarified that the natural frequencies measured via hammering test are negligibly affected by both the impact surface roughness of PEC and the impact force of the inspection hammer. Instead, the natural frequencies are more significantly affected by the void ratio of PEC. The results also found that the relationship between the natural frequencies and void ratio can be approximated using quadratic functions, while the relationship between the dynamic elastic modulus and void ratio of PEC can be approximated with linear functions. Overarchingly, the results and analyses confirm that the hammering test is an accurate method for evaluating the void ratio and elastic modulus of PEC.
Index Terms— Elastic modulus, Pervious concrete, Quality evaluation, Void ratio
I. INTRODUCTION
Pervious concrete (PEC, porous concrete [1], no-fine concrete [2]) has received much attention in recent years due to its variety of applications and notable performance in permeability, water absorption, water purification, greening, and so on. The application fields of PEC differ significantly from ordinary concrete due to its large amount of continuous voids [3]. The void ratio (volume percentage of voids) is one of the most important properties of PEC, as it influences characteristics, such as strength, permeability, water retention, and water wicking. However, the void ratio prone to fluctuation during on-site PEC construction due to inconsistent degrees of compaction. Hence, quality evaluation of PEC just after construction is extremely important. Under typical circumstance, the post-construction quality evaluation of PEC is performed using core specimens obtained from the constructed structures. However, the core specimens are difficult to extract and defects may occur induced in structures after coring. Therefore, an easier and more accurate method for quality evaluation is necessary.
To address this problem, we have propose a simple method for estimating the void ratio of PEC using a non-destructive test. Previous researche [4], [5] reports that there is a correlation between the elastic modulus and void ratio of PEC. Therefore, it may be possible to estimate the void ratio by measuring the elastic modulus. For PEC, the dynamic
Revised Manuscript Received on May 29, 2019.
E Ridengaoqier, Division of Systems Engineering, Graduate School of Engineering, Mie University, Tsu, Japan. (aoqier1991@yahoo.co.jp)
Shigemitsu Hatanaka, Division of Architecture, Graduate School of Engineering, Mie University, Tsu, Japan. (hatanaka@arch.mie-u.ac.jp)
elastic modulus can be estimated from natural frequencies, which are measured using an impact resonance test, as described in ASTM C215 [6]. For conventional concrete, the impact resonance test is relatively easy to carry out because the surface of the test specimen is almost uniform, which means the impacted area is well-defined. For PEC, however, the surface of the specimen is not uniform due to large voids, which causes uncertainty in its measured frequencies [7].
The hammering test is a potent non-destructive test to evaluate the natural frequencies of concrete based on the sound generated by hitting the specimen with a hammer. This test is considered very effective even for PEC with non-uniform surfaces.
In this research, we employ the hammering test method to measure the dynamic elastic modulus and void ratio of PEC. The natural frequencies, elastic modulus, and void ratio of PEC are examined and analyzed.
II. EXPERIMENTAL PROCEDURES
A. Experimental Factors
Table Ⅰ lists the experimental factors and testing levels considered in this research. For the experiment, the PEC was designed to include four void ratios: 0%, 15%, 25%, and 35%. To control for the striking force of the inspection hammer, the swing angle of the hammer was set to 10° and 20° (see Ⅱ.D. (2)). Both the top and side surfaces of the specimens were struck by the hammer.
B. Material Properties and Mix Proportions
Table Ⅱ presents the properties of the materials used in the experiment. Number 6 crushed stone (5-13 mm), which is one of the single-particle-sized crushed stone specified in JIS A 5001 [8], was used as a coarse aggregate, while ordinary Portland cement was used for the cement. A high-range water-reducing AE agent (HAE) and thickener were used to adjust the flow value and viscosity of the cement paste.
Table Ⅰ Experimental factors and testing levels
Factor Level
Designed void ratio (%), VR 0, 15, 25, 35
Swinging angle (°), θ 10, 20
Measurement face Top, Side
Hammering Test Evaluation of Dynamic
Elastic Modulus and Void Ratio of
Pervious Concrete
100
Published By:
Blue Eyes Intelligence Engineering & Sciences Publication
[image:2.595.80.519.57.328.2]Retrieval Number: G10240587C219/19©BEIESP
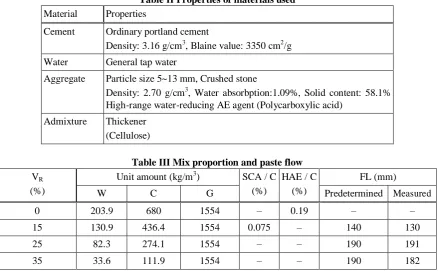
Table Ⅱ Properties of materials used Material Properties
Cement Ordinary portland cement
Density: 3.16 g/cm3, Blaine value: 3350 cm2/g
Water General tap water
Aggregate Particle size 5~13 mm, Crushed stone
Density: 2.70 g/cm3, Water absorbption:1.09%, Solid content: 58.1% High-range water-reducing AE agent (Polycarboxylic acid)
Admixture Thickener (Cellulose)
Table Ⅲ Mix proportion and paste flow VR
(%)
Unit amount (kg/m3) SCA / C (%)
HAE / C (%)
FL (mm)
W C G Predetermined Measured
0 203.9 680 1554 – 0.19 – –
15 130.9 436.4 1554 0.075 – 140 130
25 82.3 274.1 1554 – – 190 191
35 33.6 111.9 1554 – – 190 182
Table Ⅲ lists the mix proportions and paste flows. In the experiment, the coarse aggregate was bound with the cement paste, and no-fine aggregate was used. The water-cement ratio of the cement paste was set to be a constant value of 0.3 for all four of the designed void ratios, and the fluidity was controlled by the flow value of the paste.
C. Mixing and Sample Preparation
Fresh PEC was mixed using the paste premixing method. First, cement, water, and admixture were deposited into a rocking-stirring-type mixer with a 30-L capacity, and mixed at 100 rpm for 30 s. Subsequently, the cement adhered to the inner wall of the mixer was scraped off and mixed at 200rpm for 90 s. The cement paste sample was then removed from the mixer to conduct a flow test and returned into the mixer after confirming the predetermined flow value. Next, the coarse aggregate was placed in the resulting binder, and mixing was continued at 200 rpm for 120 s to obtain PEC.
The fresh PEC was discharged into a plastic boat and cast into three steel molds (150 × 150 × 530 mm3) to prepare prismatic specimens. The casting was performed by filling the molds in two layers, each of which was rodded with a steel rod. After filling the molds with a predetermined mass, vibration was applied on the surface of the specimens via jigging and tamping.
The specimens were then cured in the molds while their surfaces were covered with vinyl sheets. Demolded occurred after 3 days, and the specimens were placed in a water basin at 20 ℃ for 28 days.
D. Experimental Method
(1) Total Void Ratio
The term ―total void ratio‖ refers to the measured void ratio, while ―designed void ratio‖ refers to the void ratio calculated from a mix proportion table (see Table 3). In this study, the total void ratio was measured by using a weighing method. The weight of the PEC to be cast in the mold was
measured just before casting using the mix proportion table in accordance with the void ratio testing method proposed in the 2015 Committee Report of Pervious Concrete (Japan Concrete Institute) [9].
(2) Hammering Test and Acoustic Analysis
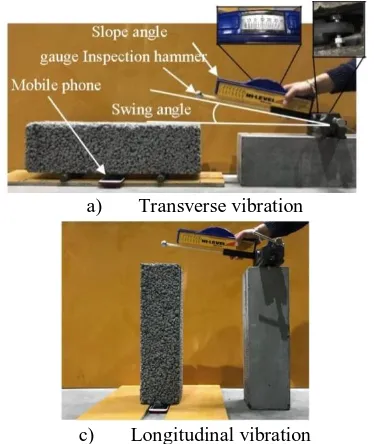
Photo 1 depicts the measurement method of the hammering test. The first two natural frequencies measured from transverse and longitudinal vibrations were determined for each specimen via hammering tests. Photo1-a) displays the measurement of the transverse vibration, while Photo1-b) illustrates that of the longitudinal vibration.
As previous research has revealed [10], [11], natural frequencies can be determined by generating a striking sound, which is then recorded. As exhibited in Photo 1, the striking sound was created by dropping an inspection hammer (length: 41 cm, weight: 144 g) freely from a swing angle of 10° and 20° to strike the surface of the specimen. The striking sound was recorded using a mobile phone (iPhone 7) set at the positions shown in the photo, and the swing angle was measured using a slope angle gauge. The striking point was located at the side of the surface (530×150 mm2) for the transverse vibration and at the center of the side (150×150 mm2) for the longitudinal vibration. The measurements were taken three times for each surface of the specimen. Figure 1 displays an example of the recorded striking sound.
101
Published By:
Blue Eyes Intelligence Engineering & Sciences Publication
Retrieval Number: G10240587C219/19©BEIESP a) Transverse vibration
c) Longitudinal vibration
Photo 1 Measurement method of the hammering test (3) Dynamic elastic modulus
Based on the natural frequencies, the dynamic elastic moduli, E (N / mm2), were estimated using the expressions, as in (1) and (2). The expressions are given in JIS A 1127 [12], which are approximately the same those in ASTM A215.
Transverse vibration:
E = 9.47 × 10⁻⁴ 3 2 (1)
3
Longitudinal vibration:
E = 4.00 × 10⁻³ 2 (2)
In these expression, L (mm) is the length of the specimen; b (mm) is the width of the specimen; t (mm) is the height of the specimen; m (kg) is mass of the specimen; (Hz) and (Hz) are the fundamental transverse and longitudinal frequencies (derived from the hammering test), respectively; and T is a correction coefficient that depends on Poisson's ratio as well as on the ratio between the specimen's radius of gyration and length. Here, Poisson's ratio (μ) was set to 0.2.
III. RESULTS AND DISCUSSION
A. Total Void Ratio
[image:3.595.332.518.34.560.2]Fig. 3 demonstrates the comparison between the total void ratio and designed void ratio. According to the results, it was confirmed that the total void ratio of each PEC specimen was almost identical to the designed void ratio.
Fig.1 Example of the recorded striking sound
[image:3.595.76.263.50.272.2]Fig.2 Determination of natural frequencies using FFT analysis
Fig.3 Comparison between total void ratio
[image:3.595.340.514.316.559.2]and designed void ratio
Fig.4 Relationship between sound pressure level and natural frequency
C. Relationship between the Natural Frequencies and Total Void Ratio
[image:3.595.55.278.678.760.2]102
Published By:
Blue Eyes Intelligence Engineering & Sciences Publication
Retrieval Number: G10240587C219/19©BEIESP
D. Relationship between Total Void Ratio and Elastic Modulus
Fig. 6 elucidates the relationship between elastic modulus and total void ratio. The linear function of the expression (See (3)), approximated by the experimental results, is also shown in the figure. In the expression, the elastic modulus of PEC reaches its maximum when the void ratio is 0 and becomes 0 when there is no paste or only aggregates.
(3)
In the above expression, E (kN/mm2) is the elastic modulus, G (%) is the solid content of the aggregate, and B (kN/mm2) is experimental constant.
According to Fig. 6, the dynamic elastic modulus tends to decrease when the void ratio increase; this relationship was approximated by a linear function with very high correlation. This relationship exhibits a similar trend as that between the dynamic elastic modulus and the void ratio measured using cylindrical specimens [13].
E. Relationships between Natural Frequencies and ElasticModulus
[image:4.595.62.272.470.588.2]To verify of the natural frequencies determined from the hammering tests, a frequency analysis of the prismatic model was performed via Femap with NX Nastran software (FEM). For the analysis model, a homogeneous solid model (150 × 150 × 530 mm 3) consistent with the test specimen was employed (see Fig.7). For the material properties, the dynamic elastic modulus was obtained via natural frequenciesin the longitudinal vibration, density, and Poisson's ratio (see Table Ⅳ).
Table Ⅳ Material properties of FEM model VR(
%)
Dynamic Elastic modulus
(kN/mm2)
Density ×10-3 (g / mm3)
Poisson's ratio
0 44 2.39
0.2
15 24 2.04
25 19 1.91
35 8 1.7
[Note] VR: Designed void ratio
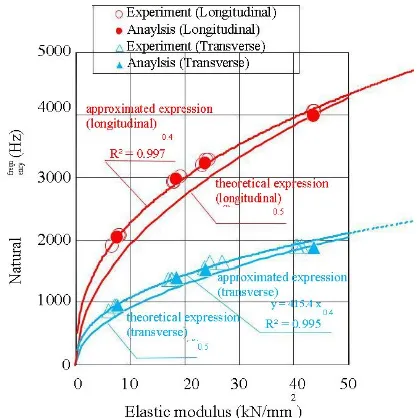
Fig. 8 depicts the analytical values of the natural frequencies (for both the transverse and longitudinal vibrations) determined in the FEM analysis. Here, experimental values of the natural frequencies measured from the hammering tests are also plotted. According to the figure, the analytically obtained natural frequencies tend to exhibit the same pattern as that of the experimental frequencies—the frequencies increase as the elastic modulus increases. By comparing the experimental and analytical values, the high accuracy of the hammering test method is confirmed, meaning the method can effectively evaluate the void ratio and the elastic modulus of PEC (see expressions in Fig. 5 and Fig. 6).
Moreover, Fig. 8 displays both the approximated expressions (solid line), based on the experimental results, as well as the theoretical expressions (dotted line) (4) and (5) based on vibration theory. The theoretical expressions were obtained by converting expressions (1) and (2) shown in Ⅱ.D.(3). The values of and were calculated neglecting the influence of mass.
(4)
(5)
In the above expressions, (kN/mm2) represents the dynamic elastic modulus; (Hz) and (Hz) are the transverse and longitudinal frequencies, respectively; and and are constants obtained by converting the expressions (1) and (2). (In this experiment, = 388.7(1/ √kg/mm), and = 305.0 (1/√kg/mm), which are calculated using the size (150 × 150 × 530 mm) and the maximum mass (29 kg) of the test specimens.)
From the calculated results in Fig. 8, it is found that the relationship between frequencies and dynamic elastic moduli of PEC can be approximated by the power expressions that are the same as the theoretical expressions obtained from vibration theory. The theoretical frequencies tend to be lower than the experimental results at the lower dynamic elastic modulus likely because the theoretical expressions were calculated using the maximum mass of the specimens. Furthermore, it can be seen that the natural frequencies decrease with the decrease of dynamic elastic moduli. This fact implies that the change in dynamic elastic modulus due to change in void ratio is the primary reason for the strong correlation between natural frequency and total void ratio of PEC, which can be expressed using a quadratic function, as shown in Fig.5.
[image:4.595.321.530.482.691.2]103
Published By:
Blue Eyes Intelligence Engineering & Sciences Publication
Retrieval Number: G10240587C219/19©BEIESP CONCLUSION
The findings obtained from the present study are described below.
1) Based on the results of the experiment, it is confirmed that the natural frequency of PEC measured by the hammering test is negligibly affected by the impact surface roughness of specimens and the swing angle of the inspection hammer; it is more affected by the void ratio of the specimen.
2) It is also found from that the relationship between the natural frequencies (transverse and longitudinal vibrations) and the void ratio can be approximated by quadratic functions, while the relationship between the elastic modulus and the void ratio of PEC can be approximated by a linear function. 3) The analysis indicates that the elastic modulus
significantly affects the natural frequency, and suggests that the change of the elastic modulus is the main factor behind the correlation between the void ratio and natural frequencies.
4) By comparing the experimental and analytical results, it was confirmed that the hammering test is a potent method for evaluating the void ratio and the dynamic elastic modulus of PEC.
REFERENCES
1. ACI Committee 522.: 522R-10 report on pervious concrete, pp.2, 2010
2. Malhotra, V.M.: No-Fine Concrete Its Properties and Application, Journal of ACI, Vol.73, No.11, pp.628-644, 1976 3. Tamai, M., Mizuguchi, H., Hatanaka, S., et al.: Design, construction and recent application of porous concrete in japan, Proceedings of JCI Symposium on Design, Construction and Recent Application of Porous Concrete, Japan Concrete Institute, pp.1-10, 2004
4. Alam, A., Haselbach, L.: Estimating the modulus of elasticity of pervious concrete based on porosity, Adv. Civil Eng. Mater. 3, No.1, pp.256-269, 2014
5. Saito, T and Demura, K.: Proposal of equation for estimating the static modulus of elasticity of porous concrete by applying the law of mixture, Journal of Structural and Construction Engineering (Transactions of AIJ), Vol.81, No.723, pp.825-832
6. ASTM Standard C215-14. Standard test method for fundamental transverse, longitudinal, and torsional resonant frequencies of concrete Specimens, West Conshohocken, PA, ASTM International, 2014
7. Lund, M., Hansen, K., Brincker, R., Jensen, A and Amador, S.: Evaluation of freeze-thaw durability of pervious concrete by use of operational modal analysis, Journal of Cement and Concrete Research, Vol.106, pp.57-64, 2018
8. JIS, Standard A 5001. Crushed stone for road construction Japan Concrete Institute: Technical committee report on establishment of construction standards and quality assurance system for performance-based design of porous concrete, 343pp., 2015.6
9. Umoto, T., and Ito, Y.: Non-destructive testing method of concrete using impact acoustics, Concrete Journal, Japan Concrete Institute, Vol.7, No.1, pp.143-152, 1996
10. Ohtsu, M.: Theoretical aspects on elastic waves and applications to nondestructive evaluation of concrete, Concrete Journal, Japan Concrete Institute, Vol.46, No.2, pp.5-11, 2008.
11. JIS, Standard A 1127, Methods of test for dynamic modulus of elasticity, rigidity and Poisson's ratio of concrete by resonance vibration