International Journal of Innovative Technology and Exploring Engineering (IJITEE) ISSN: 2278-3075, Volume-8 Issue-9, July 2019
Parameter Estimation of Smart Grid using PMU
with Kalman Filter and Bayesian Prediction
soumitra Kumar Sarker, Anand Mohan
Abstract-Load flow is the main issue which occurs in power grid systems. To improve the performance, reduce the cost and enhance the reliability in power systems, smart grids have been proposed. In electricity distribution system, smart devices like smart meters are used for effective performance. The real concern in these devices is to protect the data from unauthorized parties and noise occurring in data. Smart device reader acts as the bridge which connects the smart grid devices with smart grid clouds. In many of the instances of circuit-based analysis, the network parts are restricted to the regarded value of impedances with voltage and current resource. But the issue of load flow is usually diverse in the sense that rather of impedances, the known amounts are active and reactive powers in most of the network buses, since the performance of most of the load in a great deal of instances are as continuous power loads, presuming that voltages used on them stay within suitable ranges. There are various methods which are used to solve these problems. Kalman filters are proposed to achieve the optimal performance on the smart grid devices. This filter identifies the device failures, unusual disturbance, and malicious data attacks. Kalman Filter is a dynamic state estimation method which is mainly used in this paper for noise variation estimation. The use of dynamic state estimation methods such as the Kalman filter provides an optimal solution to the process of real-time data prediction and reduces the problem based on non-linearity. The analysis of real-time data depends on Phasor Measuring Units (PMU) which plays a significant role in power transmission and distribution processes due to their ability to monitor the power flow within a network. The process of PMU-based monitoring improves the quality of the smart grid. Simultaneously, the implementation of PMU increases the dynamics of noise variance which further inflates the uncertainty in noise-based distribution. This paper presents a method to reduce the amount of uncertainty in noise by using a linear quadratic estimation method (LQE), usually known as Kalman filter along with Taylor expansion series but this process is time-consuming and is vulnerable to a large number of errors at the time of testing. The main reason behind this approach is the high complexity of the system which makes it very hard to derive the process. The proposed studies adopts a technique to work on covariance earlier based estimation using Bayesian method together with the estimation of dynamic polynomial prior by using Particle Swarm Optimization (PSO). The experimental evaluation compares the outcomes received from the primary Kalman filter, PSO optimized Kalman filter out and Kalman filter Covariance Bayesian method. Finally, the effects received from the analysis highlights the truth that the PSO optimized Kalman clear out to be more effective than the Kalman filter out with Covariance Bayesian approach
Keywords- PMU, Bus, Filters, Kalman, PSO, Taylor expansion, Voltage.
I. INTRODUCTION
The Smart Grid usually refers to an improved supply chain of electricity that is driven from the major power plant making an efficient way inside our home. In United States, there are large number of power plants approximately in thousands throughout that help in generation of electricity nuclear energy, coal, nuclear, wind, hydro and a large number of other kind of resources.
Revised Manuscript Received on July 05, 2019.
Soumitra Kumar Sarker, m.Tech Research Scholar, 1Department of
Electrical Engineering
Alakh Prakash Goyal Shimla University, Mehli Shoghi Bypass Road, Shimla-171009, Himachal Pradesh (India).
Anand Mohan, professor, Department of Electrical Engineering Alakh Prakash Goyal Shimla University, Mehli Shoghi Bypass Road, Shimla-171009, Himachal Pradesh (India).
[image:1.595.310.550.169.355.2]The station that performs the process of generation produces the energy electricity at a specified voltage of electricity.
Figure 1: Smart Grid [18]
The addition of newly constructed lines of transmission will help the utilities to get more electrical power from the stations or the power plants to the user home. However, most of the communities don’t require new lines of power in their regional areas [2] [14]. Additionally, the adding of new capacity, though required, will not rise or increase the old electrical equipment reliability destined to the end of its useful form of life. What is required know is a newly built approach that naturally helps in increasing the entire efficiency of electrical delivery system. Such kind of strategy will increase both the system reliability and it will also reduce the amount of energy in the process of delivery, which thereby reduces the greenhouse house gas emissions. One would call such a new approach as the technology of Smart Grid.
1.1 Smart Grid Challenges
The responsive forum generally analyses four of the major challenges for attaining an effective and efficient period of transition towards a new system of electricity, pin-pointing that failures of the system, so it could result in the process of stranding the assets of the network and finally, results in deflection of the customer from the grid. Marking the major challenges [5]. Firstly, the electricity was still perceived largely only in commodity form, enabling the engagement of customer in modern technologies a difficult and costly undertaking. Secondly, the present paradigm of regulatory cripples the distributed type of resources from giving their exact value to the energy system. Thirdly, the process of uncertainty around some of the rules helps in preventing significant stakeholders from the process of deploying and enabling the infrastructure that might complement the energy grid to be considered as the backbone of future-based electrical system [5]. The final step involves some of the major segments restrict transform or a change in cultural form towards specific allocation of new business models and roles.
1.2 Smart Grid applications technologies
The process of transition of Smart Grids is not capable to replace the already existing grids; it usually represents a key significant form of revamping, with the use of new sensing technology, and measurement, control, and automation technologies. Generally speaking, the technologies are needed to properly implement the large basic needs of Smart Grid system that would consist the following:
1.2.1 Advanced Metering Infrastructure (AMI)
It is considered as one of the major part of Smart Grid technology that are operational already in various worldwide networks. Generally, the advanced monitoring infrastructure can be characterized as a communication of two-way type of networks and represents the assimilation of smart energy meters, sensors, data management systems, and monitoring systems, which enables the collection and dissemination of informational data between the utilities and users’ meters. The goal of AMI is to read the readings of the remote meter for inaccurate data type, issues related to identification of network, load-based profiling, curtailment of partial type of load and energy audit instead of load dropping/shedding operation.
Benefits of using AMI
The benefits of using the technology of AMI can be usually classified as:
(1) Operating Benefits: AMI helps in benefiting the whole
grid system by developing the meter reading accuracy, detection of power theft and power outage response, while eradicating the requirement for meter-based reading on-site [6] [8].
(2) Financial Benefits: AMI provides financial benefits to
the utility, gas, and water firms by lowering maintenance and cost of equipment’s that enables fast process of electric service restoration during the process of line-outages and conducting the process of billing.
(3) Benefits for customer: The concept of AMI provides
several benefits to its consumers with the help of early meter failure detection, faster accommodating of service-based restoration, and refining the flexibility and accuracy of billing. Finally, the process of AMI helps the consumers to manage and save the money along with management of energy consumption.
(4) Security Benefits: The AMI technology helps in enabling an intensified system-based monitoring that reduces the potential-based threats over the grid system by cyber-terrorist networks.
AMI Challenges
Regardless of its extensive advantage, the AMI deployment process presents three of the key challenges consisting of high up-front cost of investments, process of integration with other form of grids, and the process of standardization.
(1) High Costs of Capital: The AMI based full scale
deployment generally needs expenditures on all the components of software and hardware systems, that include infrastructural network, meters, and software network management, in conjunction with associated cost with the maintenance and installation of meters and technology based on Its i.e. information systems [7] [13].
(2) Integration:AMI represents a typical technological
system that essentially be incorporated with the utilities' of the information technological systems, comprising Outage Management Systems (OMS), Distribution Automation System (DAS), Work Management (WMS), Mobile Workforce Management (MWM), Geographical Information Systems (GIS), Customer Information Systems (CIS), SCADA/DMS, etc.
(3)Standardization: The standards of interoperability needs to be defined that sets a constant need for the technology of AMI, its placement and the processing operations in general. These are the solutions to successful connection and maintenance of a grid system based on AMI.
1.2.2PMU (Phasor Measurement Units) and WAMPAC (Wide Area Monitoring Protection and Control) to safeguard the Power System security.
International Journal of Innovative Technology and Exploring Engineering (IJITEE) ISSN: 2278-3075, Volume-8 Issue-9, July 2019
[image:3.595.51.288.162.276.2]Phasor Measurement Units that represents the electronic-based devices, for measurement of AC waveforms and transforming them into required phasors, in accordance to frequency of the system and synchronizing such dimensions under the GPS based reference based sources control. A recursive phasor algorithm is used for sampling and processing of the analog signals for generation of current and voltage phasors [6]. PMU unit having distinct type of components is shown by a block diagram in figure 2.
Figure 2: PMU (Different Components) [16] [17] The (PDC) Phasor Data Concentrator placed at the controlling center is generally provided with data from distinct distributed PMUs placed in the smart grid premises. The PDC waits for the data arrival having the slowest range and it gathers and collects and further helps in data sorting by a time stamp method until the slowest data arrival. In the control center the concentrated form of data by the PDC is further utilized for distinct types of applications. Now the super PDC collects the data from several PDCs distributed over a particular area. The PMU based conceptual measurement block diagram for wide area measurement is shown in figure 3.
Figure 3:WAM System Based on PMU [11] Benefits of using PMU
For making Indian grid smart wide area measurement (WAM) based on PMU i.e. Phasor measurement Unit is an important technology which plays a key role for making grid smarter. This technology of WAM may be employed for the following:
(1) Blackouts Threat and Scope Reduction: Basically,
blackouts are triggered because of fewer events which are low in probability or a number of uncontrolled or uncorrelated events. For preventing such kind of blackouts comprehensive plans are required which can protect and control the system in emergency. The PMU helps in building system of protection so, if there arises a series of
contingencies then its effect can be helped in minimizing up to a controlled range. Data provided by PMU will also be helpful in the power system post noise-based disturbances analysis that is collected from records provided by the several data-based loggers located in the system. The GPS helps to introduce, The GPS synchronization allows an easy understanding of string events i.e. the type of disturbances by using the recordings on the basis of time-correlation, and the overall record of disturbances caused to power system can be reproduced.
(2) State Based Measurement: The function of state
estimation (SE) helps in utilizing telemetered form of measurements of power injection at system buses, generator bus voltages, reactive and real power line flows, and power injection at system buses, and circuit breaker status etc. for generation of an optimal system state estimation. For achieving reliable form of state estimation, it is generally required that the measurements-based number must be larger than the states number.
(3) Increasing the Capacity of Transmission Line: The
conventional method to congestion on real-time management is generally based on NTC i.e. Nominal Transfer Capability, usually computed on off-line basis by using conservative form of hypothesis constrained by environmental and operational assumptions of the system. Therefore, an uncertainty (inherent) already exists with such kind of limits. However, it is more advisable to maintain some of the extra margins of safety in order to maintain its limit. Hence, in case of traditional approach, the operational limit of line is usually lower than its actual form of limit. The technology of WAM, which provides a synchronized form of data measurement from congested regions, allows computation on the basis of transfer capability on real times basis, for the original working conditions [12] that means that the lines can usually be further operated close to its limits, which thereby helps to increase the capability of transmission system.
(4) Calibration of Instrument Transformers: for an
impressive and impactful system measurement it is generally needed that the instrument transformers (ITs) must be calibrated in a proper manner. One of the option is to perform field-based calibration of such kind of transformers. But such an option is not feasible on economic basis. Under the present scenario the deployment of PMUs in case of power system can play a significant role [9]. The calibration of the system may performed or driven with the help of several measurement scans during daily variations of loads. . It is further conceptualized that as the level of PMUs penetration in power grid gets increased, it will become more reliable to measure the ITs i.e. instrument transformers on regular basis and more accurately it eliminates a major error source in overall measurement systems [15].
II. RELATED WORK
[image:3.595.48.293.436.604.2]A phasor measurement unit was used for analysing and controlling the energy system by measurement of voltage phase in transmission lines and electrical nodes. For achieving this, the graph theory concept of domination was applied to energy-based networks by redefining the vertex “adjacency” as an “observed” vertex. The domination number of power helps in identifying the PMU number to be placed. The concept proposed the integrity of power domination that not only provides minimum number of PMUs but also helps in identifying the optimized locations for the placement of PMU in an electric network of power system. Emmanuel U. Oleka, et al [2] proposed various types of techniques. It evaluated various kind of major techniques and further established that the techniques available and the factors considered were not adequate for practical optimal placement of PMU. It further evaluated a method that could be applied for achieving a robust and practical solution for an effective placement of PMU for applications of synchro-phasor in a practical energy grid. Tapas Kumar Maji. et al [3] introduced a concept to solve the OPP-based problem, an algorithm of EBPSO was proposed and it was tested on distinct type of systems, like IEEE 118- bus, 57-bus, 14-bus, and practical system based on NRPG 246-bus. Due to coefficient of exponential inertia-based weight, two useful and innovative sigmoid function (SFs), two techniques based on Social Media Optimization (SMO) and logical ‘filtration’, multiple solutions are usually obtained. The coefficient based on exponential inertia weight was introduced for improving the capability based on swarm searching. Nadia HanisAbd Rahman, et al [4] uses V-shaped sigmoid function and mutation strategy that improved the diversity of population, which further minimized the number of particle chances of being trapped in the region of local optima, therefore leading to a solution based on quality. For validating the effectiveness of the solution, the obtained results by the proposed methodology were compared with other existing techniques in order to demonstrate the validity and accuracy of the technique that was proposed. The IEEE 300-bus system results shows that the method proposed managed effectively to reduce the number of PMUs required. Saroj Kumari, et al [5] presents an optimal technique for placement of PMUs for complete power observability of the network with PMUs number as minimized as possible. Because of high cost of installation based on PMUs, it is significant to create fully observable system with minimized PMUs. A BPSO i.e. binary particle swarm optimization was mainly implemented over Puducherry 17 and standardized IEEE system bus system. The method of BPSO based on optimized placement of PMU can be applied therefore to any of the power system in order to make the system fully observable with distinct aspects of the power system. The results obtained are usually compared with existing techniques and it usually found that the Adaptive GILP, SA, GA BSA and the proposed method of BPSO was found better. Satyendra Pratap Singh, et al [6] proposed a methodology of Integer Programming for the Phasor Measurement Unit (PMU) based optimal placement that helps in minimizing the installation cost and further provide the overall observability of power system. The zero injection buses concepts were mainly used in this research methodology for reduction in
International Journal of Innovative Technology and Exploring Engineering (IJITEE) ISSN: 2278-3075, Volume-8 Issue-9, July 2019
In this field, a large number of material has been published, so the most ideal and classical papers were reviewed. The techniques proposed can be divided into three of the major categories: heuristic, metaheuristic, and conventional. The reviewing literature further presented will be useful for the analysts for discovery purpose as well as for applying new approaches for solving the issues related to optimal phasor. M. Hurtgen, et al [11] suggested to reduce the PMU-based size construction while permitting complete network observability. The technique initially recommended the size configuration of PMU that makes the network to become visible. The iterated local search is usually metaheuristic which afterwards was utilized for reducing the PMU size construction needed to see the system network. The algorithm was examined upon IEEE screening systems with 14, 57, and 118 nodes and it additional likened to acquired outcomes in previously publications. Saikat Chakrabarti, et al [12] presented a method for using the synchronized kind of measurements for the process of whole observability of power system. The placement of PMU that utilizes the measurements of time-synchronizing dimensions of voltage and current phasors, were studied in this framework. An approach named integer quadratic programming was mainly used for minimizing the needed PMUs in total number, and to further maximize the redundancy-based measurement at the buses of power system. P.S. Sreenivasa Reddy, et al [13] aimed to provide an extensive survey on optimized placement of PMU for the rising development of power system. The process includes the use of distinct type of algorithms for optimum placement of PMU and it deeply explained the methods adopted for the proposed work.
III. THE PROPOSED METHOD 3.1Proposed Methodology
The Kalman filter is an advanced type of filter which is used to filter the measurement noise and provide the optimal estimation of a dynamic system’s state. It really is recursive in nature in order that new measurements could be prepared as they appear. Kalman filtration system minimizes the mean square error of approximated parameters. EKF i.e. Extended Kalman Filtration system, predicated on Taylor series expansion nearby a nominal value which can be taken as the prior estimate in this instance must be engineered. The state transition-based matrix F is distributed by the
Jacobian vector function about a state x as well as the noise scaled matrix τ is distributed by the Jacobian vector function about a state w. As the dynamics of the process is continuous as the measurements are often discrete in nature, a hybrid EKF continuous-discrete model is usually developed. The equations of EKF can't be used straight and therefore constant time EKF equations need to be derived. Likewise, because the measurements are discrete in character, a hybrid of the two is created and explained below (repetitive data). A great observable, nonlinear dynamical program, with the ongoing process mechanics and under the discrete measurement of dynamics is definitely explained as follows: Here shows the n-dimensional state vector of the system, f(.) Dx → n is a
finite non-linear mapping of system states to system
inputs, z
denotes the p-dimensional system measurement, h (.):
is a non-linear mapping of system states to output, denotes the continuous process noise scaling matrix, denotes the w-dimensional random process noise and denotesthe v-dimensional random measurement noise.
3.2 Proposed Steps
Figure 4:Proposed Steps 3.3 Observational Comparative Performance
(1) Kalman Filter: Kalman filter (KF) is represented as an
optimized form of estimator as it has the capability to estimate the error covariance of the system and it uses the process of prediction in a recursive way in order to improve and enhance the system-based measurements timely. The implementation of KF was done as an estimator of the system in several type of applications like in image processing, finance, and navigations. The unique property of KF involves two of the distinct type of processes. The first one is the process of prediction and the other one is the process of measurement. These two of the processes are jointly combined and driven in a recursive form in order to gain optimized process of Kalman filtering.
(2) Extended Kalman Filter: The basic methodology of EKF is to mainly focus on the value of 1st order Taylor expansion (non-linear) lying around estimated status, then it changes the non-linear system into the equation of linear type.
Reduce the System to Sub-system
Define Bus Define the plant
Measure of Key Parameters
Apply Kalman Filter
Taylor Expansion
The algorithm based on the methodology of EKF is used commonly in case of non-linear filtering systems, and the computation of the process is very easy for the purpose of implementation.
(3) Unscented Kalman Filter: UKF methodology is used for the purpose of dynamic state estimation, and it observed accuracy in estimation process than conventional method of EKF. However, the concept of UKF has few limitations in use. It is only applicable to temporary form of Gaussian-based distribution model.
3.4 Algorithm Used
UKF algorithm: The unscented Kalman filter (UKF) provides an impactful or effective recursive filter on the basis of discrete-time i.e. used for solving the problems of estimation as stated below:
Where,
x = state vector and; y = measurement vector.
h and f functions = non-linear equations of the measurement and system, respectively.
= system noises with zero covariance and mean
matrices Q and R.
= measurement noises with zero covariance and mean matrices Q and R.
The UKF jointly combines the unscented transformation (UT) and classical Kalman filter (KF) theory. The major objective of using unscented Kalman filter (UKF) is the use of equations above that represents the model-based measurement and presents an exact system instead of linearized models as in case of EKF that generally avoids the loss related to information based on higher order. Additionally, no Hessian or Jacobian matrices are required that would help in reduction of needed CPUs and this results in offering advantages on the basis of computational over extended Kalman filter. The steps of the UKF are stated as follows. Based on the theory of the UT i.e. unscented transformation as explained in earlier section, the Sigma points { } are modelled/created and further evaluated
(one by one) with the help of system-based equation.
In the next step, one can compute the state mean (predicted) vector , and the covariance (predicted) matrix
as states below:
Where,
= Matrix based column
= matrix that contains the propagated form of sigma points.
Another step involves the build-up phenomenon of distinct sets of Sigma point that corresponds to
and with UT same theoretical concept and compute the points of Sigma with the help of the given (below) measurement equation:
The measurement covariance matrix and the mean evaluated points and that represents the cross-covariance of the measurement and state are evaluated using the equations below:
In the final step, the filter gain , the updated forms of covariance , and the state mean are evaluated as follows:
Generally, the UKF is simple in calculation than the EKF as it does not require calculation of Jacobian matrix of the systems that are of non-linear nature. In addition, it helps to provide more accuracy in estimation part as compared to EKF filter on the basis of linearization of the process. In the past years, the UKF was generally used to have restricted applications in estimation of power system state. Recently, so many successful applications of power system are developed where the unscented Kalman filter (UKF) is implemented and the efficiency of such filter is currently identified by different experts.
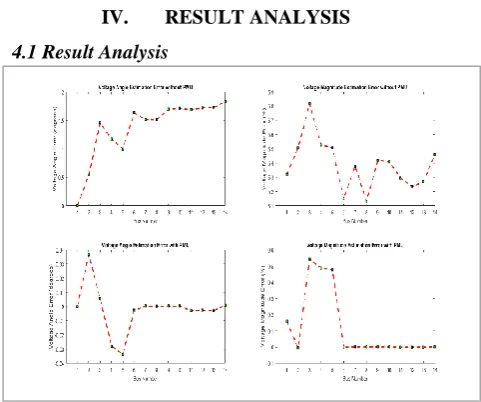
[image:6.595.309.550.445.646.2]IV. RESULT ANALYSIS 4.1 Result Analysis
International Journal of Innovative Technology and Exploring Engineering (IJITEE) ISSN: 2278-3075, Volume-8 Issue-9, July 2019
Table I Voltage profile with PMU
BUS
Voltage magnitude with
PMU
Voltage angle with PMU
1 1.59E-03 -3.21E-12
2 -5.61E-05 0.036676933
3 0.005442012 0.005403532
4 0.004874977 -0.02779928
5 0.004787058 -0.033691186
6 8.88E-08 -0.002644996
7 1.16E-05 0.000370515
8 1.61E-05 0.00030468
9 1.33E-05 0.000438954
10 1.30E-05 0.000339254
11 -7.70E-06 -0.002787357
12 3.40E-08 -0.002688842
13 -1.47E-06 -0.002770346
[image:7.595.49.290.270.713.2]14 1.84E-05 0.000921524
Table II Voltage profile without PMU
BUS
Voltage magnitude with
PMU
Voltage angle with PMU
1 0.053207345 0
2 0.055077251 0.537399171
3 0.058174447 1.454713789
4 0.055276848 1.172617453
5 0.05508744 0.998183662
6 0.051502452 1.632914674
7 0.053766521 1.514229622
8 0.051304857 1.513151119
9 0.054181079 1.692424425
10 0.05409145 1.711613542
11 0.052940395 1.681591621
12 0.052350832 1.723007686
13 0.052673005 1.727032246
14 0.054580349 1.82495685
Figure 6:Comparison between Kalman and Kalman PSO ON Noise Reduction
In figure 6 analysis the noise reduction with kalman and kalman PSO. In graph green color is noise and red line kalman filter value and blue line kalman with PSO but kalman with PSO improve the accuracy of noise.
Figure 7:Comparison between Kalman noise reduction Prediction
In figure 7 analysis the noise reduction with kalman and kalman PSO. In graph green color is noise and red line kalman filter value and blue line kalman with PSO but kalman with PSO improve the accuracy of noise.
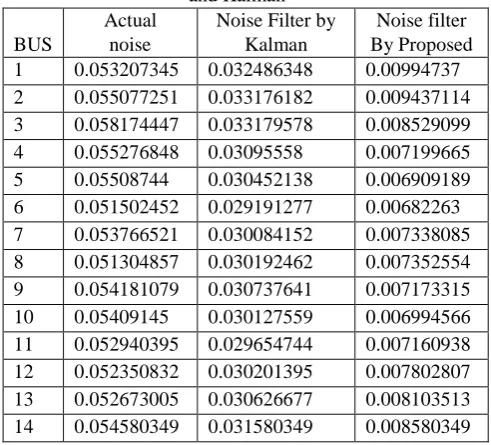
[image:7.595.306.554.287.435.2]Figure 8:Analysis the noise reduction with Kalman Table III Noise reduction comparison between proposed
and Kalman
BUS
Actual noise
Noise Filter by Kalman
Noise filter By Proposed
1 0.053207345 0.032486348 0.00994737
2 0.055077251 0.033176182 0.009437114
3 0.058174447 0.033179578 0.008529099
4 0.055276848 0.03095558 0.007199665
5 0.05508744 0.030452138 0.006909189
6 0.051502452 0.029191277 0.00682263
7 0.053766521 0.030084152 0.007338085
8 0.051304857 0.030192462 0.007352554
9 0.054181079 0.030737641 0.007173315
10 0.05409145 0.030127559 0.006994566
11 0.052940395 0.029654744 0.007160938
12 0.052350832 0.030201395 0.007802807
13 0.052673005 0.030626677 0.008103513
[image:7.595.308.554.486.708.2]Figure 9:Analysis the noise reduction with Kalman-PSO.
[image:8.595.51.287.306.623.2]In figure 8 and 9 analysis the noise reduction with kalman and kalman PSO. In graph red color is noise and red line kalman filter value and green line kalman with PSO but kalman with PSO improve the accuracy of noise.
Table IV BER COMPARSION Number
Of
PMU KALMAN
KALMAN PSO
Bayesia n PSO
2 0.02 0.001 0.001
5 0.03 0.0001 0.0002
8 0.01 0.00001 0.0001
10 0.001 0.00002 0.00002
12 0.002 0.00001 0.00001
15 0.0001 0.000001
0.00000 2
Figure 10: Comparison between BER and Number of PMUs in Different Approaches
In figure 10 analysis the noise reduction with kalman and kalman PSO. In graph green color is noise and red line kalman filter value and blue line kalman with PSO but kalman with PSO improve the accuracy of noise.
V. CONCLUSION
The phasor measurement method plays an important role in providing an efficient performance in the smart grid technology. But in spite of using such measurement methods, the system experiences a lot of inconsistencies during the measuring operations as the measured quantity is not defined properly resulting in excessive forms of
divergent results. Phasor Measurement Unit (PMU) plays a very significant role in smart grid technology, where it contributes to measure the synchrophasors thus making it valuable to dynamically monitor different types of transient processes occurring in a system. Basically compares the popular Kalman filter technique with a novel method of Kalman filter Covariance Bayesian learning. A Taylor expansion of Kalman filter was used which reduces the non-linearity by using particle swarm optimization technique (PSO) and the metrics based covariance which has improved the mean square error and the noise of the system. However, in this paper proposed work is done on PMU- parameter estimation by using an extended version of Kalman filter along with the optimization techniques. The proposed algorithm of Kalman filter used in the process helps in predicting the states of noise and covariance. Further, the optimization of the generated output is done using an intelligent PSO technique. The main logic behind the objective is to reduce the non-linearity and to pin-point the latent features that reduce the non-linearity of the system.
REFERENCES
1. Saravanan, Mariappan, Ramalingam Sujatha, Raman Sundareswaran, and Muthu Selvan Balasubramanian, "Application of domination integrity of graphs in PMU placement in electric power networks." Turkish Journal of Electrical Engineering & Computer Sciences 26, no. 4 (2018): 2066-2076.
2. Oleka, Emmanuel U., Evelyn R. Sowells, and Gary L. Lebby, "High-lighting the deficiencies in some existing optimal PMU placement techniques." American Journal of Electrical and Electronics Engineering, Greensboro NC, Vol. 5, No. 4, pp: 120-125, 2017
3. Maji, Tapas Kumar, and Parimal Acharjee, "Multiple solutions of optimal PMU placement using exponential binary PSO algorithm for smart grid applications." IEEE Transactions on Industry Applications 53, no. 3 (2017): 2550-2559.
4. Rahman, Nadia HanisAbd, and Ahmed FaheemZobaa, "Integrated Mutation Strategy with Modified Binary PSO Algorithm for Optimal PMUs Placement." IEEE Transactions on Industrial Informatics, Vol 13, No.6, pp: 3124-3133, 2017.
5. Kumari, Saroj, PratimaWalde, Asif Iqbal, and AkashTyagi, "Optimal phasor measuring unit placement by binary particle swarm optimization." In Computing, Communication and Networking Technologies (ICCCNT), 2017 8th International Conference on, pp. 1-6. IEEE, 2017.
6. Singh, SatyendraPratap, and S. P. Singh, "Optimal PMU placement in power system considering the measurement redundancy." Int. J. of Advances in Electronic and Electric Engineering, Varanasi, India, Vol. 4, No. 6, pp: 593-598, 2015.
7. Paudel, Jyoti, Xufeng Xu, Karthikeyan Balasubramaniam, and Elham B. Makram, "A strategy for PMU placement considering the resiliency of measurement system." Journal of Power and Energy Engineering, Clemson, USA, Vol.3, No. 11, pp: 29, 2015.
8. Manousakis, Nikolaos M., George N. Korres, and Pavlos S. Georgilakis, "Taxonomy of PMU placement methodologies." IEEE Transactions on Power Systems, Vol. 27, No. 2, pp: 1070-1077, 2012. 9. Roy, BK Saha, A. K. Sinha, and A. K. Pradhan, "An optimal PMU placement technique for power system observability." International Journal of Electrical Power & Energy Systems, Kharagpur, India,
Vol. 42, No. 1 pp: 71-77, 2017.
10. Manousakis, N. M., G. N. Korres, and P. S. Georgilakis, "Optimal placement of phasor measurement units: A literature review." In Intelligent System Application to Power Systems (ISAP), 2011 16th International Conference on, IEEE, Athens, Greece, pp. 1-6. 2011 11. Hurtgen, Michaël, and J-C. Maun, "Optimal PMU placement using
International Journal of Innovative Technology and Exploring Engineering (IJITEE) ISSN: 2278-3075, Volume-8 Issue-9, July 2019
12. Chakrabarti, Saikat, Elias Kyriakides, and Demetrios G. Eliades, "Placement of synchronized measurements for power system observability." IEEE Transactions on Power Delivery, Vol24, No. 1 pp: 12-19, 2009.
13. SreenivasaReddy, P. S., S. P. Chowdhury, and S. Chowdhury, "PMU placement-a comparative survey and review." In Developments in Power System Protection (DPSP 2010). Managing the Change, 10th IET International Conference on, IET, pp. 1-4, 2010.
14. Peng, Chunhua, and XuesongXu,"A hybrid algorithm based on BPSO and immune mechanism for PMU optimization placement." In Intelligent Control and Automation, 2008. WCICA 2008. 7th World Congress on, pp. 7036-7040. IEEE, 2008.
15. Laverty, D. M., Best, R. J., Brogan, P., Al Khatib, I., Vanfretti, L., & Morrow, D. J. (2013). The Open PMU platform for open-source phasor measurements. IEEE Transactions on Instrumentation and Measurement, 62(4), 701-709.
16. Farhangi, H. (2010). The path of the smart grid. IEEE power and energy magazine, 8(1).
17. SmartGrid:https://www.nema.org/Policy/Energy/Smartgrid/Pages/def ault.aspx accessed on 5/12/2018 at 1.00 PM.
18. SmartGridEvolution: http://www.eolasmagazine.ie/smart-grid-evolution/ accessed on 5/12/2018 at 1.15 PM.
AUTHORS PROFILE
Soumitra Kumar Sarker is a student of Alakh Prakash Goyal Shimla University, Himachal Pradesh, India. At present the author is pursuing Master of technology in Electrical Engineering (Power System). Currently he is working on Parameter Estimation of Smart Grid using PMU with Kalman Filter and Bayesian Prediction. He completed his Bachelor of Science in Electrical and Electronic Engineering obtained from University of Asia Pacific in Bangladesh. He has get Certificate of Participation from the International Conference on recent Advance and Research Innovations in Engineering and Technology (RARIET-2017) for an oral presentation on the paper title ‘Prospects of Renewable Energy sector in Bangladesh’ which was help at Alakh Prakash Goyal Shimla University as well as the author.
Dr. Anand Mohan is currently working as Professor in the
![Figure 1: Smart Grid [18] Such a voltage gets further increased or stepped down to](https://thumb-us.123doks.com/thumbv2/123dok_us/8194825.259055/1.595.310.550.169.355/figure-smart-grid-voltage-gets-increased-stepped.webp)
![Figure 2: PMU (Different Components) [16] [17] The (PDC) Phasor Data Concentrator placed at the controlling center is generally provided with data from distinct distributed PMUs placed in the smart grid premises](https://thumb-us.123doks.com/thumbv2/123dok_us/8194825.259055/3.595.48.293.436.604/different-components-concentrator-controlling-generally-distinct-distributed-premises.webp)