Abstract: The field of machine learning is witnessing its golden era as it turnout to be the leader in this field of artificial intelligence. This paper presents a comprehensive study of recently developed machine learning techniques especially for house price prediction. Due to the lack of sufficient knowledge required to train the machine learning models, existing techniques usually use various attributes and assign constant values to these attributes. Unsuitable assignment to these attributes does not provide desired results. The primary objective of this review paper is to provide a structured outline of some well-known machine learning techniques. This paper also focuses on the methods which can assign optimal values to the existing techniques. The review has revealed that the meta-heuristic techniques can attain the optimistic parameters for the machine learning techniques. However, metaheuristic techniques still suffer from the poor convergence speed and stuck in local optima kind of issues. Finally, this paper describes the various issues and challenges of image machine learning techniques, which are required to be further studied. The various challenges with existing machine learning techniques are as: parameter tuning, ensembling, over/under-fitting, etc.
Index Terms: Regression, Linear Regression, Non-Linear Regression, Random Forest Regression.
IINTRODUCTION
Purchasing another house is an exciting and very tiring activity. But, the joy of moving into another house is generally eclipsed by the disappointment associated with seeking, and consulting for another house. The process of purchasing another house is extremely long [1]. This infers somebody ought to be set up to devote a considerable measure his/her time and energy into the procedure. In order to make the fantasy of moving into another house a reality, and have no negative outcomes from there on, somebody needs to put various variables into thought. In our everyday life, the behavior and choices made by individuals are generally influenced by the predominant financial circumstances [2]. The vast majority will Both consciously or unconsciously utilizes financial speculations to Both embrace or reject a choice [3]. These theories are additionally vital in settling an economic decision like that of purchasing another house. Above all else the choice of buying another house is in numerous aspects an extensive and important choice [4,5]. This is generally on the grounds that purchasing a house is an exceptionally costly exercise
Revised Manuscript Received on September 10, 2019.
Jaspreet Kaur, Apex Institute of Technology, Chandigarh University, Gharuan, Punjab, India.
Dilbag Singh, Apex Institute of Technology, Chandigarh University, Gharuan, Punjab, India.
Manjit Kaur, Apex Institute of Technology, Chandigarh University, Gharuan, Punjab, India.
which can deprive someone of all his reserve funds [6,7]. This suggests the interest of houses is consistently exceedingly value versatile
[8]. In addition, purchasing another house additionally suggests that individuals should move from a well-known condition to one that is less familiar; an ordeal that can be extraordinary and scary to a few people [9]. Buying a house will dependably diminish the reserve funds of a man and consequently make him/her less ready to purchase different products like oil and goods. The minimal advantages and expenses of the choice to buy a house will therefore rely upon specific factors [10].
(Abbasov & Ceyhun, 2016) Depending upon the financial stability, the prediction of the chance of selling of houses has been done as it is one of the major factor [11]. (Bhuiyan et al., 2016) Prediction of house to be sold depending upon the time-dependent house selling probability. Depending on various parameters prediction is done for final price of the house [12]. (Yu et al., (2016) Depending upon house price index of China forecasting has been done using dendritic neuron model. (Kulkarni et al., 2016) proposed a run-time Trojan detection architecture for a custom many-center dependent on Machine Learning system [14]. Various hybrid regression techniques for the house price prediction (Sifei et al., (2017) have been utilized. Contingent on different parameters of houses like form year, measure, location, etc. last house cost is settled [15]. Half rope and Angle boosting relapse methods have been used. The execution is promising as the most recent scores were positioned top 1% out of all opposition groups and people. (Debanjan and Dutta, 2017) proved that the wonder of the following or ascending of the house costs has pulled in enthusiasm from the specialist and in addition numerous other invested individuals [16]. The issue of varying house cost as a grouping issue has been discussed and applied machine learning systems to foresee whether housing costs will rise or fall. Various techniques are used like change impact factor, Information esteem, rule part examination and information change methods, for example, exception and missing wart treatment and in addition box-cox change systems. (Ling et al., 2017) Predicted whether precipitation occasions will occur on a specific day at a specific time from chronicled meteorological information using Gaussian mixture model [17]. (Zhao et al., 2017) demonstrates that the proposed calculation has critical computational proficiency, contrasted and compared to the first methodology where the outstanding efficient Cholesky decomposition is associated in solving least angle regression[18].
Recent Advancements in Various Machine
Learning Techniques
(Li, Li, and Kai-Hsuan Chu, 2017) Predicts the real estate price variation based on economic parameters [19]. The impacts of most macroeconomic parameters on real estate price variation have been examined before building up the price fluctuation prediction model.
Here, back propagation neural network (BPN) and radial basis function neural network (RBF) two schemes are employed. (Glaeser et al., 2017) used model in which homebuyers make an unassuming estimation drives house costs to show three highlights present in the information however generally missing from rational models: momentum at one-year horizons, mean reversion at five-year horizons, and excess longer-term volatility respect to basics [20]. (Chen et al., 2017) House Price Prediction has been done Using LSTM [21]. (Fan et al., 2017) used Integrated Web Service System [22]. This system is a network service for join the house value forecast and the sale of house data. (Wang et al., 2017) presented a multi-agent framework to assess optimal residential DR execution in a dissemination network, in which the primary partners are displayed by heterogeneous home agents (HAs) and a retailer agent (RA) [23]. (Chen et al., 2017) utilized a hedonic price model to analyze the connection between proximity to recently bought conservation terrains and single- family property estimations [24]. (Breiman et al., 2017) used to develop tree organized standards is the focal point of this monograph[25]. Both the pragmatic and hypothetical sides have been produced in the authors' investigation of tree techniques. Classification and Regression Trees reflects these opposite sides, covering the utilization of trees as a data analysis method, and in an increasingly numerical structure, demonstrating a portion of their major properties. One epitome of the development gives a image processing strategy to use in fitting a deformable shape model to a procured image.Cootes, (Timothy et al., 2018) performed an optimization to decide positions for the arrangement of target focuses inside the gained image dependent on the corresponding reaction images and subject to constraint by the deformable shape display [26].
(Ishwaran et al., 2018) proposed a sub- sampling approach that can be utilized to appraise the change of VIMP and for constructing confidence intervals. Apriori algorithm is classical algorithm which is inefficient due to various scans of databases and take more time if database is large [27]. So, to overcome these limitations (Pullanagari et al., 2018) used Apriori algorithm for mining frequent patterns in large databases by implementing an algorithm [28]. (Wang et al., 2018) proposed a calculation to make this prediction called canonical correlation forest algorithm with a mix of random features [29]. To evaluate the viability of the proposed algorithm, groundwater levels and meteorological information for the Daguhe River groundwater source field, in Qingdao, China, were utilized.
(Fan et al., 2018) used Machine learning algorithms which are also very useful in house price prediction [30]. Various machine learning algorithms have been used linear regression, logistic regression, decision tree, k-means, Naïve Bayes, etc. Various linear regression techniques are explained by (Richter at al., 2018) which tells how to find a relationship between dependent and independent variables using various linear regression techniques [31].
(Varma et al., 2018) had done House Price Prediction Using Machine Learning techniques and Neural Networks [32]. (Krishna et al., 2018) discovered and recovered helpful and fascinating designs from an extensive dataset [33]. (Mirza & Ali, 2018) proposed a boosted regression algorithm in an online framework [34]. The proposed calculation is ensured to converge as far as exponentially decaying regret bound as far as number of weak learners. (Kilian at al., 2018) focuses on analysis around the response of Canadian housing markets to oil value shocks [35]. Documented that, at the national dimension, genuine oil value shocks represent 11% of the variability in genuine house value growth over time. At the provincial dimension, locate that unexpected increments in the genuine cost of oil raise genuine house costs in oil-delivering locales, as well as in different areas. Build up a hypothetical model of the propagation of genuine oil value shocks across a region that helps understanding this finding. (Wang et al., (2018) Synaptic memristor has attracted in much consideration for its potential applications in artificial neural networks (ANNs) [36]. However valuable applications, all things considered, with such memristor-based systems have only from time to time been accounted for. In this paper, an ANN dependent on memristors is designed to take in a multi-variable relapse display with a back-propagation algorithm. (Tseng et al., 2018) investigate news influencing the cost of items, and set up another model for price prediction[37] . The outcomes demonstrate that significant news occasions affect the deal costs of electronic items, and can enhance the precision of price forecasts. (Jang et al., 2018) Utilized the present esteem value, least-price proportion, and log-periodic power law, this investigation inspects the bubbles in the Sejong lodging market [38].
IIPRELIMINARIES
Regression analysis is a broadly utilized measurable apparatus to set up a connection demonstrate in the middle of two factors. One factor is called an indicator varying whose esteem is assembled through investigations. The other factor is called reaction varying whose esteem is gotten from the indicator variable. There are two types of Regression: Linear Regression and Non-Linear Regression. Linear Regression otherwise called ordinary least squares (OLS) and linear least squares, is the genuine workhorse of the relapse world. Utilize straight relapse to comprehend the mean change in a reliant variable given a one-unit change in every free factor. In Linear Regression these two factors are connected through a condition, where the exponent (power) of both these factors is 1. Numerically a direct relationship speaks to a straight line when plotted as a chart. A non-straight relationship where the type of any factor isn't equivalent to 1 makes a bend. The general scientific condition for a straight relapse is:
(1) Here,
(3)
Here, pis the reaction variable, qis the indicator variable, a and b are constants which are called the coefficients, n is the number of data pairs. The correlation coefficient is a
proportion of the measure of assumption between the p and q factors, and is given by:
(4)
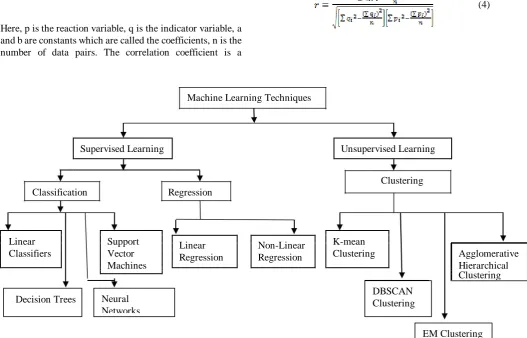
Machine Learning Techniques
Supervised Learning Unsupervised Learning
Clustering
Classification Regression
Linear Support Linear Non-Linear K-mean
Agglomerative
Classifiers Vector Regression Regression Clustering
Machines Hierarchical
Clustering
[image:3.595.50.578.96.434.2]
Decision Trees
Fig. 1. Machine learning Techniques
2.1 Non-Linear Regression: The logistic expansion of
straightforward, direct relapse is a different relapse, which considers numerous indicators. The thought is as yet the same; we are as yet making expectations or inductions 1 on the reaction, in any case, we presently have more data as different indicators. In this situation the connection between the reaction and the p indicators is displayed as:
(5)
Here, q is the reaction variable. a, b1, b2... bn are the coefficients. p1, p2, ...pn are the indicator variables.
2.1.1 Random Forest Regression: Social event procedure
called Bagging looks like Random Forests [5]. The idea behind this method is to complex design relate the few trees. Features of Random Forest are as follows:
• It is a sort of model which keeps running an extensive data set.
• Random backwoods permit treatment of thousands of info factors without variable cancellation. • It gives great appraisals of which factors are critical
in the arrangement.
Splitting criteria in Random forest:
Regression: residual sum of squares
(6)
where = mean z-value for left node. = mean z-value for right node.
Classification: Gini criterion
(7)
where =proportion of class j in left node. = proportion of class j in right node.
2.2 Neural network: A neural system is an improved model
of the manner in which the human mind forms data [32]. It works by mimicking countless handling units that look like theoretical renditions of
neurons. There are three layers in the neural network-Input layer, Hidden Neural
Networks
DBSCAN Clustering
layer, and Output layer. The is the weight of the association between the kth and the ith node. The neurons in the input layer get the information and exchange them to neurons in the first hidden layer through the weighted connections.
Here, the information is numerically prepared and the outcome is exchanged to the neurons in the following layer. Interim Activity of the neuron is shown as:
(8)
is yield of the neuron which is the result of some activation function of significant worth . Activation function acts as a squashing capacity, to such an extent that the yield of a neuron in a neural system is between sure qualities (typically 0 and 1, or ‐1 and 1). There are three kind of activation function, represented by . There is the Threshold Function which goes up against an estimate of 0 if the summed information is not as much as certain limit esteem (v), and the esteem 1 if the summed information is more than or equivalent to the threshold value.
(9) (10) There is sigmoidal function as follows:
(11)
2.3 Logistic Regression: The Logistic Regression is a
relapse demonstrates in which the reaction variable (subordinate variable) has clear-cut qualities, for example, True/False or 0/1. It really measures the likelihood of a twofold reaction as the estimation of reaction variable in view of the numerical condition relating it to the indicator factors [4].
The general scientific condition for logistic relapse is given below:
(12)
Here, q is the reaction variable, p is the indicator variable, a and b are the coefficients which are numeric constants.
2.4 Naïve Bayes:The Naive Bayes learning plan performs
well on most classification assignments, and is frequently altogether more exact than more sophisticated strategies. Despite the fact that the likelihood estimates that it produces can be inaccurate, it often assigns the greatest likelihood to the right class. This proposes its great execution may be limited to circumstances where the output is categorical [3]. Naive Bayes achieves this by applying Bayes’ theorem and assuming independence of the attributes X1, X2,...,Xm given the target value Z. Bayes’ theorem states that:
(13)
where the likelihood p(E | Z ) is the probability density function and E is event.
2.5 Decision Tree: [1] Decision tree assembles
regression or classification models as a tree structure. It separates a dataset into smaller and smaller subsets while in the meantime a related choice tree is incrementally created. The last outcome is a decision tree with nodes and leaf nodes. There are two fundamental elements of a decision tree program: 1) choosing the best attribute to separate a set at each branch, and 2) Choosing whether each branch is justified sufficiently. The diverse decision tree methods vary in how these are accomplished. One of the methods is ID3. In the ID3 programs, the best trait is dictated by figuring the information gain proportion. The information gain for attribute B is:
(14)
where
2.6 Support Vector Machine: Support Vector Machine
(SVM) is an effective Supervised machine learning calculation which gives great speculation execution for both classification and regression. SVM calculation adapts training information comprising of highlights and its desired class, to model and develop the weighted function for test data prediction [15]. It comprises of two stages: "learning stage" where SVM recognizes nearest data points to decision limit known as Support Vectors (SVs), which frames best partition among the classes. These SVs are utilized to predict the class of test record in the "prediction stage". Future test record can be predicted using below equation:
(15)
where weight vector, X is test record and b is bias.
2.7 Gradient Boosted Regression: Gradient boosting is a
machine learning method for regression and classification issues, which delivers a prediction model in the form of weak prediction models, commonly decision trees. The target of any supervised learning algorithm is to characterize a loss function and limit it. We have MSE (mean squared error) as loss defined below:
(16)
where is ith target value, is ith prediction, is Loss function.
Loss function needs to be minimum for our predictions by using gradient descent and update our predictions. Find the value where MSE is minimum is given below:
where is learning rate, is sum of residuals.
2.8 Hopified Network: Hopified network is a neural
network which works on number of binary patterns and in the end returns the one which is most similar to a given input [2]. It is made out of just a single layer of nodes or units every one of which is associated with all the others however not itself. It is therefore a feedback network, which implies that its outputs are diverted to its inputs.
Each unit acts as an information and an output of the system. Hence, the number of inputs, outputs and nodes of the network are equal. Each node’s state converges which means that the state of each node becomes fixed after various updates. The input received by node N, also called as weighted input sum of node N can be defined as:
(18)
where is the connectivity weight between k and l, is state of node 1.
2.9 Least Angle Regression: The motivation behind model selection algorithms such as All Subsets, Forward selection and Backward Elimination is to pick a linear model based on a similar arrangement of information to which the model will be applied [18]. Typically we have available an extensive accumulation of possible covariates from which we want to choose a tightfisted set for the effective prediction of a response variable. It is a new model selection algorithm, is a very useful and greedy version of traditional forward selection methods. Three primary properties are inferred: (1) A basic alteration of the LARS calculation executes the Lasso, an appealing version of ordinary least squares that compels the sum of the absolute regression coefficients; the LARS adjustment figures all possible Lasso estimates for a given issue, utilizing an order of magnitude less computer time than previous techniques. (2) An alternate LARS alteration efficiently implements Forward Stage wise linear regression, another promising new model selection strategy. Let us consider the system of state equation:
(19) where K and L denote the observation matrices of response and input variables respectively, denotes the vector of unknown parameters. The traditional Least Square Technique relies upon ID of obscure parameters
in linear model () by solution the task,
(20)
where , denotes and Euclidean norm.
2.10 Gaussian Mixture: A Gaussian mixture model is a
probabilistic model that expects all the information focuses are created from a mixture of a limited number of Gaussian distributions with unknown parameters [17]. One can consider mixture models as summing up k-mean clustering
to consolidate data about the co-variance structure of the information and the centers of the latent Gaussians. Given an n-dimensional vector y, a Gaussian mixture probability density function can be written as follows:
(21) where m represents the number of mixture components, and
mixture weights , =1 and .
2.11 Multilayer Perceptron: A multilayer perceptron is a
neural system interfacing various layers in a directed graph, which implies that the signal path through the nodes just goes one way. Every node, aside from the input nodes, has a non linear activation function [10]. A MLP utilizes back propagation as a supervised learning method. Since there are different layers of neurons, MLP is a deep learning strategy. MLP is broadly utilized for solving problems of issues that require supervised learning and in addition examination into computational neuroscience and parallel distributed processing. Applications include speech recognition, image recognition and machine translation. The equation for an aggregate of the incoming messages is described below:
(22)
where is weight of input unit, is activation value of unit j and n is number of units.
IIIPERFORMANCEMETRICS
Performance metrics are used to analyze the quality of various machine learning techniques.
3.1 Classification: Classification is the way of predicting
the class of given information points. Classes are called as targets or categories.
3.1.1 Linear Classifiers: A Classifier that makes its
classification dependent on a linear indicator function joining a set of weights with the feature vector. Linear Classifiers are calculated as follows:
(23)
3.1.2 Decision Trees: Decision Trees are a kind of
Supervised Machine Learning where the information is consistently split as indicated by a specific parameter. The tree can be clarified by two elements , namely decision nodes and leaves. The leaves are the decisions or the final results. There are two terms connected with decision trees- Entropy and Information gain.
Entropy is degree of randomness of components, it is proportion of contamination. Numerically, it can be calculated with the assistance of probability of the things as:
(24)
should be done. It is calculated as follows:
(25)
3.1.3 Neural Networks: In neural networks, every unit performs a generally basic activity: get input from neighbors or outside sources and utilize this to compute an output signal which is spread to different units. Apart from this processing, there is the task of the adjustment of the weights.
(26) Output from the above equation gives the final output which is as follows:
(27)
3.1.4 Support vector machines: A Support Vector Machine (SVM) is a discriminative classifier formally characterized by an isolating hyperplane. In other words, given labeled training information, the calculation outputs an ideal hyperplane which classifies new examples. In two dimensional space this hyperplane is a line partitioning a plane in two sections where in each class lay in either side. To understand the algorithm of SVM, consider two cases:
Separable case:Unbounded limits are possible to isolate the
information into two classes. To locate the optimal hyperplane, utilize the following condition:
(28) where p.x is a scalar product of p and x.
Non Separable case:Two classes are not isolated but rather
overlap with one another. A term measuring the
classification error must add to each of the following two conditions:
I. For every k, (correction
separation).
3.2.2 Non-Linear Regression: Non-linear regression models the dependent variable as a function of a mix of nonlinear parameters and at least one independent variable. The model can be univariate or multivariate. The parameters can appear as an exponential, trigonometric, power, or some other non-linear function. To decide the nonlinear parameter appraises, an iterative calculation is normally utilized.
(30) where is non-linear parameter evaluations to be processed and is error term.
II. is minimal(greatest margin).
3.2 Regression:
3.2.1 Linear Regression: Linear Regression is a direct methodology for demonstrating the connection between a scalar dependent variable q and an independent variable p.
(29)
where p,q,w are vectors of real numbers and w is vector of weight parameter.
[image:6.595.46.567.510.790.2]IV COMPARATIVE ANALYSIS OF MACHINE LEARNING TECHNIQUES
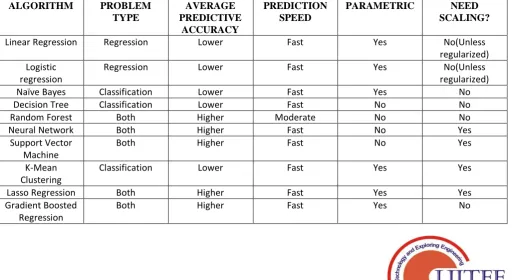
Table I. Comparative Analysis
ALGORITHM PROBLEM
TYPE
AVERAGE PREDICTIVE
ACCURACY
PREDICTION SPEED
PARAMETRIC NEED
SCALING?
Linear Regression Regression Lower Fast Yes No(Unless
regularized) Logistic
regression
Regression Lower Fast Yes No(Unless
regularized)
Naïve Bayes Classification Lower Fast Yes No
Decision Tree Classification Lower Fast No No
Random Forest Both Higher Moderate No No
Neural Network Both Higher Fast No Yes
Support Vector Machine
Both Higher Fast No Yes
K-Mean Clustering
Classification Lower Fast Yes Yes
Lasso Regression Both Higher Fast Yes Yes
Gradient Boosted Regression
Hopified Network Both Higher Fast No No Least Angle
Regression
Both Lower Fast Yes Yes
Hierarchical Clustering
Both Higher Slow No Yes
Gaussian Mixture Both Higher Slow No No
Multilayer Perceptron
Both Higher Fast No No
Predictive Apriori Regression Higher Fast No Yes
[image:7.595.45.558.214.451.2]Table II. Comparative Analysis
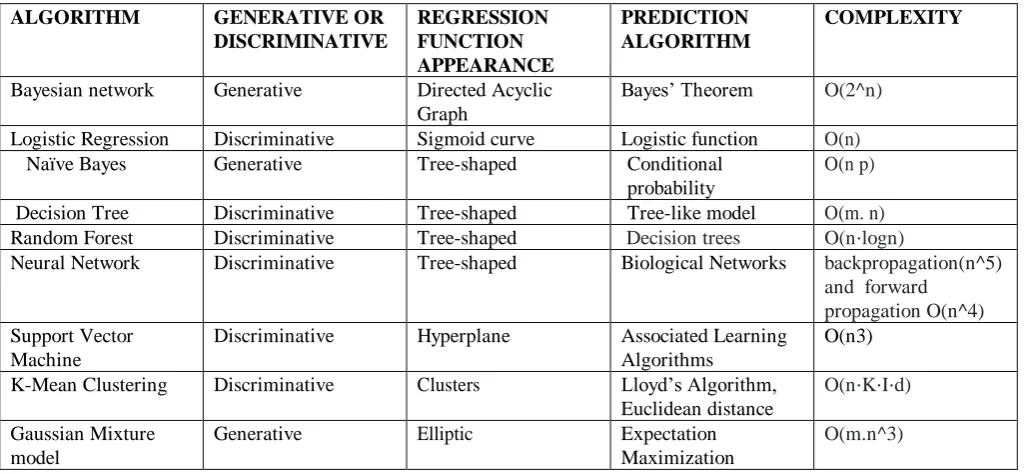
ALGORITHM GENERATIVE OR
DISCRIMINATIVE
REGRESSION FUNCTION APPEARANCE
PREDICTION ALGORITHM
COMPLEXITY
Bayesian network Generative Directed Acyclic
Graph
Bayes’ Theorem O(2^n)
Logistic Regression Discriminative Sigmoid curve Logistic function O(n)
Naïve Bayes Generative Tree-shaped Conditional
probability
O(n p)
Decision Tree Discriminative Tree-shaped Tree-like model O(m. n)
Random Forest Discriminative Tree-shaped Decision trees O(n⋅logn)
Neural Network Discriminative Tree-shaped Biological Networks backpropagation(n^5)
and forward propagation O(n^4) Support Vector
Machine
Discriminative Hyperplane Associated Learning
Algorithms
O(n3)
K-Mean Clustering Discriminative Clusters Lloyd’s Algorithm,
Euclidean distance
O(n⋅K⋅I⋅d)
Gaussian Mixture model
Generative Elliptic Expectation
Maximization
[image:7.595.45.562.497.765.2]O(m.n^3)
Table III. Comparative Analysis
ALGORITHM APPLICATIONS HANDLING
MISSING VALUES
ROBUSTNESS TO OUTLIERS
LOSS FUNCTION
Neural Network Regression analysis, Classification, Data processing
Poor Poor
Support Vector Machine
Text and hypertext categorization, Classification of images
Poor Poor Hinge loss:
Decision Tree Customer
Relationship Management, Fraud detection
Good Good for large dataset Either –log P(N|M) or
zero-one loss
Random Forest Classification,
Regression, Constructing a multitude of decision trees
Good Good Either –log P(N|M) or
K-Mean Clustering Market segmentation, Computer vision, Geostatistics
Good Good Zero-one loss
Logistic Regression Credit scoring, Image Segmentation and Categorization
Good Good -log P(M|N)
Naïve Bayes Real-time Prediction,
Multi-class Prediction
Good Good for small dataset -log P(M,N)
V APPLICATIONS
Medical:Estimation ofstandard liver weight for evaluating
sufficiency’s of graft size in live contributor liver transplantation and remainder liver in major hepatectomy for cancer.
Business: The most widely recognized utilization of
machine learning techniques in business is to predict the events that still can't seem to happen. Demand analysis, for example, predicts what number of units customers will buy.
Banking:Machine learning techniques enable a bank to set
credit criteria for the overall population, and assemble a statistical formula predicting how new records will perform later on, that is, their ability to repay debt, by studying a sample of existing records.
Whether Forecast:Weather for future is a standout amongst
the most important attribute to forecast since agribusiness divisions, as well as numerous businesses, are to a great extent subject to the climate conditions. Machine learning technique helps to predict the state of the atmosphere for a future time and a given location.
VI GAPS IN LITERATURE
The comparative study of the existing techniques shows that the most of the existing techniques suffer from various issues. Some of the common neglected issues are discussed as follows:
6.1 Over-fitting issue: The cause of poor performance in
machine learning is either overfitting or under fitting the data. It has been found that the majority of the existing machine learning techniques suffer from the over-fitting issue. Overfitting refers to a model that models the training data too well. Overfitting happens when a model learns the detail and noise in the training data to the extent that it negatively impacts the performance of the model on new data. This means that the noise or random fluctuations in the training data is picked up and learned as concepts by the model. The problem is that these concepts do not apply to new data and negatively impact the models ability to generalize.
6.2 Ensemble: The reviewers have proven that the ensemble
based supervised learning provides better results compared to standard models. However, in the field of machine learning the use of Ensembling techniques have been neglected by the majority of existing researchers.
6.3 Parameter tuning: Usually machine-learning
algorithms have parameters which need to be learned by looking at the data. These are the support vectors in SVMs,
the decision nodes in Random forests and Decision trees and the weights in the no omnipresent Neural Networks. There are however things which are not learned from the data and must be defined by the person using these algorithms. These include the kernel and C value in the SVM, the architecture and learning rate of the Neural network, the criteria used to split nodes in a Decision tree and the number of trees in a Random Forest. There are many others besides these. Since these are not learned, they are supplied by the programmer/scientist. Now, these hyper parameters affect the performance of the model significantly and so finding the right values by using optimization for these parameters is important.
VIIEDITORIALPOLICY
The submitting author is responsible for obtaining agreement of all coauthors and any consent required from sponsors before submitting a paper. It is the obligation of the authors to cite relevant prior work.
Authors of rejected papers may revise and resubmit them to the journal again
VIIIPUBLICATIONPRINCIPLES
The contents of the journal are peer-reviewed and archival. The journal INTERNATIONAL JOURNAL OF ENGINEERING AND ADVANCED TECHNOLOGY (IJEAT) publishes scholarly articles of archival value as well as tutorial expositions and critical reviews of classical subjects and topics of current interest.
Authors should consider the following points:
1) Technical papers submitted for publication must advance the state of knowledge and must cite relevant prior work.
2) The length of a submitted paper should be commensurate with the importance, or appropriate to the complexity, of the work. For example, an obvious extension of previously published work might not be appropriate for publication or might be adequately treated in just a few pages.
3) Authors must convince both peer reviewers and the editors of the scientific and technical merit of a paper; the standards of proof are higher when extraordinary or unexpected results are reported.
Because replication is required for scientific progress, papers submitted for publication must provide sufficient information to allow readers
to perform similar
Although not everything need be disclosed, a paper must contain new, useable, and fully described information. For example, a specimen's chemical composition need not be reported if the main purpose of a paper is to introduce a new measurement technique. Authors should expect to be challenged by reviewers if the results are not supported by adequate data and critical details.
IX CONCLUSION
Machine learning techniques play a significant role in various artificial intelligence based applications. Many machine learning techniques have been designed and implemented so far to improve the classification and prediction rate for various applications. From the existing review, it has been found that the existing techniques suffer from the over-fitting, ensembling and parameter tuning issues. Therefore, efficient tuning of competitive machine
learning techniques can improve the
classification/prediction accuracy of the existing techniques.
REFERENCES:
1 Long, William J., et al. "A comparison of logistic regression to decision-tree induction in a medical domain." Computers and
Biomedical Research 26.1 (1993): 74-97.
2 Hemminger, Thomas L., and Carlos A. Raez. "Using a Hopfield network for rotation and scale independent pattern recognition." Neural Networks, 1994. IEEE World Congress on Computational
Intelligence., 1994 IEEE International Conferenceon. Vol. 5. IEEE,
1994.
3 Frank, Eibe, et al. "Naive Bayes for regression." Machine Learning 41.1 (2000): 5-25.
4 Peng, Chao-Ying Joanne, Kuk Lida Lee, and Gary M. Ingersoll. "An introduction to logistic regression analysis and reporting." Thejournal of
educational research 96.1 (2002): 3-14.
5 Liaw, Andy, and Matthew Wiener. "Classification and regression by randomForest." R news 2.3 (2002): 18-22.
6 -Uriarte, Ramón, and Sara Alvarez De Andres. "Gene selection and classification of microarray data using random forest." BMC bioinformatics 7.1 (2006): 3.
7 Archer, Kellie J., and Ryan V. Kimes. "Empirical characterization of random forest variable importance measures." ComputationalStatistics & Data Analysis 52.4 (2008): 2249-2260.
8 Sharma, Mukesh, J. Choudhary, and G. Sharma. "Evaluating the performance of apriori and predictive apriori algorithm to find new association rules based on the statistical measures of datasets."
International Journal of Engineering Research & Technology(IJERT)
1.6 (2012).
9 Khamis, Azme Bin, and NurKhalidah Khalilah BintiKamarudin. "Comparative Study On Estimate House Price Using Statistical And Neural Network Model." International Journal of Scientific &
Technology Research 3.12 (2014): 126-131.
10 Yui, Hiroaki, and SubhashBhalla. "An Evaluation of Classification Accuracy in a Multilayer Perceptron." Proceedings of theInternational
Workshop on Applications in Information Technology (IWAIT-2015).
2015.
11 Abbasov, Ceyhun. "The prediction of the chance of selling of houses as the factor of financial stability." Application of Information and Communication Technologies (AICT), 2016 IEEE 10th International
Conference on. IEEE, 2016.
12 Bhuiyan, Mansurul, and Mohammad Al Hasan. "Waiting to be sold: Prediction of time-dependent house selling probability." DataScience and Advanced Analytics (DSAA), 2016 IEEE International Conference on. IEEE, 2016.
13 Yu, Ying, et al. "Forecasting house price index of China using dendritic neuron model." Progress in Informatics and Computing(PIC), 2016. 14 Kulkarni, Amey, Youngok Pino, and Tinoosh Mohsenin. "SVM-based
real-time hardware Trojan detection for many-core platform." Quality
Electronic Design (ISQED), 2016 17th International Symposium on.
IEEE, 2016.
15 Lu, Sifei, et al. "A hybrid regression technique for house prices prediction." Industrial Engineering and Engineering Management
(IEEM), 2017 IEEE International Conference on. IEEE, 2017.
16 Banerjee, Debanjan, and Suchibrota Dutta. "Predicting the housing price direction using machine learning techniques." 2017 IEEEInternational Conference on Power, Control, Signals and Instrumentation
Engineering (ICPCSI). IEEE, 2017.
17 Ling, Haitian, and Kunping Zhu. "Predicting Precipitation Events Using Gaussian Mixture Model." Journal of Data Analysis andInformation
Processing 5.04 (2017): 131.
18 Zhao, Wanqing, Thomas H. Beach, and YacineRezgui. "Efficient least angle regression for identification of linear-in-the-parameters models."
Proc. R. Soc. A 473.2198 (2017): 20160775.
19 Li, Li, and Kai-Hsuan Chu. "Prediction of real estate price variation based on economic parameters." Applied System Innovation (ICASI),
2017 International Conference on. IEEE, 2017.
20 Glaeser, Edward L., and Charles G. Nathanson. "An extrapolative model of house price dynamics." Journal of Financial Economics 126.1 (2017): 147-170.
21 Chen, Xiaochen, Lai Wei, and Jiaxin Xu. "House Price Prediction Using LSTM." arXiv preprint arXiv:1709.08432(2017).
22 Fan, Chia-Chen, et al. "A House Price Prediction for Integrated Web Service System of Taiwan Districts." International Conference on
Genetic and Evolutionary Computing. Springer, Singapore, 2017.
23 Wang, Zhanle, and Raman Paranjape. "Optimal residential demand response for multiple heterogeneous homes with real-time price prediction in a multiagent framework." IEEE transactions on smart grid 8.3 (2017): 1173-1184.
24 Chen, Dan, et al. "Influence of Public Conservation Acquisition on Surrounding Residential Property Values in Gainesville, Florida."
Journal of Urban Planning and Development 143.3 (2017):
04017003.
25 Breiman, Leo. Classification and regression trees. Routledge, 2017. 26 Cootes, Timothy, Claudia Lindner, and MirceaIonita. "Image processing
apparatus and method for fitting a deformable shape model to an image using random forest regression voting." U.S. Patent No. 9,928,443. 27 Mar. 2018.
27 Ishwaran, Hemant, and Min Lu. "Standard errors and confidence intervals for variable importance in random forest regression, classification, and survival." Statistics in medicine(2018).
28 Pullanagari, Rajasheker, Gabor Kereszturi, and Ian Yule. "Integrating airborne hyperspectral, topographic, and soil data for estimating pasture quality using recursive feature elimination with random forest regression." Remote Sensing10.7 (2018): 1117.
29 Wang, Xuanhui, et al. "Short-term prediction of groundwater level using improved random forest regression with a combination of random features." Applied Water Science 8.5 (2018): 125.
30 Fan, Chenchen, Zechen Cui, and XiaofengZhong. "House Prices Prediction with Machine Learning Algorithms." Proceedings of the 2018 10th International Conference on Machine Learning and
Computing. ACM, 2018.
31 Richter, Christel, and Hans-Peter Piepho. "Linear regression techniques."
Applied Statistics in Agricultural, Biological, and Environmental
Sciences applied statistics (2018): 107-176.
32 Varma, Ayush, et al. "House Price Prediction Using Machine Learning and Neural Networks." 2018 Second InternationalConference on
Inventive Communication and Computational Technologies (ICICCT).
IEEE, 2018.
33 Krishna, Bhukya, and GeetanjaliAmarawat. "An Enhanced Scaling Apriori for Association Rule Mining with Frequent Item Set Mining." (2018): 102-106.
34 Mirza, Ali H. "Online boosting algorithm for regression with additive and multiplicative updates." 2018 26th Signal Processing and
Communications Applications Conference (SIU). IEEE, 2018.
Photo
36 Wang, J. J., et al. "Predicting house price with a memristor-based artificial neural network." IEEE Access 6 (2018): 16523-16528. 37 Tseng, Kuo-Kun, et al. "Price prediction of e-commerce products through
Internet sentiment analysis." Electronic Commerce Research 18.1 (2018): 65-88.
38 Jang, Hanwool, et al. "Detection and Prediction of House Price Bubbles: Evidence from a New City." International Conference on
Computational Science. Springer, Cham, 2018.
AUTHORSPROFILE
Jaspreet Kaur doing her Master of Engineering in Computer Science from Chandigarh University, Punjab. Her research interest includes Machine Learning, Data Science , Artificial Intelligence.
Dilbag Singh received his PhD degree from Department of Computer Science and Engineering, Thapar Institute of Engineering and Technology, Patiala. He has done his Master in Technology (Computer Science and Engineering) from Guru Nanak Dev University, Amritsar, Punjab, India (2012). Currenty, he is working as an assistant professor at Chandigarh University, Gharuan, Mohali, Punjab, India.He has published more than 23 research papers in well-known reputed journals and international conferences. His research interest includes Wireless sensor networks, Digital image processing and Meta-heuristic techniques.