International Journal of Innovative Technology and Exploring Engineering (IJITEE) ISSN: 2278-3075,Volume-8 Issue-12, October, 2019
Abstract: Human eye is covered with mucous like thin membrane on the outer surface as well as inner surface of the eyelids. The thin membrane covering the outer surface is called as bulbar conjunctiva. Conjunctiva hyperemia refers to the redness of the conjunctiva. There are several reasons for this condition, some of which are related to pathologies like trauma, allergy, injury, prolonged use of lenses or glaucoma. Hence, it is one of the most vital parameter to diagnose these pathologies. For populous developing countries like India, ratio of ophthalmologist to citizen is highly skewed which negatively affects the public health. This gives rise to need for developing technology based solutions for initial screening of eye problems like conjunctiva hyperemia. This paper presents a framework for classifying normal versus red eyes using deep learning technique of convolution neural network (CNN). The model has shown promising results with 94% accuracy.
Keywords : Hyperemia, Convolutional Neural Network, Bulbar Redness, Healthy Eyes.
I. INTRODUCTION
T There are many areas of human eye, which one cannot see with naked eye. One of them is a thin membrane, which covers part of the outer and inner surface of the eye. The membrane covering the sclera (white portion of the eye) is known as bulbar conjunctiva and the membrane covering the inner surface of eyelids is known as palpebral conjunctiva [1]. The primary function of this membrane is to protect the eyes from dust and various microorganisms. It acts like a lubricant, which eases the opening and closing of eyes. The inflammation of conjunctiva, also known as conjunctivitis results in the redness of this area. This occurs when there is an engorgement in blood vessels, which results into accumulation of blood there by giving red coloration in this area. A thorough study of this condition, also popularly referred to as hyperemia, erythema or conjunctival injection, can lead to the examination of various pathologies like complications resulting from contact lenses, allergies, dry eye [2] [3] etc. In addition, it helps in measuring their rapid growth and reaction to certain types of treatments. Timely diagnosis of this condition is very essential for proper treatment otherwise, it could lead to loss of vision.
Revised Manuscript Received on October 10, 2019
Sherry Verma*, school of engineering and technology, Ansal University, Gurgaon, India. Email: [email protected]
Latika Duhan, school of engineering and technology, Ansal University, Gurgaon, India. Email: latikaduhan@ ansaluniversity.edu.in
Monica Chaudhry, sushant school of health science, Ansal University, Gurgaon, India. Email: monicachaudhry@ ansaluniversity.edu.in
The ophthalmologist to population ratio in developing nations is highly skewed. In urban India, this ratio is 1:25000 whereas in rural India it is as low as 1:219000 [4]. It is very challenging for handful of these practitioners to cater for the entire population. However, technology can provide solutions for initial screening of eye problems like conjunctiva hyperemia. Due to all these factors, there is a need of automation, which will detect bulbar hyperemia. Scholars have done work [5] [6] [7] in this regard in recent past using concepts of machine learning like classification and regression. However, these approaches are solely based on feature extraction, which needs to be defined and calculated very carefully. The present study investigates this problem by training a convolution neural network to differentiate between normal and red eye. In a study [8], subjective and objective assessment of hyperemia was being made using correlation analysis. This was an interesting work, which showed the linear association among clinical grades of redness and automated approach that focused on finding number of vessel in a smaller area. Unfortunately, this work took into consideration a very specific and small area of conjunctiva rather than the entire area. Moreover, it was very different from the actual clinical grading methodology. In another study [9] automated approach was developed to grade the redness in human eye by applying canny edge detection method for feature extraction after isolating the sclera region using segmentation. It overcame the drawback of earlier proposed method [8] by considering both the nasal and temporal area of the eye. However, the work still required ophthalmologist intervention and took into consideration very few features for analysis. In addition, the computation time was high. A similar study [10] performed image analysis using Bayesian classifier. The study took into consideration only two major features of redness and appearance of blood vessels to minimize human intervention and to remove inconsistencies related to clinical grading. Nevertheless, it still was dependent on human intervention for segmentation. In [11] digital image analysis methods like thresh holding, color extraction and edge detection were used. Further to have results that are more accurate, correlation between the digital image analysis techniques and the grading scale was performed. The results showed that out of all methods, edge detection was found to be most stable to luminance intensity; also, it correlated well with CCLRU (cornea and contact lens research unit) grades. Another study [12] presents a framework to grade bulbar conjunctival hyperemia using CCLRU. However, this work was highly dependent on optometrists reading and did not involve automated approach.
Evaluation of Convolutional Neural Network
Model for Classifying Red and Healthy Eye
Later in [13] new grading scale for grading bulbar hyperemia was developed which performed well in clinical setting. The focus was more on presenting grading scales, which could produce repeatable results, but it was totally dependent on human intervention. Need for manual work was minimized by developing an automated approach for frame selection in a study [14]. This work reduced the time involved and was primarily based on lightness. This work was extended and an automated approach for hyperemia grading was developed using artificial neural network. The study used two approaches namely radial basis function (RBF) and multi-layer perceptron (MLP) [15]. The results showed the MLP approach was giving better results and it also identified the best feature to be used for grading. However, the study took into consideration few features and also the extraction of region of interest did not include the entire conjunctiva. In [7] large number of features were defined and it compared various machine learning techniques in grading the redness of eye namely classification and regression and transformed large number of features to a value in two given scales(Efron, CCLRU). The study showed that the system was able to achieve 90% accuracy on Efron scale and more than 90% on CCLRU scale with a margin of ±0.5. The present study is an extension of all these where, a convolution neural network is trained using database of red and healthy eye to identify between the two conditions of the eye. The remaining sections of paper are organized as follows. Section II, briefly discusses the functionality of CNN. Section III explains the methodology used including data collection and the proposed model. The results and conclusion are presented in Section IV and Section V respectively.
II. CONVOLUTIONALNEURALNETWORK
Human brain is made up of neurons, which are interconnected in a complex way to process huge amount of information. Artificial neural networks are simulation of biological neural networks. Prime usage of these networks include data classification and clustering, pattern matching, feature extraction and vector quantization [16]. These networks are broadly classified into four categories each having a different approach to process the complex data. These are feedback, feed forward, classification-prediction neural network and recurrent neural network. In feedback neural network, the output is being fed back to the network to achieve high accuracy in results [17]. The feedback network feeds information back into itself and is well suited to solve optimization problems [18]. Recurrent neural network are type of feedback networks with loops [19]. In these type of networks, the output of a particular layer is saved and fed back to the input. While predicting, if the output is wrong, the system tries to fix it through self-learning and backpropagation. Feed forward neural network or MLP consists of input layer, output layer and neurons layers (hidden layers) [20]. There are no feedback connections or loops in this network. Here the data passes through the input nodes till it reaches the output nodes. The sum of the products of the inputs and their weights are calculated and are then fed to the output. Depending on how many layers of neurons they have, they are categorized as single layer or multi-layer feed forward neural network.
[image:2.595.308.519.426.504.2]mining the new pattern from huge amount of raw data available. It is a subset of feed forward neural network. Normal neural network lacks in efficient feature learning, also images are not scalable in them. In recent years, deep learning has won on various fronts like pattern recognition, speech recognition, medical research etc. [21]. Deep learning is a special case of machine learning technique that teaches computer to achieve state-of-the-art accuracy sometimes surpassing human performance. Deep learning models are usually referred to as deep neural networks. Here the term deep refers to more number of hidden layers. Traditional neural network has only fewer numbers of hidden layers whereas deep neural networks can have as many as 150 hidden layers. Convolutional neural networks are one of the most popular deep neural networks. Convolutional neural networks have high feature extraction and images are scalable in them. A 3D input image will result in 3D output image. They work by extracting features from the images directly thereby eliminating the need for manual feature extraction. Convolutional neural network is a type of deep neural network, which have neurons, arranged in three dimensions namely width, height and depth [22]. Fig. 1[23] shows the general architecture of a convolutional neural network. It comprises of three main layers, input layer, hidden layer and output layer. A CNN can have tens to hundreds of hidden layers depending on the classification task and the amount of data. The hidden layer consists of convolutional layer, rectified linear unit (ReLU) layer, pooling layer and fully connected layer. All these layers are stacked together to build full Convonet. These are explained as follows in detail.
Fig. 1. Architecture of Convolutional Neural Network [23]
A. Convolutional Layer
International Journal of Innovative Technology and Exploring Engineering (IJITEE) ISSN: 2278-3075,Volume-8 Issue-12, October, 2019
𝑓(𝑥) = 𝑚𝑎𝑥(0, 𝑥) (1)
𝑅𝑒𝐿𝑈 𝑥 = 𝑥 𝑖𝑓 𝑥 ≥ 0 0 𝑖𝑓 𝑥 < 0 (2)
A rectified linear unit has output 0 if input s less than 0 and output is equal to input if input is greater than 0.
B. Pooling Layer
Pooling layer is added after nonlinearity (e.g. ReLU) has been applied to the feature maps output by a convolutional layer. The main task of the pooling layer is to reduce the dimensionality of the complex image by restoring the important features of an image. It also results in less computational power required to process the data. Max Pooling is one of the commonly used pooling methods. It selects the maximum value from the convolved image produced by the filter [26]. It also suppresses the noise by discarding it. After every convolutional layer, there is a pooling layer to reduce the size of the image. Fig 2 shows the output of Max pooling when a filter of size 2*2 is applied on input of size 4*4 with stride of two.
1 2 1 4
6 9 8 4
0 6 4 7
[image:3.595.69.503.347.641.2]5 3 2 1
Fig. 2. Max pooling
C.Fully Connected Layer
The model is able to understand the features well after going through the series of convolutional and pooling layer. At the end of the network, the output is flattened and fed to the regular neural network and backpropagation is applied to every iteration of training. After number of epochs, the model will be able to accurately classify images using Softmax classification. It gives the actual probability score of the class labels.
III. METHODOLOGY
A. Data Collection
Thirty images of bulbar redness were used and thirty images of healthy eyes were used. The images were captured through three step slit lamp model number HUVITZ 500N using CANON EOS 1300Dcamera attached to it by vision center of school of health sciences. The images were imported through the software HIS500N (HUVITZ imaging slit lamp).
B. Proposed System
The proposed model of classifying red eye and healthy eye using convolutional neural network is shown in Fig 3. The model is divided into two phases of training and testing. 75% of the input dataset was used for training and the rest 25% for used for testing. During the training phase, functionality like preprocessing, feature extraction and classification is performed. The images are divided into two categories using label names as red and healthy.
Fig. 3. Proposed model of classifying red eye and healthy eye using CNN
Initially, the labels are being fed to the training data. Hyper parameters like number of Epochs=25, Batch Size=32 and initial learning rate equivalent to 0.01are defined. Later, the decay is calculated using the initial learning rate and epochs as shown in Eq. (3).
Decay = Initial learning rate / Epochs (3)
To compile the model, the image size of 28*28*3 is fed to the model. Further, Adam optimizer is used to update the network weights iteratively based on the training data and binary cross entropy as shown in Eq. (4), is used as the loss function to find the loss/error. The loss function is very crucial from accuracy point of view.
9 8
6 7
Accuracy and loss function are inversely proportional to each other. The high the loss, lesser is the accuracy and vice versa.
𝐵𝐶𝐸 = −1
𝐾 𝑤𝑘 𝑡𝑘log 𝑠𝑘 + 1 − 𝑠𝑘 log 1 − 𝑠𝑘 𝐾
𝑘=1
(4)
𝑤
𝑘 : Weighting factor associated with loss of a class𝑡
𝑘 ϵ0,1
: Binary label of the target class [image:4.595.308.562.356.716.2]𝑠
𝑘 ϵ0,1
: Classification probabilty score from the NN K: Total number of classes This is a three-layer CNN based eye classifier – two convolutional layers and one fully connected layer, apart from input layer and output layer. The model was coded in Python using Keras as one of the framework, which is one of the most efficient deep learning frameworks. The first convolutional layer filters the 23*23*3 input image with 20 kernels of size 5*5. Then ReLU activation function (Eq. (2)) is applied. Further, Max pooling is applied to reduce the dimensionality with pool size of 2*2 and stride of 2*2. In the second convolutional, layer 50 filters with kernel size of 5*5 are applied on the output of the first convolutional layer. On the convolved image, ReLU (Rectified Linear Unit) activation function is applied. After this, max pooling is applied to reduce the dimensionality with pool size of 2*2 and stride of 2*2. Further, the output of the second convolutional layer is flattened and fed to the fully connected neural network layer with 500 neurons. In the end, Softmax classifier is used to classify the output. jOver fitting is a situation that exists when your model is showing accuracy on train data but not on the test data, which are without labels. To combat this one of the easiest and common way is to enlarge the dataset artificially by applying various kinds of transformations [27] [28] [29].The input data is augmented using ImageDataGenerator class of Keras framework. The transformations applied to augment the data are provided in Table I.Table-I: Various transformations applied Transformation value
rotation_range 30 width_shift 0.1
height_shift 0.1 shear range 0.2 zoom range 0.2 horizontal_flip true
fill mode nearest
IV. RESULTS
In each layer max pool as well as ReLU, activation function is applied. After defining various parameters for building this architecture, our model was trained. Though the input image set is not quite huge but as it goes deeper while learning it becomes more complex. Therefore, images are divided into small batches and fed to the network. Binary cross entropy is used to find out errors. Total error rate also termed as cost is then evaluated. The main purpose is to reduce the cost during the learning process. Adam optimizer is used to achieve this purpose
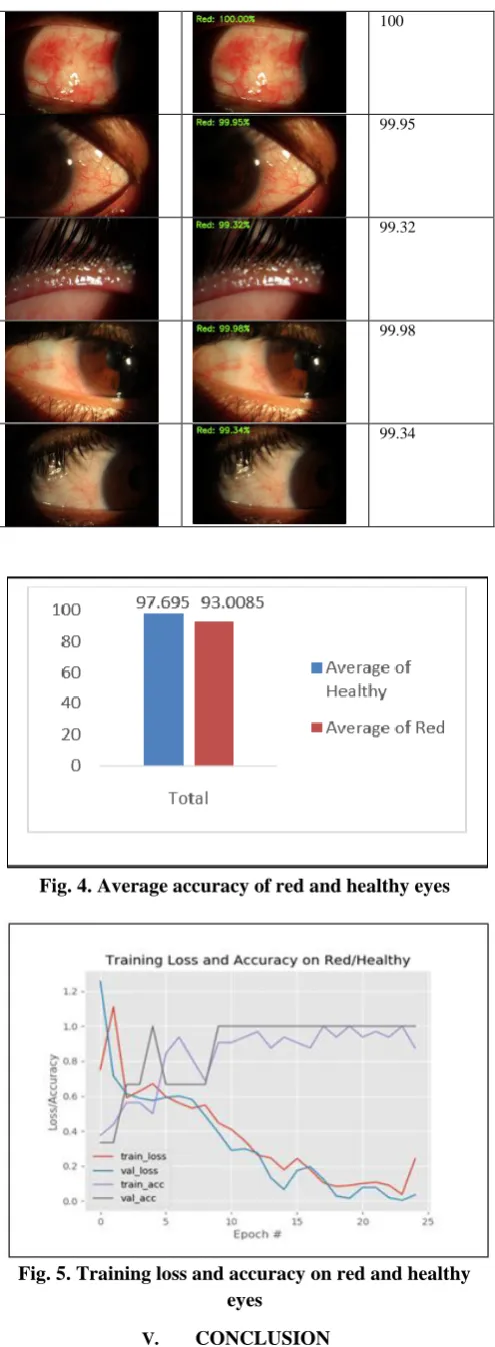
used for training deep neural networks. It computes individual learning rates for different parameters. Gradient descent is usually used in earlier CNN but as it is slow, Adam optimizer is nowadays apt choice for optimizing the variables. After training, our trained model gets ready for use and is saved for future classification. Table II shows the accuracy of the model for healthy eyes. The table includes an input image, output image corresponding to the input image along with the label of class and the accuracy. Table III shows the CNN based classified results for red eye images. The table includes the entries for input image. An output for the input image is shown along with accuracy percentage and the label of the class. The compiled results of table 2 and table 3 are presented in Fig. 4. The figure shows the average accuracy of predicting healthy and red eyes. The chart shows an average accuracy of 97.695 for healthy eyes and 93.0085 for red eyes. Graph in Fig. 5 depicts the training loss and accuracy of healthy as well as red eyes for 25 epochs, which clearly shows the efficiency of the proposed model.
Table-II: CNN based classified results for healthy eyes
Input Output Accuracy
99.97
94.91
100
100
99.99
93.78
[image:4.595.98.240.502.637.2]International Journal of Innovative Technology and Exploring Engineering (IJITEE) ISSN: 2278-3075,Volume-8 Issue-12, October, 2019
74.87
100
100
99.94
99.99
100
99.96
100
100
99.93
90.58
99.99
Table-III: CNN based classified results for red eyes
Input Output Accuracy
93.74
99.92
99.96
99.81
88.74
98.05
99.71
99.92
58.39
99.98
78.27
77.24
81.85
100
99.95
99.32
99.98
[image:6.595.46.294.45.719.2]99.34
Fig. 4. Average accuracy of red and healthy eyes
Fig. 5. Training loss and accuracy on red and healthy eyes
V. CONCLUSION
The objective of this study was to develop an efficient, accurate model to classify between red and healthy eye. This was done to provide automatic first level screening using
partially bridging the gap arising out of skewed ophthalmologist ratio in India. In other words, it is proposed to develop a mobile app which can capture the image of the eye and send it to the model that can be deployed in the cloud. This can be very useful to rural people who have limited access to eye care facilities. This will provide first level screening and using telemedicine like services, initial treatment can be started. As discussed in the results section, the model is able to achieve 94% accuracy (average) in predicting the new image passed to it. It also shows high validation accuracy and low validation loss. This is an attempt to build artificial intelligence based pre-diagnostic tools that can aid in diagnostic and can help ophthalmologist and optometrist in reaching out to people living in remote areas. Future scope of this work will include grading the red eye with help of CNN. The region of interest can also be extracted and model can be trained on this extracted region rather than the whole eye for better accuracy of the model.
ACKNOWLEDGEMENTS
Thanks to vision center under School of Health Science, Ansal University, for providing test images, clinical information and advice.
REFERENCES
1. A. Lens, Ocular anatomy and physiology. Thorofare, NJ: Slack Incorporated, 2008.
2. G. Ousler, P. Gomes, D. Welch and M. Abelson, "Methodologies for the Study of Ocular Surface Disease", The Ocular Surface, vol. 3, no. 3, pp. 143-154, 2005. Available: 10.1016/s1542-0124(12)70196-9. 3. "Abelson M B, Lane K and Maffei C 2010 Code red: The key features
of hyperemia. Rev Ophthalmol, 17(4), 92-94", www.reviewofophthalmology.com, 2010.
4. "Eye care in India: A situation analysis. Mumbai: Sight Savers International, India; 2007. Family Health and Development Research Service Foundation, Hyderabad", 2007.
5. R. Derakhshani, S. Saripalle and P. Doynov, "Computational methods for objective assessment of conjunctival vascularity", in Engineering in Medicine and Biology Society (EMBC), 2012, pp. 1490-1493. 6. S. Wu, J. Hong, L. Tian, X. Cui, X. Sun and J. Xu, "Assessment of
Bulbar Redness with a Newly Developed Keratograph", Optometry and Vision Science, vol. 92, no. 8, pp. 892-899, 2015. Available: 10.1097/opx.0000000000000643.
7. L. S Brea, N. Barreira, A. Mosquera, H. Pena-Verdeal and E. Yebra-Pimentel, "Comparing machine learning techniques in a hyperemia grading framework", in Proceedings of the 8th International Conference on Agents and Artificial Intelligence, 2016, pp. 423-429. 8. P. Murphy, J. Lau, M. Sim and R. Woods, "How red is a white eye?
Clinical grading of normal conjunctival hyperaemia", Eye, vol. 21, no. 5, pp. 633-638, 2006. Available: 10.1038/sj.eye.6702295.
9. M. Schulze, D. Jones and T. Simpson, "The Development of Validated Bulbar Redness Grading Scales", Optometry and Vision Science, vol. 84, no. 10, pp. 976-983, 2007. Available: 10.1097/opx.0b013e318157ac9e.
10. P. Fieguth and T. Simpson, Invest Ophthalmol Vis Sci, vol. 43, no. 2, pp. 340–347, 2002. [Accessed 4 September 2019].
11. J. Wolffsohn and C. Purslow, "Clinical monitoring of ocular physiology using digital image analysis", Contact Lens and Anterior Eye, vol. 26, no. 1, pp. 27-35,
2003. Available:
10.1016/s1367-International Journal of Innovative Technology and Exploring Engineering (IJITEE) ISSN: 2278-3075,Volume-8 Issue-12, October, 2019
12. E. Papas, "Key factors in the subjective and objective assessment of conjunctival erythema", Invest Ophthalmol Vis Sci, vol. 41, no. 3, pp. 687–691, 2019. [Accessed 4 September 2019].
13. J. Cullen, P. Fieguth, S. Pounder and K. Whitear, "Analysis of corneal images for assessing contact lens trauma", in International Conference on Image Processing, 2000, pp. 176-179.
14. L. Sánchez-Brea, N. Barreira-Rodríguez, A. Mosquera-González, C. García-Resúa and E. Yebra-Pimentel, "Automatic selection of video frames for hyperemia grading", in International Conference on Computer Aided Systems Theory, 2015, pp. 479-486.
15. L. Sánchez, N. Barreira, H. Pena-Verdeal and E. Yebra-Pimentel, "A novel framework for hyperemia grading based on artificial neural networks", in International Work-Conference on Artificial Neural Networks, 2015, pp. 263-275.
16. V. Fausett, Laurene, Fundamentals of neural networks: architectures, algorithms, and applications. Englewood Cliffs: prentice-Hall, 1994. 17. D. Rumelhart, G. Hinton and R. Williams, "Learning representations
by back-propagating errors", Nature, vol. 323, no. 6088, pp. 533-536, 1986. Available: 10.1038/323533a0.
18. I. Galkin, B. Reinisch, G. Ososkov, E. Zaznobina and S. Neshyba, "Feedback neural networks for ARTIST ionogram processing", Radio Science, vol. 31, no. 5, pp. 1119-1128, 1996. Available: 10.1029/96rs01513.
19. C. Giles, G. Kuhn and R. Williams, "Dynamic recurrent neural networks: Theory and applications", IEEE Transactions on Neural Networks, vol. 5, no. 2, pp. 153-156, 1994. Available: 10.1109/tnn.1994.8753425.
20. A. Maren, C. Harston and R. Pap, Handbook of neural computing applications. Academic Press, 2014.
21. J. Schmidhuber, "Deep learning in neural networks: An overview", Neural Networks, vol. 61, pp. 85-117, 2015. Available: 10.1016/j.neunet.2014.09.003.
22. Y. LeCun, K. Kavukcuoglu and C. Farabet, "Convolutional networks and applications in vision", in Proceedings of 2010 IEEE International Symposium on Circuits and Systems, 2010, pp. 253-256. 23.
https://res.mdpi.com/entropy/entropy-19-00242/article_deploy/html/images/entropy-19-00242-g001.png 24. Y. LeCun and Y. Bengio, "Convolutional networks for images,
speech, and time series", The handbook of brain theory and neural networks, vol. 3361, no. 10, p. 1995, 1995.
25. V. Nair and G. Hinton, "Rectified linear units improve restricted boltzmann machines", in Proceedings of the 27th international conference on machine learning (ICML-10), 2010.
26. Y. Lecun, L. Bottou, Y. Bengio and P. Haffner, "Gradient-based learning applied to document recognition", Proceedings of the IEEE, vol. 86, no. 11, pp. 2278-2324, 1998. Available: 10.1109/5.726791. 27. D. Cireşan, U. Meier, J. Masci, L. Gambardella and J. Schmidhuber,
"High-Performance Neural Networks for Visual Object Classification", arXiv.org, 2019. [Online]. Available: https://arxiv.org/abs/1102.0183.
28. D. Cireşan, U. Meier and J. Schmidhuber, "Multi-column deep neural networks for image classification", Arxiv.org, 2012.
29. P. Simard, D. Steinkraus and J. Platt, "Best practices for convolutional neural networks applied to visual document analysis", Icdar, vol. 3, no. 2003, 2003.
30. D. Kingma and J. Ba, "Adam: A Method for Stochastic Optimization", arXiv.org, 2019. [Online]. Available: https://arxiv.org/abs/1412.6980.
AUTHORSPROFILE
Sherry Verma is an assistant professor of SET at Ansal University. She holds a master of technology degree in computer science from department of computer science and applications, Kurukshetra University. Her research has been published in International Journal of Advanced Computer Science and Applications, International Journal of Research in Engineering and Applied Sciences, International Journal of Technical Innovation in Modern Engineering and Science. Her research area includes data mining, machine learning.
Latika Singh is a professor of SET at Ansal University. Dr Singh holds a doctoral degree in speech signal processing . She has published her research work in International Journal of Computers and Applications, Taylor & Francis, International Journal of Speech Technology, International Journal of Machine Learning and Cybernetics, International Journal of Advanced Computer Science & Applications, International Journal of Data Mining And Emerging Technologies .Her research area includes Speech development in children with special needs, feature reduction of large datasets, malware analysis using data mining etc. She is a member of Computer Society of India, Association for Computing Machinery. Dr Singh has been a State Merit Scholarship Holder and MSc gold medal.
![Fig. 1. Architecture of Convolutional Neural Network [23]](https://thumb-us.123doks.com/thumbv2/123dok_us/8171536.252090/2.595.308.519.426.504/fig-architecture-convolutional-neural-network.webp)