This is a repository copy of Laboratory analysis of the effects of elevated atmospheric carbon dioxide on respiration in biological soil crusts.
White Rose Research Online URL for this paper: http://eprints.whiterose.ac.uk/80310/
Version: Accepted Version
Article:
Lane, RW, Menon, M, McQuaid, JB et al. (4 more authors) (2013) Laboratory analysis of the effects of elevated atmospheric carbon dioxide on respiration in biological soil crusts. Journal of Arid Environments, 98. 52 - 59. ISSN 0140-1963
https://doi.org/10.1016/j.jaridenv.2013.07.014
eprints@whiterose.ac.uk https://eprints.whiterose.ac.uk/
Reuse
Unless indicated otherwise, fulltext items are protected by copyright with all rights reserved. The copyright exception in section 29 of the Copyright, Designs and Patents Act 1988 allows the making of a single copy solely for the purpose of non-commercial research or private study within the limits of fair dealing. The publisher or other rights-holder may allow further reproduction and re-use of this version - refer to the White Rose Research Online record for this item. Where records identify the publisher as the copyright holder, users can verify any specific terms of use on the publisher’s website.
Takedown
If you consider content in White Rose Research Online to be in breach of UK law, please notify us by
1 2 3 4 5 6 7 8 9 10 11 12 13 14 15 16 17 18 19 20 21 22 23 24 25 26 27 28 29 30 31 32 33 34 35 36 37 38 39 40 41 42 43 44 45 46 47 48 49 50 51 52 53 54 55 56 57 58 59 60
Laboratory Analysis of Elevated Atmospheric Carbon Dioxide on Carbon Fluxes for
Cyanobacterial Biological Soil Crusts
Richard W Lane1*, Manoj Menon1*, James B McQuaid§1, David G Adams2, Andrew
D Thomas3*, Steve R Hoon3 and Andrew J Dougill1
1
School of Earth and Environment, University of Leeds, Leeds, LS2 9JT, UK
2
Institute of Integrative and Comparative Biology, Faculty of Biological Sciences,
University of Leeds, Leeds, LS2 9JT, UK
3
School of Science and the Environment, Manchester Metropolitan University,
Manchester, M1 5GD, UK
§
Corresponding author; Address: 1School of Earth and Environment (Dr. Jim
McQuaid), University of Leeds, Leeds, LS2 9JT, UK; Email:
J.B.McQuaid@leeds.ac.uk
Phone: +44 (0) 113 343 6724; Fax: +44 (0) 113 343 5259
*Current address
Manoj Menon: Kroto Research Institute, Department of Civil and Structural
Engineering, University of Sheffield (North Campus), Sheffield, S37HQ, UK;
Andrew D Thomas: Institute of Geography and Earth Sciences, Aberystwyth
University, Penglais Campus, Aberystwyth, SY23 3DB, UK
Keywords: biological soil crust, cyanobacteria, photosynthesis, respiration, drylands, Kalahari, soil carbon sequestration, heterotrophic, autotrophic, CO2 flux double CO2,
Revised_Manuscript(JAE13-237)
1 2 3 4 5 6 7 8 9 10 11 12 13 14 15 16 17 18 19 20 21 22 23 24 25 26 27 28 29 30 31 32 33 34 35 36 37 38 39 40 41 42 43 44 45 46 47 48 49 50 51 52 53 54 55 56 57 58 59 60 61
Abstract
Metabolic activity of Biological Soil Crusts (BSCs) is principally dependent on
moisture availability, but also on temperature and light conditions. Less understood is
how BSCs respond to elevated atmospheric CO2. This paper reports laboratory
experimental results of elevated atmospheric CO2 on carbon fluxes for cyanobacterial
BSCs. The study uses newly designed dynamic gas exchange chambers in which the
internal atmosphere was controlled. CO2 flux was monitored during controlled
experiments in two phases under simulated rainfall events (2 & 5 mm plus control
with no wetting) each lasting 3 days with a dry period in between. Phase 1 subjected
crusts to 392 ppm CO2 (representing ambient level) in dry air; in phase 2, the CO2
concentration was 801 ppm. Both phases exhibited significant efflux (respiration) of
CO2 immediately after wetting, followed by substantial influx (sequestration) of CO2.
Samples subject to 2 mm wetting sequestered an order of magnitude more C under
elevated CO2 than at ambient CO2; for samples subject to 5 mm wetting, this increase
was threefold. The findings highlight the role of BSCs in future carbon budgets by
enabling greater sequestration into dryland soils even under enhanced atmospheric
1 2 3 4 5 6 7 8 9 10 11 12 13 14 15 16 17 18 19 20 21 22 23 24 25 26 27 28 29 30 31 32 33 34 35 36 37 38 39 40 41 42 43 44 45 46 47 48 49 50 51 52 53 54 55 56 57 58 59 60 1. Introduction
Dryland soils cover approximately 41% of the Earth’s terrestrial surface and support
more than one-third of the global population (Reynolds et al., 2007). Recent findings
suggest that sub-Saharan Africa has acted as a likely net carbon sink within the last
decade (Ciais et al., 2009) with a net balance of approximately 0.97 Pg C y-1 uptake
(Bombelli et al., 2009). However, the role of soils and their Biological Soil Crust
(BSC) cover remains only sparsely assessed (see reviews by Maestre et al., 2012 a,b;
Stringer et al., 2012) but with BSCs identified as a major contributor to overall CO2
efflux in drylands (e.g. Castillo-Monroy et al., 2011).
BSCs are made of cyanobacteria and other bacterial species, algae, lichens,
mosses and microfungi. In general, BSCs cover up to 70 % (Belnap and Lange, 2003)
of the soil surface of many drylands and in some undisturbed areas such as in Wildlife
Management Areas of the Kalahari BSCs cover more than 90% of the soil surface
(Dougill and Thomas, 2004). Globally, cyanobacterial biomass in dryland areas is
estimated to be 56 Pg of carbon (Garcia-Pichel et al., 2003), therefore constituting a
significant part of the estimated 241 Pg of soil organic carbon (SOC) contained within
drylands (Lal, 2004). The estimated total global Carbon net uptake of BSCs has been
approximated as 3.9 Pg yr-1 (corresponding to approximately 7% of global net
primary production uptake) (Elbert et al., 2012) but the controls on rates of CO2 efflex
remain poorly understood (Frey et al., 2013).
Substantial amounts of carbon are also being lost from BSCs via respiration
(Huxman et al., 2004; Thomas et al., 2008; Thomas and Hoon, 2010; Thomas et al.,
2011) particularly after rainfall events; due to activity and substrate availability
increases within microbial populations (Borken and Matzner, 2009). During hours
1 2 3 4 5 6 7 8 9 10 11 12 13 14 15 16 17 18 19 20 21 22 23 24 25 26 27 28 29 30 31 32 33 34 35 36 37 38 39 40 41 42 43 44 45 46 47 48 49 50 51 52 53 54 55 56 57 58 59 60 61
(photosynthesis) occurs; prior to these optimum conditions (particularly in the
absence of light) an initial efflux is observed (Evans and Johansen, 1999; Thomas et
al., 2011; Thomas, 2012).
Free Air Carbon Enrichment (FACE) facilities have been set up in several
dryland study sites to investigate the effects of increasing atmospheric CO2 on
vascular vegetation and soils (e.g. de Soyza et al., 2005; Steven et al., 2012). For
example, ten years of FACE field studies in Nevada suggest that enhanced CO2
treatments cyanobacteria will show a generalized decline with elevated CO2 though
the direct impacts on CO2 efflux rates remains unknown (Steven et al., 2012). . A
similar experiment in the Mojave desert conveys the importance of BSCs in the
uptake of CO2; whereby in post rain conditions the net ecosystem CO2 exchange
(uptake) was unexpectedly high and was likely due to autotrophic mechanisms as
vascular plant photosynthesis was low at this time (Jasoni et al., 2005).
The aim of this experimental study was to quantify the short-term temporal
changes in carbon exchange (respiration and photosynthesis) of BSCs when the
atmospheric concentration of CO2 was doubled (~800 ppm). The study was conducted
using specially designed dynamic gas exchange chambers (DGECs) and
cyanobacteria-dominated BSCs sampled from Kalahari Sand soils of southern Africa,
a large dryland biome which covers 2.5 million hectares (Wang et al., 2007). In
addition to the doubled CO2 atmospheric level in laboratory studies, two wetting
treatments (2 and 5 mm) were incorporated. This also added an extra dimension and
additional data on BSCs responses to key conditions of both soil moisture and
atmospheric CO2 concentration.
1 2 3 4 5 6 7 8 9 10 11 12 13 14 15 16 17 18 19 20 21 22 23 24 25 26 27 28 29 30 31 32 33 34 35 36 37 38 39 40 41 42 43 44 45 46 47 48 49 50 51 52 53 54 55 56 57 58 59 60
2.1Culturing BSCs in Controlled Conditions
Both crusts and subsoil samples were collected from a lightly grazed
commercially-owned farm near Tsabong, Botswana (25°56’51”S 22°25’40”E) during a field
campaign in summer 2008. The subsoil (97% fine sand, pH 5.9 ± 0.4, bulk density
1.85 ± 0.03 g cm3 and porosity 0.34 ± 0.01 v/v) (Thomas and Hoon, 2010) was sieved
(853 m), sterilized (autoclaved at 121 °C for 15 min) and then filled (178 g each) in
nine polyethylene terephthalate (PET) containers (diameter = 93 mm and depth = 25
mm). Soil depth was approximately 20 mm, a depth such that a 5 mm wetting would
result in near saturation. On the soil surface, biological soil crust samples were gently
broken into similarly sized pieces and distributed evenly and equally (3.32 g per
container) in all PET containers. Samples were weighed again and then wetted using
10 ml of pure water (purity > 99%) applied using a calibrated water sprayer. This
initial wetting consolidated the soil and the samples were left in an environmental
cabinet (the conditions of which are outlined below) to settle into a circadian rhythm.
The samples were allowed to establish for two months in a growth cabinet and the
crust surfaces were gently moistened several times a week (1-5 mm each), a total of
53.2 mm (361 ml) of water per container. Included in several of these treatments was
the addition of standard nutrient medium, BG11 (Rippka et al., 1979), which was
diluted with water, to encourage growth of the cyanobacteria.
The growth cabinet was set to provide 16 hours of light (intensity = 76 ± 1
µmol m-2 s-1, measured as an average at the central position of each cabinet shelf) and
a temperature of 28 ± 0.3 °C; the remaining 8 hours with no light at a temperature of
10 ± 0.3 °C. The light intensity in the cabinet represented early morning hours during
austral winter in the Kalahari where maximum microbial activity occurs (Evans and
1 2 3 4 5 6 7 8 9 10 11 12 13 14 15 16 17 18 19 20 21 22 23 24 25 26 27 28 29 30 31 32 33 34 35 36 37 38 39 40 41 42 43 44 45 46 47 48 49 50 51 52 53 54 55 56 57 58 59 60 61
Measurement Computing Corporation) were placed in various positions within the
cabinet, in order to record internal temperature, which ranged from 7.5-30.5°C in
phase 1 and 7.5-29.0°C in phase 2. Relative humidity was not recorded because the
sensors were located within the environmental cabinet and not in the enclosed and
therefore isolated (to external relative humidity) design of the DGECs.
2.2Dynamic Gas Exchange Chambers (DGECs)
The design of the chambers used was developed from that proposed and used
successfully in field conditions by Hoon et al. (2009). Chambers were designed to
house the PET containers containing crust samples. Chambers were made using
transparent Perspex® material (3 mm thickness) with a height of 103 mm and 100
mm outer diameter, allowing 92% transmission of PAR (400 nm-700 nm),
transmission of thermal infrared (IR) and filtered ultraviolet radiation (UV) < 300 nm;
the top of the chamber was fitted with a removable cap made of Teflon® film that
allowed 96% transmission of incoming radiation (Figure 1). The Teflon® film was
able to accommodate pressure changes within the chambers by acting as a diaphragm.
Each chamber was made air-tight and had ports (Suba-Seals®) from which samples
were collected at regular intervals. Chambers were attached (via the gas inlets) to the
main vessel of 32 l volume, containing the CO2-air mix. Open-cell foam inserts were
placed into the gas inlets and outlets in order to prevent diffusion of atmospheric
gases into or out of the chamber, while permitting the flushing of the chamber and
equilibration with the external atmospheric pressure, should it become over
pressurized. A Teflon® bag was attached to the end of the flush-gas feed line in order
to confirm flow of the flush gas. Final checks were made for any leaks. After this,
1 2 3 4 5 6 7 8 9 10 11 12 13 14 15 16 17 18 19 20 21 22 23 24 25 26 27 28 29 30 31 32 33 34 35 36 37 38 39 40 41 42 43 44 45 46 47 48 49 50 51 52 53 54 55 56 57 58 59 60
inside the growth cabinet. Care was taken to minimize the disturbance to the crust
samples. The final set up is given in Figure 2.
2.3Treatments and Sampling Regime
Experiments were conducted in two phases (3 days each, as during the preliminary
run, mentioned below, the behavior had stabilized by the end of day three) to study
the impacts of elevated CO2 along with different wetting treatments. Phase 1 was
carried out under ambient CO2 level (392 ppm in air, with a standard deviation of 4.4
ppm, blended in-laboratory from pure dry air and 1003 ppm CO2-air mix blended by
Air Liquide) with three single wetting treatments (0, 2 and 5 mm) with three
replicates. After phase 1, covers were removed and water added to the 0 and 2 mm
treatments (5 and 3 mm water, respectively) in order to equalize the moisture content
with the 5 mm wetting treatments. Covers were left off and the crusts allowed to dry
out again. They reached the initial moisture content 4-5 days after this and were then
moistened once a week before commencement of phase 2 (phase 2 was undertaken
three months after phase 1). Phase two was undertaken using the same method as
phase 1, on the same crust samples, this time with elevated CO2 (801 ppm in air,
blended by Air Liquide).
Approximately 12 hours prior to experiments, the CO2-air mix was used to
flush the chambers. This was in order to allow diffusion through the air spaces in the
soil, such that the concentration gradient between subsoil and atmosphere was
reduced and to acclimatize the crust to the new environment. The first gas sample was
taken (0815 GMT) the following morning, two hours before lights on (1015 GMT).
Samples were then weighed and the Teflon® lids opened for wetting (simulating a
1 2 3 4 5 6 7 8 9 10 11 12 13 14 15 16 17 18 19 20 21 22 23 24 25 26 27 28 29 30 31 32 33 34 35 36 37 38 39 40 41 42 43 44 45 46 47 48 49 50 51 52 53 54 55 56 57 58 59 60 61
The chambers were immediately weighed and closed; then placed back into the
growth cabinet and re-attached to the gas line. All chambers were again flushed with
the CO2-air mix. Chambers were then left for approximately 40 min before gas
samples were taken, followed by flushing; with the exception of the last flush of each
day which was left overnight and the gas sample taken immediately the following
morning. Each flushing was 12 min (this was determined during initial DGEC design
testing in the laboratory). Chamber venting time was close to optimum (40 min),
which has been determined by a sensitivity analysis of static gas chambers on soils
(Ohlsson et al., 2005), in which it was concluded that it is possible to reduce the
uncertainty in the CO2 flux value by allowing extended CO2 accumulation/reduction
times. Nine gas samples (10 ml each) were collected per chamber at regular intervals
during the day (0815-1715 GMT with at least two samples taken before lights on) for
three days and a total of 243 samples were collected from each phase of this
experiment. A preliminary run (with 410 ppm CO2-air mix) was carried out prior to
the experiment reported here to check the system.
Sample weights were taken only at the beginning and end of each phase in
order to quantify moisture loss. Moisture loss during the experiment was found to be
negligible in the DGECs, due to the chambers being closed.
2.4Analysis of CO2 Using Gas Chromatography with Helium Ionization
Detection
Temporal changes in CO2 concentration within the DGECs reflect the activity
(photosynthesis and respiration) of biological soil crusts. To measure the changes in
CO2 levels, 2.5 µl gas samples were taken at approximately 40 minute intervals
1 2 3 4 5 6 7 8 9 10 11 12 13 14 15 16 17 18 19 20 21 22 23 24 25 26 27 28 29 30 31 32 33 34 35 36 37 38 39 40 41 42 43 44 45 46 47 48 49 50 51 52 53 54 55 56 57 58 59 60
(PLOT) column (PoraPLOT Q, 25 m x 0.53 mm, 20 µm i.d. Chrompack,
Netherlands). A helium ionization detector (VICI, Houston, USA) was used to
quantify the eluate. The dimensionless integrals of the CO2 peaks were converted to
ppm and then to carbon flux in mg C m-2 hr-1 using Equation 1;
C Flux Rate = {([CO2]diff × n) / (A × t)} × Vs × MC × 3,600 mg C m-2 hr-1 (1)
where [CO2]diff = difference between measured CO2 concentration and flush CO2
concentration in ppm; n = number of moles of gas present in loop at temperature T
(˚C);
A = surface area of soil sample (6.793×10⁻³ m2); t = time between end of last flush and
taking of gas sample (s); Vs = volumetric scaling factor = 222,072; MC = molar mass
of carbon (12.0107 g mol-1) and 3,600 is used to represent flux over one hour.
Net carbon balances were based on the area under each carbon flux time series and
were calculated separately for each chamber for each day using the integral function
in EasyPlot™ software. In order to characterize significance of treatments (two levels
of CO2 and three levels of wetting), analysis of variance (ANOVA) was undertaken
using statistical package SYSTAT 13 which determines the p-value for CO2, wetting
and also whether or not these values are statistically significant.
3. Results
1 2 3 4 5 6 7 8 9 10 11 12 13 14 15 16 17 18 19 20 21 22 23 24 25 26 27 28 29 30 31 32 33 34 35 36 37 38 39 40 41 42 43 44 45 46 47 48 49 50 51 52 53 54 55 56 57 58 59 60 61
Temporal changes in CO2 concentrations in the chambers were measured to
understand the short-term responses to elevated CO2 levels along with pulse wetting
events. The positive values of flux in Figures 3 – 5 indicate net respiration and
negative values indicate net photosynthesis. Net carbon balances for each individual
chamber, on each day of both phases can be seen in Tables 1 & 2.
Figures 3a and 3b show temporal changes in the fluxes in the dry chambers
(controls) for phase 1 (392 ppm CO2) and phase 2 (801 ppm CO2), respectively. The
activity of the crust was very low due to there being no liquid moisture available. For
phase 1, the carbon loss (net respiration) dominated over the gain of carbon (net
photosynthesis) whereas for phase 2, the opposite was found. Tables 1 & 2 show that,
interestingly, many of the replicates exhibited appreciable carbon fixation even when
no liquid moisture was available (with the exception of air moisture). However, the
net carbon budgets over three days showed that, 0.02 ± 0.01 mg C was lost in phase 1
and 0.39 ± 0.04 mg C was sequestered for phase 2.
3.2Carbon fluxes under 2 mm wetting treatment
Figures 4a & 4b display the carbon release during the first day from the samples soon
after the wetting treatment for both phases. The samples continued respiration for the
majority of the first day and settled into a photosynthetic regime by the end of the day.
The second and third days show the samples to be predominantly photosynthetic in
activity. This photosynthetic activity peaked toward the end of each day. The quantity
of liquid moisture available for the samples for each of the three days, remained
largely unchanged. Tables 1 & 2 show the net carbon balances (in mg) of all
chambers for each day of each phase. After a 2 mm wetting treatment and subject to
1 2 3 4 5 6 7 8 9 10 11 12 13 14 15 16 17 18 19 20 21 22 23 24 25 26 27 28 29 30 31 32 33 34 35 36 37 38 39 40 41 42 43 44 45 46 47 48 49 50 51 52 53 54 55 56 57 58 59 60
phase 2 this was 1.3 ± 0.5 mg C. All cell group averages displayed net sequestration
for both phases under 2 mm wetting, with phase 2 showing the highest quantity of
carbon sequestered.
3.3Carbon fluxes under 5 mm wetting treatment
When the 5 mm wetting treatment was applied the wetting front reached the bottom of
each container, therefore saturating the soil. Moisture remained available for the
samples for each of the three days, and the quantity remained largely unchanged.
Figures 5a & 5b display the carbon fluxes of the chambers subject to a 5 mm wetting
treatment for each phase. It can be seen that throughout each experiment, a pulse of
carbon was released at the beginning of each day, particularly during phase 1,
indicating respiration. The samples exhibited very similar behavior to those subject to
2 mm wetting; the main difference being a moderate carbon pulse at the beginning of
each day and overall larger fluxes. For phase 2, the carbon losses were found to be
similar to phase 1; however the peak influx (sequestration) was 2-3 times larger than
phase 1. Tables 1 & 2 show the net carbon balances (in mg) of all chambers for each
day of each phase. After a 5 mm wetting treatment and subject to the conditions of
phase 1, 0.62 ± 0.05 mg C was sequestered and during phase 2, 2 ± 0.2 mg C was
sequestered. Phase 2 showed the highest quantity of carbon sequestered.
ANOVA significance testing of daily carbon sequestration (i.e. all negative
values from Tables 1 & 2) was undertaken. Tables 1 & 2 show the highly significant
effects of CO2 (P value = 0.005) and wetting (P value = 0.001), however the
1 2 3 4 5 6 7 8 9 10 11 12 13 14 15 16 17 18 19 20 21 22 23 24 25 26 27 28 29 30 31 32 33 34 35 36 37 38 39 40 41 42 43 44 45 46 47 48 49 50 51 52 53 54 55 56 57 58 59 60 61 4. Discussion
All carbon balances, with the exception of the dry samples at 392 ppm CO2, were
negative. This suggests that the overall, the dominant process was photosynthesis.
This shows that isolation of the autotrophs has been achieved, although it should be
noted that BSCs colonies are an amalgamation of heterotrophs and autotrophs, and as
such there is potential for both photosynthesis and respiration to occur
simultaneously. This is further confirmed when considering the pulse CO2 efflux
effects observed in those samples subject to wetting treatments, although interestingly
initial pulses were lower under 801 ppm CO2 than under 392 ppm CO2 perhaps
suggesting that the CO2 concentrating mechanism (CCM) (Badger and Price, 1992)
activity was enhanced under the increased CO2 atmosphere. Respiration was observed
early each day in the samples subjected to wetting treatments due to the absence of
light (and in some cases lasted for a short duration after the lights were on); again
these effluxes were lower under higher ambient CO2 levels.
Overall, each of the wetting treatments yielded higher influx of carbon when
subject to an 801 ppm CO2-air mix than when subject to the 392 ppm CO2-air mix. Of
these the most significant were the samples subjected to a 2 mm wetting treatment;
carbon influx increased by an order of magnitude suggesting that photosynthetic
activity in the BSCs samples responded best to ‘light’ wetting treatments/events.
Increases in carbon influx of three fold were observed in those samples with a 5 mm
wetting treatment, still representing a significant relative increase in carbon influx
under increased atmospheric CO2. Samples which had no additional water added also
exhibited increased carbon influx under enhanced atmospheric CO2; this is very likely
1 2 3 4 5 6 7 8 9 10 11 12 13 14 15 16 17 18 19 20 21 22 23 24 25 26 27 28 29 30 31 32 33 34 35 36 37 38 39 40 41 42 43 44 45 46 47 48 49 50 51 52 53 54 55 56 57 58 59 60
‘night-time’ part of the cycle creating a source of liquid moisture for the BSCs,
facilitating photosynthesis.
The finding that the relative increase in carbon influx was highest in the 2 mm
wetting treatment is complementary to the field-based findings of Thomas et al.
(2008) whereby not only do the autotrophs respond best to ‘light’ wetting treatments,
but the light wetting also limits the depth of soil which receives moisture, hence
reducing the effect that subsoil heterotrophs have on the net carbon balance. Light
rainfall events are common across the Kalahari, particularly at the beginning of the
wet season and have an important effect upon the annual soil carbon balance (Thomas
et al., 2011). The results presented here are promising for the continuing role of BSCs
as a carbon store as atmospheric CO2 increases, provided rainfall patterns remain at
higher frequencies of light events as currently seen (Simelton et al., 2013) rather than
moving to more extreme intense rainfall events as predicted by some for dryland
Africa more widely (e.g. Twomlow et al., 2008)).
Although the mechanisms of increased carbon sequestration were not
investigated in this study, Badger and Price (1992) describe the CO2 concentrating
mechanisms of cyanobacteria, which are capable of concentrating CO2 up to
1000-fold. The cyanobacterial CO2 concentrating mechanism is possibly the most effective
of any photosynthetic organism (Badger and Price, 1992), and therefore it would be
hoped that this effect would be amplified if elevated levels of CO2 were made
available (up until saturation). Cyanobacterial species are among the earliest forms of
life, having evolved under, and been exposed to, the high CO2/low O2 atmosphere of
the early (~3,000 Ma) Earth (Bowes, 1991); therefore it could be postulated that
cyanobacterial photosynthetic activity is optimum when exposed to the conditions
1 2 3 4 5 6 7 8 9 10 11 12 13 14 15 16 17 18 19 20 21 22 23 24 25 26 27 28 29 30 31 32 33 34 35 36 37 38 39 40 41 42 43 44 45 46 47 48 49 50 51 52 53 54 55 56 57 58 59 60 61
photosynthetic activity and increasing CO2 levels may exist. The findings of this study
appear consistent with this hypothesis; however the exact mechanisms require further
investigation. Further evidence is the ability of CO2 concentrating mechanism to
modulate activity under the influence of environmental factors; cyanobacteria (and
other CO2 concentrating mechanisms) can acclimate to a wide range of CO2
concentrations (as also show in FACE studies of Steven et al., 2012).
This study demonstrated the carbon sequestration potential of BSCs under
elevated CO2 levels under two moisture regimes. The response was similar to many
crops (Cure and Acock, 1986) and dryland vegetation (Naumburg et al., 2003) under
elevated levels of CO2 in the atmosphere. BSCs have the potential to fix carbon under
limited soil moisture availability and nutrient poor soils (typical of drylands) and is
especially applicable to BSCs dominated by nitrogen fixing cyanobacteria. Therefore
undisturbed BSC-covered drylands could be enhanced carbon sinks, and play an
increasingly significant role in global carbon budgets in years to come. With this in
mind, protection of BSCs is of increasing importance, particularly considering land
use pressures on these areas (Dougill and Thomas, 2004), where implementation of
community-based ecosystem service schemes such as those described by Dougill et
al. (2012) could be greatly beneficial to dryland areas. More long-term flux
monitoring studies are required with varying environmental conditions, particularly
concerning BSCS responses to increased temperatures (e.g. Frey et al., 2013) and
incoming solar radiation with varying wetting treatments.
1 2 3 4 5 6 7 8 9 10 11 12 13 14 15 16 17 18 19 20 21 22 23 24 25 26 27 28 29 30 31 32 33 34 35 36 37 38 39 40 41 42 43 44 45 46 47 48 49 50 51 52 53 54 55 56 57 58 59 60
The author would like to extend much gratitude to Mr. Lance Penketh of the
University of Leeds during the course of incubation and experimentation using the
growth cabinets. The author is grateful for the funding provided by the Natural
Environment Research Council (NERC) Taught Postgraduate Fund, with which this
research work was carried out.
1 2 3 4 5 6 7 8 9 10 11 12 13 14 15 16 17 18 19 20 21 22 23 24 25 26 27 28 29 30 31 32 33 34 35 36 37 38 39 40 41 42 43 44 45 46 47 48 49 50 51 52 53 54 55 56 57 58 59 60 61
Badger, M., Price, G., 1992. CO2 concentrating mechanisms in cyanobacteria:
molecular components, their diversity and evolution. J. Exp. Botany. 54, 609-622.
Belnap, J., Kaltenecker, J., Rosentreter, R., Williams, J., Leonard, S., Eldridge, D., 2001. Introduction to Biological Soil Crusts. Biological Soil Crusts: Ecology and Management, Technical Reference. Denver: United States Department of the Interior, pp. 1-7.
Belnap, J., Lange, O., 2003. Preface. In: Belnap J & Lange OL ( Eds.), Biological Soil Crusts: Structure, Function, and Management. Berlin: Springer-Verlag, pp. V-IX.
Beymer, R., Klopatek, J., 1991. Potential contribution of carbon by microphytic crusts in pinyon-juniper woodlands. Arid Soil Research and Rehabilitation. 5, 187-198.
Bombelli, A., Henry, M., Castaldi, S., Adu-Bredu, S., Arneth, A., de Grandcourt, A., Grieco, E., Kutsch, W., Lehsten, V., Rasile, A., Reichstein, M., Tansey, K., Weber, U., Valentini, R., 2009. An outlook on the Sub-Saharan Africa carbon balance. Biogeosci. 6, 2193-2205.
Borken, W., Matzner, E., 2009. Reappraisal of drying and wetting effects on C and N mineralisation and fluxes in soils. Global Change Biol. 15, 808-824.
Bowes, G., 1991. Growth at elevated CO2: photosynthetic responses mediated through
Rubisco. Plant, Cell and Env. 14, 795-806.
Brostoff, W., Sharifi,. M., Rundel, P., 2001, Photosynthesis of cryptobiotic crusts in a seasonally inundated system of pans and dunes at Edwards Air Force Base, western Mojave Desert, California: Laboratory studies, Flora, 197, 143-151.
Büdel, B., Darienko, T., Deutschewitz, K., Dojani, S., Friedl, T., Kohr, K., Salisch, M., Reisser, W., Weber, B., 2009. Southern African biological soil crusts are ubiquitous and highly diverse in drylands, being restricted by rainfall frequency. Microb. Ecol. 57, 229-247.
Cable, J., Huxman, T., 2004. Precipitation pulse size effects on Sonoran Desert soil microbial crusts. Oecologia. 141, 317-324.
Castillo-Monroy A.P, Maestre F.T, Rey A., Soliveres S., García-Palacios P. (2011) Biological soil crust microsites are the main contributor to soil respiration in a semiarid ecosystem. Ecosystems, 14, 835-847.
Ciais, P., Piao, S.-L., Cadule, P., Friedlingstein, P., Chéduin, A., 2009. Variability and recent trends in the African terrestrial carbon balance. Biogeosci. 6, 1935-1948.
Cure, J., Acock, B., 1986. Crop Responses to Carbon Dioxide Doubling: A Literature Survey. Agric. and Forest Meteo. 38, 127-145.
1 2 3 4 5 6 7 8 9 10 11 12 13 14 15 16 17 18 19 20 21 22 23 24 25 26 27 28 29 30 31 32 33 34 35 36 37 38 39 40 41 42 43 44 45 46 47 48 49 50 51 52 53 54 55 56 57 58 59 60
Dougill, A.J., Stringer, L.C., Leventon, J., Riddell, M., Rueff, H., Spracklen,D., Butt, E., 2012. Lessons from community-based payment for ecosystem service schemes: from forests to rangelands. Phil. Trans. Royal Soc. Biol. Sci. 367, 3178-3190.
Dougill, A.J., Thomas, A.D., 2004. Kalahari Sand Soils: Spatial Heterogeneity, Biological Soil Crusts and Land Degradation. Land Deg. & Devel. 15, 233-242.
Elbert, W., Weber, B., Burrows, S., Steinkamp, J., Büdel, B., Andreae, M., Pöschl, U., 2012. Contribution of cryptogamic covers to the global cycles of carbon and nitrogen. Nat. Geosci. 5, 459-462.
Evans, R., Johansen, J., 1999. Microbiotic Crusts and Ecosystem Processes. Crit. Rev. Plant Sci. 18, 183-225.
Frey, S.D., Lee, J., Melillo, J.M., Six, J., 2013. The temperature response of soil microbial efficiency and its feedback to climate. Nature Climate Change. 3, 395-398.
Garcia-Pichel, F., Belnap, J., Neuer, S., Schanz, F., 2003. Estimates of global cyanobacterial biomass and its distribution. Algological Stud. 109, 213-227.
Hoon, S., Thomas, A.D., Linton, P., 2009. The Design and Development of a Closed Chamber for the in-situ Quantification of Dryland Soil Carbon Dioxide Fluxes. Geog. Res. 47, 71-82.
Huxman, T., Snyder, K., Tissue, D., Leffler, A., Ogle, K., Pockman, W., Sandquist, D., Potts, D., Scwinning, S., 2004. Precipitation pulses and carbon fluxes in semiarid and arid ecosystems. Oecologia. 141, 254-268.
Jasoni, R., Smith, S. Arnone III, J., 2005. Net ecosystem CO2 exchange in Mojave
Desert shrublands during the eigth year of exposure to elevated CO2. Global Change
Biol. 11, 749-756.
Jeffries, D., Link, S., Klopatek, J., 1993. CO2 fluxes of cryptogamic crusts. New
Phytol. 125, 163-173.
Kaplan, A., Reinhold, L., 1999. CO2 Concentrating Mechanisms in Photosynthetic
Microorganisms. Ann. Rev. Plant Phys. and Plant Mol. Biol. 50, 539-570.
Lal,R., 2004. Carbon Sequestration in Dryland Ecosystems. Env. Man. 33, 528-544.
Lange,O., 2003. Photosynthesis of Soil-Crust Biota as Dependent on Environmental Factors. In: Belnap,J. & Lange,O. ( Eds.), Biological Soil Crusts: Structure, Function, and Management. Berlin: Springer-Verlag, pp. 218-240.
Naumburg, E., Housman, D., Huxman, T., Charlet, T., Loik, M., Smith, S., 2003. Photosynthetic responses of Mojave Desert shrubs to Free Air CO2 Enrichment are
greatest during wet years. Glob. Change Biol. 9, 276-285.
1 2 3 4 5 6 7 8 9 10 11 12 13 14 15 16 17 18 19 20 21 22 23 24 25 26 27 28 29 30 31 32 33 34 35 36 37 38 39 40 41 42 43 44 45 46 47 48 49 50 51 52 53 54 55 56 57 58 59 60 61
Maestre, F.T. Quero, J.L. et al., Gotelli, N.J., Escudero, A., Ochoa, V., et al., 2012a. Plant Species Richness and Ecosystem Multifunctionality in Global Drylands. Science, 335, 214-218.
Maestre, F.T., Salguero-Gomez, R., Quero, J.L., 2012b. It is getting hotter in here: determining and projecting the impacts of global environmental change on drylands. Phil. Trans. R. Soc. B, 367, 3062-3075.
Reynolds, J., Smtih, D., Lambin, E., Turner II, B., Mortimore, M., Batterbury, S., Downing, T., Dowlatabadi, H., Fernández, R., Herrick, J., Huber-Sannwald, E., Jiang, H., Leemans, R., Lynam, T., Maestre, F., Ayarza, M., Walker, B., 2007. Global Desertification: Building a Science for Dryland Development. Science. 316, 847-851.
Rippka, R., Deruelles, J., Waterbury, J., Herdman, M., Stanier, R., 1979. Generic assignments, strain histories and properties of pure cultures of cyanobacteria. J. General Microbiol. 111, 1-61.
Simelton, E., Quinn, C.H., Batisani, N., Dougill, A.J., Dyer, J.C., Fraser, E.D.G., Mkwambisi, D.D. Sallu, S.M., Stringer, L.C. 2013. Is rainfall really changing?
Farmers’ perceptions, meteorological data and policy implications. Climate and
Development, 5(2), 123-138.
Steven, B., Gallego-Graves, L., Yeager, C., Belnap,J., Evans, R.D., Kuske, C., 2012. Dryland biological soil crust cyanobacteria show unexpected decreases in abundance under long-term elevated CO2. Environmental Microbiology, 14(12), 3247-3258.
Stringer, L.C., Dougill, A.J., Thomas, A.D., Spracklen, D.V., Chesterman, C., Ifejika-Speranza, C., Rueff, H., Riddell, M., Williams, M., Beedy, T., Abson, D.,
Klintenberg, P., Syampungani, S., Powell, P., Palmer, A.R., Seely, M., Mkwambisi, D.D., Falcao, M., Sitoe, A., Ross, S., Kopolo, G. 2012. Challenges and opportunities in linking carbon sequestration, dryland livelihoods and ecosystem service provision. Environmental Science and Policy, 19-20,121-135.
Thomas, A.D., 2012. Impact of grazing intensity on seasonal variations of soil organic carbon and soil CO2 efflux in two semi-arid grasslands in southern Botswana. Phil.
Trans. Royal Soc. Biol. Sci. 367, 3076-3086.
Thomas, A.D., Hoon, S., 2010. Carbon dioxide fluxes from biologically-crusted Kalahari Sands after simulated wetting. J. Arid Env. 74, 131-139.
Thomas, A.D., Hoon, S., Dougill, A.J., 2011. Soil respiration at five sites along the Kalahari Transect: Effects of temperature, precipitation pulses and biological soil crust cover. Geoderma. 167-168, 284-294.
Thomas, A.D., Hoon, S., Linton, P., 2008. Carbon dioxide fluxes from cyanobacteria crusted soils in the Kalahari. Appl. Soil Ecol. 39, 254-263.
1 2 3 4 5 6 7 8 9 10 11 12 13 14 15 16 17 18 19 20 21 22 23 24 25 26 27 28 29 30 31 32 33 34 35 36 37 38 39 40 41 42 43 44 45 46 47 48 49 50 51 52 53 54 55 56 57 58 59 60
due to climatic change in Africa – A new approach. Physics and Chemistry of the Earth, 33, 780–787.
1 2 3 4 5 6 7 8 9 10 11 12 13 14 15 16 17 18 19 20 21 22 23 24 25 26 27 28 29 30 31 32 33 34 35 36 37 38 39 40 41 42 43 44 45 46 47 48 49 50 51 52 53 54 55 56 57 58 59 60 61
FIGURE CAPTIONS
Figure 1. Photograph of the dynamic gas exchange chamber. A Teflon® film was
attached to the top of the chamber using strong adhesive tape, and the gas inlet/gas
outlet had open-cell foam inserts in order to allow pressure equilibration, but to
prevent gas diffusion. Gas inlets/outlets were attached using grommets which were
sealed using Instant Gasket. Gas samples were taken from the Suba-Seal® sampling
port (to the rear of the chamber in this image). A hole was drilled in the bottom of the
chamber in order that the samples could be inserted into the cell in a controlled
manner; during experiments this hole was sealed using high strength adhesive tape.
Figure 2. Layout of DGECs within controlled environment cabinet. The USB data
loggers (not shown) were placed at various points within the cabinet (one on top and
bottom shelf, two on middle shelf). A flow rate meter (not shown) was attached to the
1 2 3 4 5 6 7 8 9 10 11 12 13 14 15 16 17 18 19 20 21 22 23 24 25 26 27 28 29 30 31 32 33 34 35 36 37 38 39 40 41 42 43 44 45 46 47 48 49 50 51 52 53 54 55 56 57 58 59 60
Figure 3a & 3b. Gas sample data from phases 1 & 2, samples with no additional
liquid water, data presented as average values of three replicates for each treatment
with error bars representing standard error. Gas sample data from phases 1 (Figure
3a) & 2 (Figure 3b) (392 ppm & 801 ppm CO2, respectively, in air flush-gas),
measuring carbon fluxes in chambers subject to no additional liquid water. Night-time
(lights off) was 8 hours before 1 hour, between 17-25 hours and between 41-49 hours,
after wetting. The left y-axis (Y1) corresponds to the solid dots / line (carbon flux of
crust in chamber averaged over three chambers) and the right y-axis (Y2) corresponds
to the dashed curve (internal temperature of cabinet). The Y1=0 line represents the
point at which net carbon flux is zero. Y1=+ve net respiration, Y1=-ve net
photosynthesis. The point at which water was added to the crusts is given by the line
X=0.
Figure 4a & 4b. Gas sample data from phases 1 & 2, samples subject to 2 mm
wetting treatment, data presented as average values of three replicates for each
treatment with error bars representing standard error. Gas sample data from phases 1
(Figure 4a) & 2 (Figure 4b) (392 ppm & 801 ppm CO2, respectively, in air flush-gas),
measuring carbon fluxes in chambers subject to a 2 mm wetting treatment. Night-time
(lights off) was 8 hours before 1 hour, between 17-25 hours and between 41-49 hours,
after wetting. The left y-axis (Y1) corresponds to the solid dots / line (carbon flux of
crust in chamber – averaged over three chambers) and the right y-axis (Y2)
corresponds to the dashed curve (internal temperature of cabinet). The Y1=0 line
represents the point at which net carbon flux is zero. Y1=+ve net respiration, Y1=
-ve net photosynthesis. The point at which water was added to the crusts is gi-ven by
1 2 3 4 5 6 7 8 9 10 11 12 13 14 15 16 17 18 19 20 21 22 23 24 25 26 27 28 29 30 31 32 33 34 35 36 37 38 39 40 41 42 43 44 45 46 47 48 49 50 51 52 53 54 55 56 57 58 59 60 61
Figure 5a & 5b. Gas sample data from phases 1 & 2, samples subject to 5 mm
wetting treatment, data presented as average values of three replicates for each
treatment with error bars representing standard error. Gas sample data from phases
1 (Figure 5a) & 2 (Figure 5b) (392 ppm & 801 ppm CO2, respectively, in air
flush-gas), measuring carbon fluxes in chambers subject to a 5 mm wetting treatment.
Night-time (lights off) was 8 hours before 1 hour, between 17-25 hours and between
41-49 hours, after wetting. The left y-axis (Y1) corresponds to the solid dots / line
(carbon flux of crust in chamber – averaged over three chambers) and the right y-axis
(Y2) corresponds to the dashed curve (internal temperature of cabinet). The Y1=0 line
represents the point at which net carbon flux is zero. Y1=+ve net respiration, Y1=
-ve net photosynthesis. The point at which water was added to the crusts is given by
HIGHLIGHTS
Response to elevated atmospheric CO2 of cyanobacterial samples was
investigated
Three wetting treatments were applied under fixed temperature and light conditions
Newly designed dynamic gas exchange chambers were developed and used
Samples subjected to 2 mm wetting sequestrated 10 times more C when CO2
was doubled
Samples subjected to 5 mm wetting sequestrated 3 times more C when CO2
was doubled
Replacement_Figure1(COLOUR)
replacement_Figure1(MONOCHROME)
Figure2
Figure3a
Figure3b
Figure4a
Figure4b
Figure5a
Figure5b
TABLES
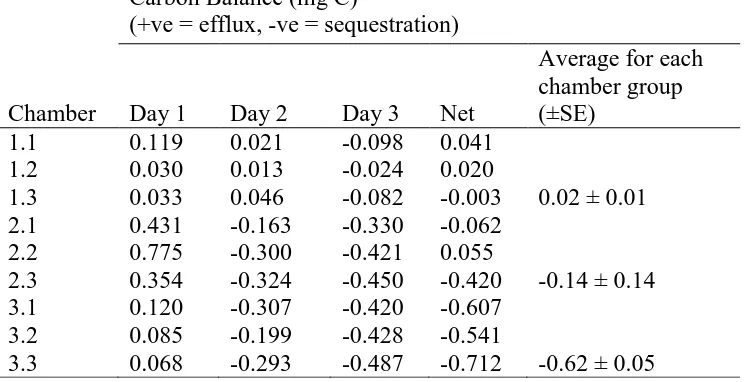
Table 1. Carbon balances for each chamber during Phase 1 (392 ppm CO2). Chambers 1.2-1.3
had no additional water, chambers 2.1-2.3 each had a 2 mm wetting treatment and chambers 3.1-3.3 each had a 5 mm wetting treatment.
Chamber
Carbon Balance (mg C)
(+ve = efflux, -ve = sequestration)
Day 1 Day 2 Day 3 Net
Average for each chamber group (±SE)
1.1 0.119 0.021 -0.098 0.041 1.2 0.030 0.013 -0.024 0.020
1.3 0.033 0.046 -0.082 -0.003 0.02 ± 0.01 2.1 0.431 -0.163 -0.330 -0.062
2.2 0.775 -0.300 -0.421 0.055
2.3 0.354 -0.324 -0.450 -0.420 -0.14 ± 0.14 3.1 0.120 -0.307 -0.420 -0.607
3.2 0.085 -0.199 -0.428 -0.541
[image:34.612.66.446.429.624.2]3.3 0.068 -0.293 -0.487 -0.712 -0.62 ± 0.05
Table 2. Carbon balances for each chamber during Phase 2 (801 ppm CO2). Chambers 1.2-1.3
had no additional water, chambers 2.1-2.3 each had a 2 mm wetting treatment and chambers 3.1-3.3 each had a 5 mm wetting treatment.
Chamber
Carbon Balance (mg C)
(+ve = efflux, -ve = sequestration)
Day 1 Day 2 Day 3 Net
Average for each chamber group (±SE)
1.1 -0.109 -0.096 -0.163 -0.369 1.2 -0.174 -0.190 -0.102 -0.466
1.3 -0.125 -0.114 -0.082 -0.321 -0.39 ± 0.04 2.1 0.045 -0.703 -0.880 -1.538
2.2 0.317 -1.067 -1.217 -1.966
2.3 0.304 -0.284 -0.468 -0.449 -1.3 ± 0.5 3.1 -0.145 -0.621 -0.845 -1.611
3.2 -0.076 -0.811 -1.115 -2.001
3.3 -0.215 -0.946 -1.194 -2.356 -2.0 ± 0.2