promoting access to White Rose research papers
White Rose Research Online [email protected]
Universities of Leeds, Sheffield and York
http://eprints.whiterose.ac.uk/
This is an author produced version of a paper published in Public Health Nutrition.
White Rose Research Online URL for this paper:
http://eprints.whiterose.ac.uk/74938/
Published paper:
Evans, CE, Ransley, JK, Christian, MS, Greenwood, DC, Thomas, JD and Cade, JE (2013) A cluster-randomised controlled trial of a school-based fruit and
vegetable intervention: Project Tomato. Public Health Nutrition, 16 (6). 1073 - 1081 .
ABSTRACT 1
2
Objective: This study aims to determine whether a multi-component school-based 3
intervention can maintain children’s fruit and vegetable intake post eligibility for free school 4
fruit and vegetables. 5
Design: A random sample of 54 English primary schools was randomised to receive the 10 6
month intervention Project Tomato, a multi-component theory based intervention or the 7
control. Each group consisted of 27 schools. 8
Setting: Children’s intake of fruit and vegetables is below recommendations. The English 9
School Fruit and Vegetable Scheme has a short term impact on intake while children are 10
eligible for the scheme. 11
Subjects: Dietary measurements were collected from 658 Year 2 pupils aged 7 to 8 years at 12
baseline and at follow-up 20 months later. 13
Results: Following an intention to treat analysis, the intervention as delivered compared to 14
the control had no impact on intake of fruit and vegetables (2g, 95% confidence interval -23 15
to 26g), or the number of portions of fruit (0.0 portions, 95% CI -0.3 to 0.3) or vegetables 16
(0.0 portions, 95% CI -0.2 to 0.3) consumed by children. Intake of fruit and vegetables at 17
school and home dropped by approximately 100g and 50g respectively between baseline and 18
follow up in both the intervention and control groups. 19
Conclusion: Implementation of the intervention was low, with associated lack of impact on 20
fruit and vegetable consumption in children. Alternatives to the delivery of an intervention by 21
teachers and parents are needed to improve dietary intake of primary aged children. 22
23
2 INTRODUCTION
25
A diet rich in fruit and vegetables may decrease the risk of developing chronic disease such 26
as cardiovascular disease, stroke, obesity and several forms of cancer in adult life.1-2 For 27
some cancer sites the risk of developing cancer doubles with adult diets in the lowest quartile 28
of intake of fruit and vegetables compared with the upper quartile of intake.3 Good dietary 29
habits developed in childhood may persist and lead to improved diet and health in 30
adulthood.4-5 31
32
The recommended intake of fruit and vegetables for adults and children in the UK and other 33
Western countries is 400g. This is equivalent to five 80g portions of fruit and vegetables.2 In 34
other countries recommendations are higher. In Australia the “Go for 2 & 5” campaign 35
recommends a daily intake of at least two pieces of fruit and five vegetables.6 Denmark 36
recommends 600g per day.7-8 Surveys indicate that children living in Western countries are 37
consuming considerably less than these recommendations.9-12 A UK survey reported 38
children’s intake to be 2.5 portions of fruit and vegetables per day. In the USA and Australia 39
consumption is 3.6 portions per day.10-11 The School Fruit and Vegetable Scheme (SFVS) 40
was launched in 2004 as part of the UK’s 5-A-Day strategy to improve children’s 41
consumption of fruit and vegetables.13 This scheme provides a free piece of fruit or vegetable 42
each school day to children from the age of four, for the first three years of school.14 The 43
scheme distributes approximately 440 million pieces of fruit and vegetables each year to over 44
two million children in 18,000 schools across England. 15 45
46
Studies evaluating the SFVS suggest it increases children’s fruit and vegetable intake in the 47
short-term, while children receive the free fruit or vegetable, but this falls when children are 48
no longer eligible for the scheme. There appears to be no long term impact of this scheme on 49
fruit and vegetable intake of children. 9, 16-17 50
51
A number of school based multi-component intervention trials to improve fruit and vegetable 52
intake in children have been carried out which include elements to improve the school 53
curriculum as well as providing home based projects18-25. The majority of these studies are 54
US based and also include components to improve the school environment. Two trials 55
reported in the literature are based in the UK; one in Dundee24 and one in Leeds25. The 56
former included improvements to the curriculum and communications with parents and 57
3 the curriculum and the school environment and reported little impact on fruit and vegetable 59
intake. 60
61
There is a need for a school based programme to maintain the increased intake of fruit 62
following children’s participation in the SFVS during the first three years of school. Project 63
Tomato is a flexible multi-component, theory based, intervention designed to do just this. 64
The intervention is designed for children in school years three and four (aged seven to nine 65
years) who no longer receive free fruit and vegetables at school. It contains components 66
which aim to both improve the school curriculum and to engage parents and children at home 67
using a variety of home based projects. 68
69
This is the first cluster randomised controlled trial in the UK to study the maintenance of fruit 70
and vegetable intake post SFVS in a large number of schools across England. 71
72
METHODS 73
74
Sampling method and study design 75
76
In 2006, a nationally representative sample of 130 primary schools across England formed a cross
77
sectional survey of children’s fruit and vegetable intake. Schools were randomly sampled from 78
the National Foundation of Educational Research (NFER) database of all schools. Schools 79
were excluded if they had fewer than 15 pupils per class, did not have pupils in years 2 to 4, 80
were independent or special schools or were schools that had previously participated in SFVS 81
projects. All schools were stratified on the following background criteria to ensure the 82
sample was representative of English schools: Local Education Authority (LEA) type (e.g. 83
rural /metropolitan); school type (e.g. infant, primary); key stage one academic attainment 84
(percentage of pupils achieving level two on Standard Assessment Tasks (SATs)); percentage 85
of pupils eligible for free school meals (FSME); percentage of pupils defined as having 86
special educational needs (SEN) and percentage of pupils with English as an additional 87
language (EAL). From the sample of 130 schools assessed at baseline, a sub-set of 54 schools
88
were selected using a random allocation sequence generated by a computerized random number
89
generator and recruited to the Project Tomato cluster randomised controlled trial.
90
4 Eligible schools were sent a letter, additional information and a consent form inviting them to 92
take part in the study. Parents received a letter with information about the study two weeks 93
prior to the data collection date. The letter contained a self-completed reply slip providing the 94
parents or guardians the opportunity for their child not to take part in the study (opt-out 95
consent). Parents who did not wish their child to participate completed the reply slip, which 96
was then returned to the school. Ethics approval was obtained through the University of 97
Leeds Central Research Ethics Committee. 98
Fifty-four schools with 1031 children age 7 to 8 years (Year 2) were randomised by school to 99
either the intervention or control group. Block randomisation within strata was used (blocks 100
of 2) stratifying on ethnicity (percentage of pupils non-white British) and deprivation 101
(percentage of pupils eligible for free school meals) both split at the median. Baseline data 102
was collected between February and March 2007, and follow up data was collected between 103
September and October 2008 when these children were in Year 4. 104
105
The intervention 106
107
The intervention, Project Tomato, was designed using a framework of health maintenance 108
behaviour which included the following components: familiarising children with fruit and 109
vegetables through activities such as gardening and cooking; repeated exposure to eating fruit 110
and vegetables through tasting sessions and school meals; engaging children in activities 111
relating to these foods through science experiments and growing; encouraging adult and peer 112
modelling of desirable behaviours such as eating fruit and ensuring the environment of the 113
school promotes the eating of fruit and vegetables.15, 26-27 This approach was summarised by 114
the acronym FRAME (Familiarisation, Repetition, Activities, Modelling and Environment). 115
The duration of the intervention was 10 months from July 2007 to April 2008. All schools 116
received core intervention materials and activities consisting of a manual, 12 lesson plans, 117
two newsletters, advice for parents, 3 home activity bags, and instructions for setting up a 118
committee. In addition schools received customised modules of materials and activities 119
depending on their baseline level of activity in a number of key areas relating to promoting 120
fruit and vegetable consumption such as a cooking club or gardening club. For example if a 121
school did not have a gardening club, the head teacher was asked if they would like 122
information to help them set up a club for year 2 children in their school. The intervention 123
participants: teachers; parents and children were asked to complete questionnaires on the 124
5 intervention. Baseline levels of school activity to promote fruit and vegetable consumption 126
was assessed by a questionnaire completed by a year three teacher. 127
128
The control schools received a ‘5-A-DAY’ booklet and healthy eating leaflets to distribute to 129
parents of Year two pupils.13 130
131
Dietary Assessment 132
133
Dietary intake was assessed using a validated 24 hour dietary assessment tool, the Child and 134
Diet Evaluation Tool (CADET) diary.28 The CADET diary comprises of a list of 105 135
separate food and drink types, divided into 15 categories. The categories of foods are cereal 136
(5 items); sandwich/bread/cake/biscuit (10 items); spreads/sauces/soup (7 items); cheese/egg 137
(6 items); chicken/turkey (3 items); meat other (9 items); fish (5 items); vegetarian (3 items); 138
pizza/pasta/rice (8 items); desserts/puddings (3 items); sweets/crisps (4 items); vegetables and 139
beans (18 items); potato (2 items); fruit (13 items); drinks (9 items). Each item in the diary 140
has seven tick boxes related to different meal time options “morning break, lunch time, 141
afternoon break, before tea (after school), evening meal/tea, after tea/during night, and 142
breakfast/before school.” The diary is completed by a parent or guardian at home and by 143
trained field workers at school, they are required to tick each item consumed by the child, 144
under the appropriate meal time heading, within the 24-hour period. For this analysis the 145
National Foundation for Education Research (NFER) field workers completed the CADET 146
diary during school hours. Parents were asked to record what their child ate in the evening 147
and before school the next day. 148
Statistical Analysis 149
150
Twenty schools were required with 500 children per group to have 90% power to detect a 0.5 151
portion difference in fruit or vegetable intake. Further details on the sampling methodology 152
are reported elsewhere. 15 153
Children who had no ticks in their diary for the home time periods were excluded from the 154
analysis. Children were also excluded if they had more than 40 ticks on their CADET diary 155
as this indicated that they were using the CADET diary incorrectly. 156
To assess the impact of the intervention on changes in children’s fruit and vegetable intake an 157
6 using MLwiN.29 This model takes into consideration the hierarchical structure of the data 159
caused by cluster randomisation; school level and child level.15 This type of analysis is 160
appropriate as children within the same school are likely to be more similar to each other than 161
to others in a different school in terms of fruit and vegetable intake. A random intercepts 162
model was used with fruit total weight of fruit and vegetable, weight of fruit only and weight 163
of vegetables only used as the main outcomes. Weights were also converted to portions. To 164
determine the intervention effects baseline levels, age were included in the model as 165
covariates (fixed effects), together with intervention status and gender as dummy variables 166
(fixed effects). Results for school and home separately are reported as medians with inter-167
quartile range due to the data not being normally distributed. Vitamin C and Vitamin A were 168
log transformed as they are not normally distributed based on previous research 10. 169
170
RESULTS
171 172
54 schools were randomised into the trial. Fifty schools (26 control and 24 intervention) 173
completed the trial. Trial materials were allocated to 1080 children and 1031 received the 174
materials: 14 children were opted out by their parents; 31 were absent on the baseline 175
collection day; 4 children had left the school before data collection. CADET diaries were 176
returned from 781 (76% of those receiving materials) children who completed it at both 177
baseline and follow up. Data from 658 children (64% of those receiving materials: 347 178
control and 311 intervention) was used in the analysis. Poor completion of CADET resulted 179
in 123 children being excluded from the analysis. Reasons for the loss of children randomised 180
to the trial include: absence on the day of the survey; a move from the school between 181
baseline and follow up; withdrawal of schools entering special measures (See Figures 1 and 182
2). 183
184
(INSERT FIGURES 1 AND 2 HERE) 185
186
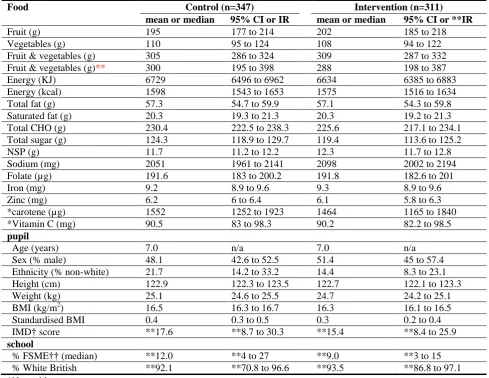
Table 1 shows baseline intake of fruit, vegetables and key nutrients in the control and the 187
intervention groups. Intake of food and key nutrients and energy are closely matched at 188
baseline across intervention and control groups. The combined fruit and vegetable intake is 189
similar in both groups (Control: 305g 95% CI 286 to 324 and Intervention: 309g 95%CI 287 190
to 332). Comparison of the characteristics of children in the control and intervention group at 191
7 and deprivation however there are slightly more children from different ethnic groups in the 193
control compared to the intervention group (21.7, 95% CI 14.2 to 33.2 and 14.4, 95% CI 8.3 194
to 23.1). Slightly more children were eligible for free school meals in the control group 195
compared to the intervention group. 196
(INSERT TABLE 1 HERE) 197
198
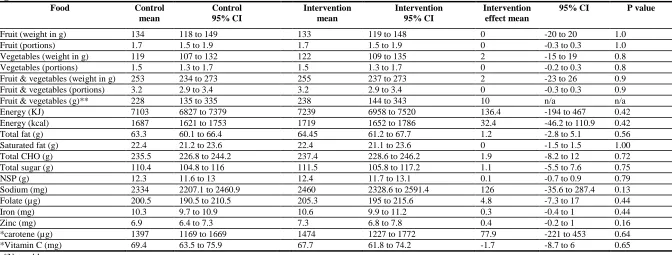
The Project Tomato was evaluated by comparing fruit and vegetable intake in children in the 199
intervention group compared with the control group at follow up. Both groups were similar 200
in terms of fruit and vegetable intake (mean difference 2g 95% CI -23 to 26). This difference 201
was not statistically significant. There was no effect of the intervention as delivered on 202
portions of fruit (0.0, 95% CI -0.3 to 0.3) or vegetables consumed (0.0 95% CI -0.2 to 0.3). 203
Fruit intake was slightly higher than vegetable intake in both groups. There were no 204
differences between the two groups of children in terms of intake of key nutrients (Table 2). 205
Intake of fruit and vegetables combined fell by approximately 50g between baseline and 206
follow up in both groups. 207
208
(INSERT TABLE 2 HERE) 209
210
Table 3 shows median intakes of fruit and vegetables at home and school, at baseline and 211
follow up. Home intake of fruit and vegetables combined fell by about 50g in both groups. 212
The drop in fruit and vegetable intake at school is even more pronounced between baseline 213
and follow up. Fruit and vegetable intake fell by approximately 100g in both groups. (Table 214
3). Half of this drop in school fruit and vegetable intake was due to children not receiving 215
free school fruit or vegetables and the remaining drop was due to reduction at lunch time and 216
break time. At baseline the mean weight of fruit and vegetables from the FSFV was 56g, 217
while at follow up it was 0g. 218
219
(INSERT TABLE 3 HERE) 220
221
All 24 schools which completed the intervention also completed the process measures 222
questionnaires and 261 of the 311 children who completed the trial also completed the 223
process measures evaluation. Implementation of the intervention was low overall, with 21% 224
8 materials to set up cooking and gardening clubs. Further details of the process evaluation are 226
presented elsewhere 30. 227
228
DISCUSSION 229
230
This is the first large, multi-component cluster randomised controlled trial designed to 231
improve fruit and vegetable intake involving primary schools across England. The 232
intervention was designed to prevent the fall in consumption of fruit and vegetables in year 233
three children, aged 8 to 9 years, when they are no longer eligible for free school fruit. 234
Despite an intensive programme of activities, the intervention, as delivered, failed to have an 235
impact on children’s fruit and vegetable intake post SFVS. The decreased intake of fruit and 236
vegetables in these children was particularly notable during the school day where it dropped 237
by half. At baseline, children were receiving free school fruit and were eating more fruit than 238
vegetables at school. When eligibility for free fruit ends, it coincides with a drop in fruit and 239
vegetable intake. This is particularly marked at school and was not offset by the intervention. 240
The availability of fruit during the school day, through schemes such as the SFVS, may be a 241
key determinant of fruit intake of children. It appears difficult to make up for this loss of fruit 242
provided either at school or home. 243
One reason for the lack of an intervention effect may be due to incomplete implementation. 244
Process measure questionnaires were taken throughout the intervention from teachers, parents 245
and children. The questionnaires measured implementation and appreciation of the 246
intervention materials. Implementation of the intervention was low with teachers 247
implementing only 21% of intervention materials even though they reported that they liked 248
the materials and activities that had been provided. Children implemented 56% of activities 249
provided in the take home activity kits. Parents implemented 35% of the activities related to 250
the intervention. Both child and parent appreciation of the intervention items was high30. The 251
intervention was designed to be pragmatic, not relying on external agencies to deliver the 252
activities, however, it appears that despite commitment from the schools and appreciation of 253
the materials there was limited implementation. 254
The intervention was based on psychological constructs shown to promote behaviour change. 255
Research in the field of health psychology suggests the process of initiating health behaviour, 256
such as eating more fruit, may be different from maintaining the behaviour. Each type of 257
9 intervention was designed to address this hypothesis by mapping key psychological
259
constructs involved with maintenance behaviour to intervention activities. 260
The intervention Project Tomato, involved components aimed at teachers, parents and 261
children over a period of 10 months. It is important to note this intervention was designed to 262
be delivered by school staff and no additional personnel were deployed. Project Tomato was 263
also designed to be sustainable and to enable the schools to continue its delivery beyond the 264
evaluation stage. Multi-component interventions in this age group have been reported from 265
the US and shown improvements in fruit and vegetable intake of a third of a portion or more. 266
A recent pooled analysis of 7 studies in the USA showed an increase of 0.45 portions of fruit 267
and vegetables consumed post intervention32. However, not all of these studies were 268
randomised controlled trials. The studies included in the analysis were more intensive, of 269
longer duration and included additional personnel to deliver the interventions.23, 33-34 An 270
Icelandic study showed a 46% increase in fruit and vegetable intake in primary school 271
children following a school based intervention. That study was, however, characterised by 272
low intake of fruit and vegetables at baseline together with baseline imbalance between the 273
intervention and control groups. 35 One recent intervention in the UK had some success in 274
increasing fruit and vegetables in packed lunches at schools.36 275
The age related decline in fruit and vegetables observed in this study is a cause for concern, 276
particularly as the intervention was designed to attenuate this. The impact of School Meal 277
Standards and the restriction on advertising of food high in fat, salt and sugar to children 278
which were introduced after this intervention may help to increase children’s intake of fruit 279
and vegetables. 37-38 The introduction of food-based standards for school meals in 2006 has 280
moderately improved the nutrient content of school meals, slightly widening the nutritional 281
gap between children consuming school meals compared to packed lunches.39 However, 282
packed lunches fall behind with only 19% of packed lunches containing vegetables and 54% 283
containing fruit for children in this age group.40 284
Powerful socio-cultural influences drive children’s eating behaviour towards a more 285
processed diet, low in fruit and vegetables with adolescents consuming less than younger 286
children, particularly boys10. This may be hard to offset without the continued availability of 287
free fruit during the school day. The combined fruit and vegetable intake of about 300g in 288
this study appears relatively high in comparison to other UK data. Findings of the National 289
Diet and Nutrition Survey found the median intake of fruit for children aged 4 to 10 years 290
10 of fruit and vegetables combined. The fall in fruit intake at school in year 3, shown in this 292
study may provide some evidence to support the continuation of the SFVS throughout 293
primary school. However more work is needed to confirm this. Some other studies have 294
reported similar small or no improvements in fruit and vegetable intake following an 295
intervention41-42 although others have been successful.43-44 296
297
Strengths of this study include the strong study design, the random sampling to include all 298
primary schools in England and the multi-level analysis using MLwiN which took into 299
account the clustering of children within schools. A validated dietary assessment tool was 300
used. 301
There were some limitations to this study. Four schools (approximately 120 pupils) were lost 302
following randomisation. Reasons for school withdrawal include the school entering special 303
measures or undergoing an inspection. This could have led to biased results if the schools that 304
withdrew were different from schools that remained in the trial. In addition, the children in 305
the intervention and control groups could have been unmatched in terms of social 306
deprivation. Although attempts were made to match schools, measures of deprivation at the 307
individual level were not included in the model. Parents were asked form their postcode to 308
determine IMD score for each child but a large number of families did not provide this data. 309
Therefore, including IMD in the analysis would have greatly reduced the number of children 310
included in the final model leading to bias if there were inherent differences between families 311
who provided this information and those who did not. 312
The dietary assessment tool could also be a limitation. The portion size of some of the 313
different fruits and vegetables may have been over-estimated using this method. Accurately 314
assessing diet remains a difficult problem and the issues with 24 hour-recalls such as CADET 315
is that participants may over-estimate intake compared with weighed diaries where 316
participants are more likely to under-estimate consumption. Although efforts were made to 317
exclude children who used the assessment tool as a food frequency questionnaire by ticking 318
all the fruits and vegetables that they ever ate, it is possible that some pupils were included 319
contributing to an over estimation of fruit and vegetables consumption. The estimated daily 320
amounts in this study are higher than for the NDNS where weighed diaries were used which 321
may be due to overestimation of this tool or underestimation of NDNS data. Moreover, the 322
diary was only completed for one day and fruit and vegetable consumption could vary 323
11 on the results of the trial as fruit and vegetable consumption would have been over-estimated 325
in both groups to the same degree. 326
This large randomised controlled trial provides a unique opportunity to explore whether a 327
multi-component school based intervention could increase children’s consumption of fruit 328
and vegetables. The results showed the intervention as delivered had no positive effect on 329
children’s intake of these foods. Rather there was a marked decline following the end of the 330
SFVS, particularly during the school day. However, the implementation of the intervention 331
by teachers, pupils and parents was low. This raises important issues regarding how long 332
national interventions such as the SFVS should be maintained in schools; what the effects of 333
withdrawing an interventions may be and the challenges facing the implementation of dietary 334
interventions during the busy school day. These findings suggest further work is required to 335
improve the delivery and implementation of school based interventions to improve fruit and 336
vegetables and to prevent the age related decline in fruit and vegetable intake. 337
338 339 340 341 342 343 344 345 346 347 348 349 350 351 352 353 354 355 356 357 358 359 360 361 362 363
What this paper adds
What is already known on this subject?
Children’s intake of fruit and vegetables is low and this may have serious adverse effects on health. As children progress through school there is an age related decline in fruit and vegetable intake. This is partly reduced by the School Fruit and Vegetable Scheme (SFVS).
What does this study add?
Following the end of the SFVS in year 3 there is a marked decline in intake of fruit and vegetables. The decline was particularly evident during the school day. A school based, multi-component intervention to prevent this decline had no impact on children’s intake of these foods. However,
12
References
364
[1] World Health Organization. Global strategy on diet, physical activity and health. 365
World Health Assemblyed, 2004. 366
[2] World Cancer Research Fund & the American Institute for Cancer Research. Food, 367
Nutrition and Physical Activity and the Prevention of Cancer: a Global Perpsective. 368
Washington DC: World Cancer Research Fund & the American Institute for Cancer 369
Researched, 2007. 370
[3] Block G, Patterson B, Sumar A. Fruit, vegetables, and cancer prevention: a review of 371
the epidemiological evidence. Nutrition and Cancer. 1992 18: 1-29. 372
[4] Maynard M, Gunnell D, Emmett P, Frankel S, Smith G. Fruit and vegetables and 373
antioxidants in childhood and risk of adult cancer: the Boyd Orr Cohort. Journal of 374
Epidemiology and Community Health. 2003 57: 218-25. 375
[5] Fisher J, Mitchell D, Smiciklas-Wright H, Birch L. Parental influences on young girls' 376
fruit and vegetable, micronutrient, and fat intakes. Journal of the American Dietetic 377
Association. 2002 102: 58-64. 378
[6] Horticulture Australia. Go for 2 & 5. ed. 379
[7] Eriksen K, Haraldsdottir J, Pederson R, Flyger HV. Effect of a fruit and vegetable 380
subscription in Danish schools. Public Health Nutrition. 2003 6: 57-63. 381
[8] Appleton KM, Rogers PJ, Blundell JE. Effects of a sweet and a nonsweet lunch on 382
short-term appetite: differences in female high and low consumers of sweet/low-energy 383
13 [9] Ransley J, Greenwood D, Cade J, Blenkinsop S, Schagen I, Teeman D, et al. Does the 385
school fruit and vegetable scheme improve children's diet? A non-randomised controlled 386
trial. J Epidemiol Community Health. 2007 61: 699-703. 387
[10] Gregory J, Lowe S, Bates C, Prentice A, Jackson L, Smithers G. National diet and 388
nutrition survey: young people aged 4 to 18 years. London: The Stationary Office, 2001. 389
[11] Magarey A, Daniels LA, Smith A. Fruit and vegetable intakes of Australians aged 2-390
18 years: an evaluation of the 1995 National Nutrition Survey data. Aust NZ J Pub Health. 391
2001 25 155-61. 392
[12] Krebs-Smith SM, Cook A, Subar AF, Cleveland L, Friday J, LL K. Fruit and 393
vegetable intakes of children and adolescents in the United States. Arch Pediatr Adolesc Med. 394
1996 150: 81-6. 395
[13] Department of Health. 5 A Day introduction. London: Department of Health, 2003. 396
[14] Department of Health. Information for schools: School Fruit and Vegetable Scheme. 397
London: The Department for Health, 2002. 398
[15] Kitchen MS, Ransley JK, Greenwood DC, Clarke GP, Conner MT, Jupp JE. Study 399
protocol: a cluster randomised controlled trial of a school based fruit and vegetable 400
intervention - Project Tomato. BMC Health Services Research. 2009 9. 401
[16] Wells L, & Nelson M, The National School Fruit Scheme produces short-term but not 402
longer-term increases in fruit consumption in primary school children. Br J Nutr. 2005 93: 403
14 [17] Fogarty AW, Antoniak M, Venn AJ, Davies L, Goodwin A, Salfield N, et al. Does 405
participation in a population-based dietary intervention scheme have a lasting impact on fruit 406
intake in young children? Int J Epidemiol. 2007 36: 1080-5. 407
[18] Baranowski T, Davis M, Resnicow K, Baranowski J, Doyle C, Lin LS, et al. Gimme 5 408
fruit, juice, and vegetables for fun and health: outcome evaluation. Health Educ Behav. 2000 409
27: 96-111. 410
[19] Gortmaker SL, Cheung LW, Peterson KE, Chomitz G, Cradle JH, Dart H, et al. 411
Impact of a school-based interdisciplinary intervention on diet and physical activity among 412
urban primary school children: eat well and keep moving. ArchPediatrAdolescMed. 1999 413
153: 975-83. 414
[20] Gortmaker SL, Peterson K, Wiecha J, Sobol AM, Dixit S, Fox MK, et al. Reducing 415
obesity via a school-based interdisciplinary intervention among youth: Planet Health. 416
ArchPediatrAdolescMed. 1999 153: 409-18. 417
[21] Bere E, Veierod MB, Bjelland M, Klepp KI. Outcome and process evaluation of a 418
Norwegian school-randomized fruit and vegetable intervention: Fruits and Vegetables Make 419
the Marks (FVMM). Health Educ Res. 2006 21: 258-67. 420
[22] Taylor RW, McAuley KA, Barbezat W, Strong A, Williams SM, Mann JI. APPLE
421
Project: 2-y findings of a community-based obesity prevention program in primary school 422
age children. Am J Clin Nutr. 2007 86: 735-42. 423
[23] Reynolds KD, Franklin FA, Binkley D, Raczynski JM, Harrington KF, Kirk KA, et 424
al. Increasing the fruit and vegetable consumption of fourth-graders: results from the high 5 425
15 [24] Anderson A, Porteous L, Foster E, Higgins C, Stead M, Hetherington M, et al. The 427
impact of a school-based nutrition education intervention on dietary intake and cognitive and 428
attitudinal variables relating to fruits and vegetables. Public Health Nutrition. 2005 8: 650-6. 429
[25] Sahota P, Rudolf MC, Dixey R, Hill AJ, Barth JH, Cade J. Randomised controlled 430
trial of primary school based intervention to reduce risk factors for obesity. BMJ. 2001 323: 431
1029-32. 432
[26] Knai C, Pomerleau J, Lock K, McKee M, Pomerleau J, Lock K, et al. Getting children 433
to eat more fruit and vegetables: a systematic review. Prev Med. 2006 42: 85-95. 434
[27] Conner M, Sparks P. The theory of planned behaviour and health behaviour. In: 435
Conner M, Norman P, eds. Predicting Health behaviour. Buckingham: Open University 436
Pressed, 2005:170-222. 437
[28] Cade JE, Frear L, Greenwood DC, Cade JE, Frear L, Greenwood DC. Assessment of 438
diet in young children with an emphasis on fruit and vegetable intake: using CADET (Child 439
and Diet Evaluation Tool). Public Health Nutrition. 2006 9: 501-8. 440
[29] Rasbash J, Steele F, Browne WJ, Prosser B. A User's guide to MLwiN, Version 2.0. 441
London: Institute of Education, 2004. 442
[30] Christian MS, Evans CE, Ransley JK, Greenwood DC, Thomas JD, Cade JE. Process 443
evaluation of a cluster randomised controlled trial of a school-based fruit and vegetable 444
intervention: Project Tomato. Public Health Nutr. 2011: 1-7. 445
[31] Armitage C, Conner M. Social cognition models and health behaviour: A structured 446
16 [32] Howerton MW, Bell BS, Dodd KW, Berrigan D, Stolzenberg-Solomon R, Nebeling 448
L. School-based nutrition programs produced a moderate increase in fruit and vegetable 449
consumption: meta and pooling analyses from 7 studies. J Nutr Educ Behav. 2007 39: 186-450
96. 451
[33] Perry CL, Bishop DB, Taylor G, Murray DM, Mays RW, Dudovitz BS. Changing 452
fruit and vegetable consumption among children: the 5-a-Day Power Plus program in St. 453
Paul, Minnesota. Am J Public Health 1998 88: 603-9. 454
[34] Cullen KW, Watson K, Baranowski T, Baranowski JH, Zakeri I, Cullen KW, et al. 455
Squire's Quest: intervention changes occurred at lunch and snack meals. Appetite. 2005 45: 456
148-51. 457
[35] Kristjansdottir A, Johannsson E, Thorsdottir I. Effects of a school based intervention 458
on adherence of 7-9 year olds to food based dietary guildelines and intake of nutrients. Public 459
Health Nutrition. 2010 13: 1151-61. 460
[36] Evans CE, Greenwood DC, Thomas JD, Cleghorn CL, Kitchen MS, Cade JE. 461
SMART lunch box intervention to improve the food and nutrient content of children's packed 462
lunches: UK wide cluster randomised controlled trial. J Epidemiol Community Health. 2010 463
64: 970-6. 464
[37] School Food Trust. School Food Standards. ed. 465
[38] Office of Communications. Update on impact of restrictions on food and drink 466
17 [39] Evans CE, Cleghorn CL, Greenwood DC, Cade JE. A comparison of British school 468
meals and packed lunches from 1990 to 2007: meta-analysis by lunch type. Br J Nutr. 2010 469
104: 474-87. 470
[40] Evans CE, Greenwood DC, Thomas JD, Cade JE. A cross-sectional survey of 471
children's packed lunches in the UK: food- and nutrient-based results. J Epidemiol 472
Community Health. 2010 64: 977-83. 473
[41] Bere E, Veierod MB, Klepp K-I. The Norwegian School Fruit Programme: evaluating 474
paid vs. no-cost subscriptions. Prev Med. 2005 41: 463-70. 475
[42] Te Velde SJ, Brug J, Wind M, Hildonen C, Bjelland M, Perez-Rodrigo C, et al. 476
Effects of a comprehensive fruit and vegetable promoting school based intervention in three 477
European countries: the Pro Children Study. British Journal of Nutrition. 2008 99: 893-903. 478
[43] Ciliska D, Miles E, O'Brien MA, Turl C, Tomasik HH, Donovan U. Effectiveness of 479
community-based interventions to increase fruit and vegetable consumption. Journal of 480
Nutrition Education and Behavior. 2000 32: 341-52. 481
[44] Auld G, C. O, Endinger E, Ambudgem M. Outcomes from a school-based nutrition 482
education program using resource teachers and cross-disciplinary models. . J Nutr Educ. 483
1998 30: 268-80. 484
485
486
18
Tables
[image:19.595.65.555.130.508.2]489
Table 1: Balance at baseline of foods, nutrients, pupil and school characteristics, for the 658 children with complete data at baseline and follow up
Food Control (n=347) Intervention (n=311)
mean or median 95% CI or IR mean or median 95% CI or **IR
Fruit (g) 195 177 to 214 202 185 to 218 Vegetables (g) 110 95 to 124 108 94 to 122 Fruit & vegetables (g) 305 286 to 324 309 287 to 332 Fruit & vegetables (g)** 300 195 to 398 288 198 to 387 Energy (KJ) 6729 6496 to 6962 6634 6385 to 6883 Energy (kcal) 1598 1543 to 1653 1575 1516 to 1634 Total fat (g) 57.3 54.7 to 59.9 57.1 54.3 to 59.8 Saturated fat (g) 20.3 19.3 to 21.3 20.3 19.2 to 21.3 Total CHO (g) 230.4 222.5 to 238.3 225.6 217.1 to 234.1 Total sugar (g) 124.3 118.9 to 129.7 119.4 113.6 to 125.2 NSP (g) 11.7 11.2 to 12.2 12.3 11.7 to 12.8 Sodium (mg) 2051 1961 to 2141 2098 2002 to 2194 Folate (µg) 191.6 183 to 200.2 191.8 182.6 to 201 Iron (mg) 9.2 8.9 to 9.6 9.3 8.9 to 9.6
Zinc (mg) 6.2 6 to 6.4 6.1 5.8 to 6.3
*carotene (µg) 1552 1252 to 1923 1464 1165 to 1840 *Vitamin C (mg) 90.5 83 to 98.3 90.2 82.2 to 98.5
pupil
Age (years) 7.0 n/a 7.0 n/a
Sex (% male) 48.1 42.6 to 52.5 51.4 45 to 57.4 Ethnicity (% non-white) 21.7 14.2 to 33.2 14.4 8.3 to 23.1 Height (cm) 122.9 122.3 to 123.5 122.7 122.1 to 123.3 Weight (kg) 25.1 24.6 to 25.5 24.7 24.2 to 25.1 BMI (kg/m2) 16.5 16.3 to 16.7 16.3 16.1 to 16.5 Standardised BMI 0.4 0.3 to 0.5 0.3 0.2 to 0.4 IMD† score **17.6 **8.7 to 30.3 **15.4 **8.4 to 25.9
school
% FSME†† (median) **12.0 **4 to 27 **9.0 **3 to 15 % White British **92.1 **70.8 to 96.6 **93.5 **86.8 to 97.1 *Natural log
**Median and interquartile range (IR) for single level model † IMD = index of multiple deprivation
19 Table 2: Follow up levels of foods and nutrients of the 658 children with trial data analysed; and intervention effects adjusted for age, gender and baseline results
Food Control mean
Control 95% CI
Intervention mean
Intervention 95% CI
Intervention effect mean
95% CI P value
Fruit (weight in g) 134 118 to 149 133 119 to 148 0 -20 to 20 1.0
Fruit (portions) 1.7 1.5 to 1.9 1.7 1.5 to 1.9 0 -0.3 to 0.3 1.0
Vegetables (weight in g) 119 107 to 132 122 109 to 135 2 -15 to 19 0.8
Vegetables (portions) 1.5 1.3 to 1.7 1.5 1.3 to 1.7 0 -0.2 to 0.3 0.8
Fruit & vegetables (weight in g) 253 234 to 273 255 237 to 273 2 -23 to 26 0.9 Fruit & vegetables (portions) 3.2 2.9 to 3.4 3.2 2.9 to 3.4 0 -0.3 to 0.3 0.9
Fruit & vegetables (g)** 228 135 to 335 238 144 to 343 10 n/a n/a
Energy (KJ) 7103 6827 to 7379 7239 6958 to 7520 136.4 -194 to 467 0.42
Energy (kcal) 1687 1621 to 1753 1719 1652 to 1786 32.4 -46.2 to 110.9 0.42
Total fat (g) 63.3 60.1 to 66.4 64.45 61.2 to 67.7 1.2 -2.8 to 5.1 0.56
Saturated fat (g) 22.4 21.2 to 23.6 22.4 21.1 to 23.6 0 -1.5 to 1.5 1.00
Total CHO (g) 235.5 226.8 to 244.2 237.4 228.6 to 246.2 1.9 -8.2 to 12 0.72 Total sugar (g) 110.4 104.8 to 116 111.5 105.8 to 117.2 1.1 -5.5 to 7.6 0.75
NSP (g) 12.3 11.6 to 13 12.4 11.7 to 13.1 0.1 -0.7 to 0.9 0.79
Sodium (mg) 2334 2207.1 to 2460.9 2460 2328.6 to 2591.4 126 -35.6 to 287.4 0.13
Folate (µg) 200.5 190.5 to 210.5 205.3 195 to 215.6 4.8 -7.3 to 17 0.44
Iron (mg) 10.3 9.7 to 10.9 10.6 9.9 to 11.2 0.3 -0.4 to 1 0.44
Zinc (mg) 6.9 6.4 to 7.3 7.3 6.8 to 7.8 0.4 -0.2 to 1 0.16
*carotene (µg) 1397 1169 to 1669 1474 1227 to 1772 77.9 -221 to 453 0.64
*Vitamin C (mg) 69.4 63.5 to 75.9 67.7 61.8 to 74.2 -1.7 -8.7 to 6 0.65
*Natural log
20 Table 3: Median intakes of fruit and vegetables at home and school at baseline and follow up
The medians in table 1 and 2 I think are fine, but in table 3 where the data is split between home and school the medians are now skewing the data. The median difference between table 1 and 2 for fruit and veg is approximately 50g, the combined totals from table 3 is approximately 150g. This is a big difference for the same data and is confusing to which is the more likely difference. (I would say difference between table 1 and 2 is more realiable). The text uses the difference based on table 3, if this is considered the most appropriate information to use this should be explained in the discussion. Otherwise table 3 should be removed.
HO
M
E
Control Intervention
Food Baseline median
IR Follow up median
IR Baseline median
IR Follow up
median
IR
Fruit (g) 63 0 to 97 0 0 to 95 66 0 to 113 11 0 to 95
Vegetables (g) 104 0 to 222 57 0 to 125 98 0 to 224 69 0 to 146
Fruit & vegetables (g) 184 80 to 301 124 46 to 203 190 85 to 286 142 57 to 219
S
CHOO
L
Control Intervention
Food Baseline median
IR Follow up median
IR Baseline median
IR Follow up
median
IR
Fruit (g) 94 67 to 182 61 0 to 95 126 71 to 174 61 0 to 96
Vegetables( g) 40 0 to 158 0 0 to 64 46 0 to 152 0 0 to 57
21
Figure Legends:
Figure 1 Flow diagram of schools entering and completing the trial