This is a repository copy of
The impact of distance to nearest education institution on the
post-compulsory education participation decision
.
White Rose Research Online URL for this paper:
http://eprints.whiterose.ac.uk/10709/
Monograph:
Dickerson, A. and McIntosh, S. (2010) The impact of distance to nearest education
institution on the post-compulsory education participation decision. Working Paper.
Department of Economics, University of Sheffield ISSN 1749-8368
Sheffield Economic Research Paper Series 2010007
eprints@whiterose.ac.uk https://eprints.whiterose.ac.uk/ Reuse
Unless indicated otherwise, fulltext items are protected by copyright with all rights reserved. The copyright exception in section 29 of the Copyright, Designs and Patents Act 1988 allows the making of a single copy solely for the purpose of non-commercial research or private study within the limits of fair dealing. The publisher or other rights-holder may allow further reproduction and re-use of this version - refer to the White Rose Research Online record for this item. Where records identify the publisher as the copyright holder, users can verify any specific terms of use on the publisher’s website.
Takedown
If you consider content in White Rose Research Online to be in breach of UK law, please notify us by
Sheffield Economic Research Paper Series
SERP Number: 2010007
ISSN 1749-8368
Andy Dickerson and Steven McIntosh
The Impact of Distance to Nearest Education Institution on
the Post–Compulsory Education Participation Decision
March 2010
Department of Economics University of Sheffield 9 Mappin Street Sheffield S1 4DT
United Kingdom
Abstract:
This paper uses data sources with the unique capacity to measure distances between home addresses and education institutions, to investigate, for the first time, the effect that such distance has on an individual’s post–compulsory education participation decision. The results show that there is no overall net effect. However, when attention is focussed on young people who are on the margin of participating in post–compulsory education (according to their prior attainment and family background) and when post–compulsory education is distinguished by whether it leads to academic or vocational qualifications, then greater distance to nearest education institution is seen to have a significant impact on the decision to continue in full– time post–compulsory education. This finding has relevance for education participation in rural areas relative to urban areas.
Key words: post-compulsory education participation, travel distance
JEL codes: J24; I20
Acknowledgments:
This paper is based in part on a research project funded by the Department for Environment, Food and Rural Affairs (Defra) (project number CTX 0808 002). The data from the Youth Cohort Study (YCS) and the Longitudinal Study of Young People in England (LSYPE) were made available by the ESRC Data Archive at the University of Essex. We are also extremely grateful to Clare Baker, Michael Greer and Helen Wood at DCSF, and Pippa Gibson at Defra for their help in creating the distance variables.
3
The Impact of Distance to Nearest Education Institution on the Post–Compulsory Education Participation Decision
1. Introduction
The decision to participate in education after it is no longer compulsory1 is argued to be
affected by three groups of interdependent factors: objectives; opportunities; and constraints
(Haveman and Wolfe, 1995). Objectives are set at a national level in terms of funding for
education versus competing demands, and also at the family level with respect to the value
placed on education, and the benefits that it can bring. Opportunities to partake in education
depend on the availability of local institutions delivering the desired programme of study.
Opportunities to engage in alternative activities, principally working, also influence the
education participation decision. Finally, constraints to engaging in post–compulsory
education include aptitude and ability, as well as financial constraints.
A considerable literature exists that examines the various factors that influence the decision
to participate in post–compulsory education, many of which fit into this
objectives/opportunities/constraints framework. Repeated studies have found that the biggest
influences on this participation decision are prior attainment and family background. In terms
of prior attainment, success in public examinations at the completion of compulsory
schooling has been shown many times to be strongly and positively related to the likelihood
of continuing into post–compulsory education. McIntosh (2001) and McVicar and Rice (2001)
offer time series evidence on the positive relationship between the rate of success in GCSE
examinations and the post–compulsory participation rate. Cross–sectional evidence at the
individual level for the same relationship is provided, inter alia, by Ashford et al. (1993), Gray
et al. (1993), Lenton (2005), Payne (1998) and Rice (1999). Since success in examinations in compulsory schooling is seen as ‘qualifying’ for the next stage, particularly when following
the academic route in further education, then higher attainment can be seen as creating
more opportunities for post–compulsory participation.2 Similarly, being raised in families with
greater socio-economic advantage (whether measured by household income, parental
occupation or parental education), can raise expectations and aspirations of young people to
attain a higher level of education, generate opportunities to study further, and to remove
1 In England, young people can legally leave full–time education at the end of the academic
year in which they turn 16. 2
4
constraints. Many of the same studies as cited above have revealed a positive relationship
between socio-economic advantage in family background and the likelihood of remaining in
post–compulsory education. The intergenerational mobility literature is also relevant to this
relationship, showing a positive influence of parental education and income on children’s
post–compulsory participation rates (Chevalier, 2004; Micklewright, 1989).
One opportunity/constraint that has never been investigated in the literature, however, as far
as we are aware, is the proximity to an institution providing post–compulsory education.
Individuals’ decisions regarding remaining in education may be influenced by the availability
of nearby educational institutions, so that for example, young people in rural areas who live
further from education institutions on average, may be less likely to undertake
post-compulsory education than their counterparts in urban areas. Greater travelling distances to
the nearest institution will increase the cost of staying in education, in financial terms through
travel costs, in temporal terms through the lost time spent commuting, and also possibly in
psychological terms caused by the inconvenience and possibly unpleasantness of a lengthy
commute every day. If participation in post–compulsory education is an investment decision
to be undertaken when the present value of the future benefits outweighs the current costs
as suggested by human capital theory (Becker, 1993, inter alios), then an increase in such costs can reduce the likelihood of undertaking the investment. We would not expect this
distance effect to dominate the other key drivers of post–compulsory participation discussed
above, namely prior attainment and family background. However, at the margin, when a
young person is just undecided (or indifferent) between participating or not, distance to travel
may just tip the balance one way or the other. Another reason for studying the impact of
distance on the post–compulsory education participation decision is that it is more amenable
to immediate policy influence than the main determinants of participation, prior attainment
and family background.3 For example, improved public transport or subsidised travel could
both cut down on the costs of travelling to a place of learning.
Our paper is, in part, also motivated by the announced future increase in the compulsory
participation age, which is to be raised to age 17 by 2013, and to age 18 by 2015.4 If greater
distance is seen to act as a significant deterrent or constraint on participation in
post-compulsory education by young people, perhaps particularly for those living in more remote
3
This is not to say that these effects can never be influenced by policy. For example, the introduction of the GCSE examination at the end of compulsory schooling in the UK in 1988 led to an immediate rise in the number of age 16 qualifications acquired, which in turn increased the post–compulsory participation rate (see Ashford et al., 1993).
4
5
rural areas, then further intervention may be needed in order to achieve the ambition of full
participation at age 17 or 18.
The remainder of the paper is structured as follows. The following section describes the two
data sets that we use to analyse the impact of distance on post-compulsory education
participation, and the methodology used. The results of the analysis are presented in Section
3, while a final section concludes.
2. Data and Methodology
In order to analyse the impact of distance on the post–compulsory participation decision, we
use data from two recent cohorts of young people in England, namely Cohort 12 of the Youth
Cohort Study (YCS), and the Longitudinal Study of Young People in England (LSYPE).
2.1 Youth Cohort Study
The YCS was designed primarily to provide information on young people’s transitions from
compulsory education to further and higher education, and/or the labour market. The YCS is
a continuing series of representative cohort surveys which started with Cohort 1 in 1985, and
has now reached Cohort 13 which was first interviewed in 2007. Each cohort is surveyed by
postal questionnaire on a number of occasions (called ‘sweeps’), with the first sweep in the
spring of the year following completion of compulsory education. Individuals are therefore
aged 16 or 17 when they first respond to the YCS. They are then re–interviewed on an
annual or biennial cycle, with most cohorts interviewed three times in total. Coverage for
Cohorts 1 to 12 is England and Wales, though we use data for England only, for reasons
explained below.
We use the latest available full data set, which is Cohort 12 (YCS12). Survey participants
were interviewed annually in 2004, 2005, 2006 and 2007. We focus mainly on Sweep 1
which was carried out in Spring 2004 for individuals who completed their compulsory
education 8 months earlier (i.e. were eligible to leave school for the first time in summer
2003). The YCS collects data on education and labour market activity, qualifications gained
and sought, details on current employment, as well some background socio–economic
information about families and their attitudes. YCS12 sweep 1 was the first YCS sweep
designed with the intention of collecting most Year 11 (i.e. GCSE) attainment information
from administrative sources rather than asking the survey respondents themselves.
6
provides information on individuals’ attainment.5 Since this administrative data source is only
available for England, and the coverage of our other data set described below also covers
England only, we restrict our attention to YCS respondents in England only.
2.2 Longitudinal Study of Young People in England
LSYPE is also focussed on young people’s transitions from education into the world of work.
It is a single cohort study (which is still ongoing), tracking a sample of young people from age
13/14 (Year 9) in Spring or Summer 2004 in order to better understand their development
from their early teens while still in education (as compared to the YCS which only starts
post–16). Interviews (known as ‘waves’) are taking place annually. We primarily focus on
wave 3 conducted in 2006 to obtain data on the explanatory variables about the young
people and their families. At this point, the respondents were (mostly) aged 16, and were
coming towards the end of their compulsory education, or in some cases had just completed
it. The post–compulsory education participation variable in LSYPE was derived from
information on respondents’ current activity in wave 4 of the survey, conducted in 2007,
around one year after the end of their compulsory schooling.
The LSYPE questionnaires cover a broader range of topics than the (shorter) YCS
questionnaire.6 Thus, in addition to the areas covered in YCS, LSYPE also includes: attitudes
to school and involvement in education; parental expectations and aspirations; risk factors
(absences, truancy, police contact, bullying) and a range of parental questions. As with the
latest YCS, individuals can be matched with administrative data sources, such as the NPD,
which provides Key Stage test results as well as GCSE attainment etc.
The above descriptions of the two data sets to be used make clear that they are from two
different points in time, being three education years apart – 2004 for YCS12 and 2007 for
LSYPE. Various education policies were introduced or changed during these three years7,
meaning that the education system faced by respondents in LSYPE is not exactly the same
as that faced by respondents in YCS12. Such differences must be borne in mind throughout
5
The linking of respondents to their individual attainment records in the NPD serves to reduce respondent burden as well as to increase the accuracy of the information in the YCS. 6 See http://www.esds.ac.uk/longitudinal/access/lsype/L5545.asp for further information.
7
7
this study, and could potentially explain some of the different results found across the two
data sets as reported below.
2.3 Methodology
The dependent variable used in the first specification to be estimated is a dichotomous
variable indicating simply whether an individual is participating in full–time education8 at the
time that they reply to the survey, during the year following their completion of compulsory
schooling. The relationship is therefore estimated using a simple probit equation.
We also have information in both surveys on the qualification for which the respondents are
studying. These various qualifications were classified into either academic or vocational
qualifications, in order to examine whether the determinants of post–compulsory participation
vary by type of qualification being studied.9 In order to jointly estimate the likelihood of
undertaking each of these types of post–compulsory education, in the second specification a
multinomial logit model was estimated. The dependent variable in this case took one of three
values, indicating academic study, vocational study and no post–compulsory education. The
latter formed the reference category.
A range of explanatory variables is available in both data sets used. These include measures
of respondents’ prior attainment which is indicated by whether they have achieved 5 or more
GCSEs at grade C or above at the completion of compulsory schooling, and also whether
these 5 or more successes included Maths and English. Standard demographic controls are
available in both data sets, as well as indicators of family background such as type of
housing tenure, parental occupation and parental education. Attitudes to schooling and
education are measured by whether respondents report a history of truancy, or have ever
been suspended or expelled from a school.10 The only school characteristic observed in the
8
This definition of post–compulsory education as full–time education therefore excludes part–time education participation, apprenticeships or workplace training.
9
In England, the ‘academic’ route is followed by those studying for A Levels, usually in three or more subjects that are examined at age 18 after 2 years of study in secondary school ‘sixth forms’, Sixth Form Centres or colleges of Further Education. The range of ‘vocational’ qualifications is much wider (examples include National Vocational Qualifications, City and Guilds qualifications and Business and Technology Education Council (BTEC) qualifications), and can be taken in a wider variety of settings, such as in colleges of Further Education or in the workplace. Since we are only concerned here with full–time education, most vocational study we observe will be in the former setting.
10
8
YCS data set is whether the young person attended an independent or grammar school in
their last year of compulsory schooling. The LSYPE data set, with matched in administrative
data, contains considerably more information about the school(s) attended and the
respondents’ peer groups, such as the proportion of pupils in the school who achieve 5 or
more good GCSEs, the proportion of pupils in receipt of free school meals, as an indicator of
socio–economic background of the school’s intake, and the unauthorised absence rate.
There are other variables available in LSYPE but not in the YCS, in particular derived from a
parental questionnaire asking about their attitudes to their children’s education.
The main contribution of this paper is the analysis of the impact of distance to nearest
education institution on the post–compulsory participation decision. This relationship has not
been investigated in the literature before, presumably because of a lack of data. In our case,
distance variables were created by using information on individuals’ home location based on
their full postcodes. This information was combined with postcode information for all
institutions providing post–compulsory education in England. The postcode information for
individuals and institutions was then converted to grid references based on the centre of
each postcode using GeoConvert11. Finally, ArcGIS12 was used to calculate the distance ‘as
the crow flies’ for each individual from their home to their nearest education institution.
Table 1 provides descriptive statistics for all of the variables used in the analysis. The first
row shows that the participation rate at the time that the two surveys were undertaken was
75% in the YCS and 72% in LSYPE. The fact that the participation rate is lower in LSYPE
which is the later survey does not imply that the participation rate is falling (indeed, it is
marginally increasing over this period).13 One explanation is that most LSYPE respondents
are surveyed in July or August, whilst most YCS respondents are surveyed in March. LSYPE
respondents are therefore surveyed around four months later in the year than YCS
respondents, thus allowing more time for course completion or dropout, and so creating a
lower participation rate in LSYPE.14
11
http://geoconvert.mimas.ac.uk/
12
http://www.esri.com/software/arcgis/index.html
13
The latest (2008) official figures for proportions of young people in full–time education are 81.5% of 16 year olds and 67.6% of 17 year olds (Source: http://www.dcsf.gov.uk/rsgateway/ DB/SFR/s000849/index.shtml). Our samples contain both 16 and 17 year olds.
14
9
The remaining rows in Table 1 show that the background characteristics of the two cohorts of
young people are very similar. The distances they live from their nearest educational
institutions are also very similar, on average. The prior attainment rates show slightly higher
achievement amongst the LSYPE respondents. This is consistent with the general rise in
GCSE attainment over the period spanned by our two datasets.15
3. Results
3.1 Participation in Post–Compulsory Education – YCS
Before beginning the econometric analysis of the YCS data, a simple bivariate analysis of the
relationship between post–compulsory participation and distance to nearest education
institution was undertaken. The results showed that the average distance to nearest
institution did not differ significantly between participants and non-participants. However, if
participation is distinguished by whether individuals are studying for either academic or
vocational qualifications, with education institutions similarly distinguished by the type of
education offered, then there are some interesting differences. In particular, participants in
academic post-compulsory education live, on average, 400m closer to an academic
institution than do non-participants, and this difference is statistically significant at the 5%
significance level. The difference in distance to nearest vocational institution between
vocational education participants and non-participants was however statistically insignificant.
This dichotomy in type of education will be investigated further in the next sub–section.
Of course, many other factors also affect the participation decision, and hence we now turn
to an analysis that includes these other covariates. Table 2 reports the marginal effects from
a probit equation analysing the factors associated with participation in post–compulsory
education in the YCS. The first row reveals a small and statistically insignificant effect of
distance to nearest education institution on the decision to participate in post–compulsory
full–time education. Across the whole sample, distance does not seem to have a significant
impact on the decision to participate in post–compulsory education.
The marginal effects of the other control variables mostly accord with the existing literature.
The key determinant of post–compulsory participation is prior attainment in GCSE
examinations at the end of compulsory schooling. Young people who achieve 5 or more
GCSEs at grade C or above are 13 percentage points more likely to participate in post–
10
compulsory education. There is an additional impact of almost the same size again if
individuals hold Maths and English amongst their 5 or more good GCSEs, showing the
importance of those two subjects for progression. The importance of family background is
shown by the positive and statistically significant marginal effects observed for the parental
education and occupation variables.16 Even after controlling for the young person’s own
family background, there is an additional effect of living in more deprived neighbourhoods, as
shown by the strong negative marginal effect on the regional index of local deprivation
variable.17 In terms of individual characteristics, females and young people from ethnic
minorities are significantly more likely to participate in post–compulsory education after
controlling for other factors, as is usually observed in the literature, by 4 and 10 percentage
points relative to males and non–ethnic minority individuals, respectively. Finally, as
expected, a history of truancy or exclusion from schools is associated with a significantly
lower likelihood of post–compulsory participation.
3.2 Participation in Post–Compulsory Education, by Type of Education – YCS
The previous sub–section showed that, overall, there is negligible effect of distance on
participation. However, post–compulsory education comprises very different types of
learning, and can be distinguished in particular by academic18 or vocational pathways. It is
possible that the influences on the participation decision vary by type of learning. To date,
very few studies in the literature have considered how the likelihood of post–compulsory
participation varies by type of education, with Clark (2002), Conlon (2005) and Lenton (2005)
being exceptions.19 This paper adds to this small literature on the distinction between
academic and vocational participation, with the focus being on distance to education
institution.
16
After controlling for these other parental variables, parental employment surprisingly attracts negative and statistically significant marginal effects. The raw correlation between parental employment and child’s post–compulsory participation takes the more anticipated positive effect.
17
The IMD is a weighted average of 7 ‘domains’ or separate indicators of deprivation (income deprivation; employment deprivation; health deprivation and disability; education, skills and training deprivation; barriers to housing and services; living environment deprivation; and crime). See http://www.communities.gov.uk/communities/neighbourhoodrenewal/ deprivation/deprivation07/ for further details.
18
Note that the academic pathway is here defined to be taking post-compulsory, Level 3 academic qualifications (i.e. A Levels in England). The relatively small number of individuals who are re-taking academic Level 2 qualifications (i.e. GCSEs in England) that they failed to obtain during compulsory education are likely to be very different people making different choices, and so should not be included in the same category.
19
11
Two variables were created, one measuring the distance to the nearest institution offering
‘academic’ qualifications, and the other measuring the distance to the nearest institution
offering ‘vocational’ qualifications. Note that all types of institution offer academic
qualifications. In classifying education institutions, it was assumed that only Further
Education Colleges and Sixth Form Centres offer vocational education, in addition to
academic qualifications. Thus, for every individual, the distance to the nearest institution
offering vocational education must be greater than or equal to the distance to the nearest
institution offering academic education. As a consequence of this, on average, individuals
live further from an institution offering vocational qualifications than from an institution
offering academic qualifications. The average distance from an academic institution is 2.29
kilometres in both data sets (with a standard deviation of 2.5 in both data sets), while the
average distance from a vocational institution is 5.96 kilometres in the YCS and 5.63
kilometres in LSYPE (with a standard deviation of 5.8 in the YCS and 5.2 in LSYPE).
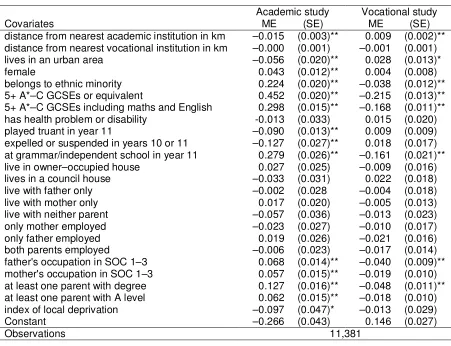
The results of the multinomial logit analysis of the YCS data are displayed in Table 3. The
first row shows that the further individuals live from an institution offering academic
qualifications, the less likely they are to undertake post–compulsory academic study, with
each kilometre in distance reducing the likelihood of participating in education focussed on
obtaining academic qualifications by 1.5 percentage points. A one standard deviation
increase in distance to institutions offering academic qualifications is therefore associated
with a 3.75 percentage point reduction in the probability of participation. By contrast, the
further individuals live from an institution offering academic qualifications only, the more likely
they are to undertake study of vocational subjects, by 0.9 percentage points per kilometre
distance (or by 2.25 percentage points for a one standard deviation increase in distance).
Interpreting these effects for a fall in distance, it is therefore the case that if an individual lives
nearer an institution that offers only academic qualifications, then they are more likely to
pursue academic, and less likely to pursue vocational, qualifications, presumably to avoid a
costly commute. In contrast, if the institution offering academic qualifications is further away
(thus implying that no institution is close) then some individuals switch to vocational study.
Given the overall participation rates (approximately one–half of 16/17 year olds engaged in
study for academic qualifications, one–quarter in study for vocational qualifications and one–
quarter not participating in post–compulsory education), and the average distances involved
to institutions as reported in the previous paragraph, then the marginal effects per kilometre
distance in Table 3 are not large. At the margin, the absence of a local institution providing
academic qualifications will persuade a small number of individuals to switch to vocational
study. The idea of the marginal individual being influenced by distance will be developed
12
qualifications does not seem to have any effect on the decision to participate in any form of
post-compulsory education.
Briefly considering the other marginal effects in Table 3, those characteristics that were
statistically significantly related to overall participation are also related to academic
participation, with the same sign but a larger effect in most cases. Thus, those young people
who acquire 5 or more good GCSEs are 45 percentage points more likely to participate in
post–compulsory academic study, with an additional 30 percentage point effect if their
GCSEs include Maths and English. These are very large effects, and clearly a cut-off in
access to academic post-compulsory education still exists for individuals who fail to achieve
this standard. The marginal effects on the parental education and occupation variables
similarly remain positive and are larger in size than before. An additional effect, not found in
the overall participation results in Table 2 is that, over and above any distance effect, young
people in urban areas are less likely to participate in academic post–compulsory education,
and more likely to participate in vocational post–compulsory education, relative to similar
individuals in rural areas.20
The coefficient for living in an urban area is just one example of an interesting pattern,
whereby many of the variables in the estimated multinomial logit equation have opposite
signed marginal effects on academic and vocational study. It might have been expected that
the effects would have the same sign when explaining both types of post–compulsory
education (with perhaps the academic effects being larger in size if such qualifications are
considered to be the more desirable). Recall that the effects are measured relative to the
omitted category, which in this case is not participating in post–compulsory education at all.
So we might have expected a person with, say, good GCSEs to be much more likely to study
for further academic qualifications than not to study at all, but also to be at least somewhat
more likely to study for vocational qualifications than not to study at all. However, the results
show that this is not the case, with individuals holding good GCSEs being less likely to undertake post–compulsory vocational education than to not participate in further education
at all. The pattern of results is similar for those young people who attended a
grammar/independent school, or who have well–educated parents or parents in high skill
occupations. It therefore seems that the hierarchy of choice in post–compulsory education for
young people with good GCSEs or from families with higher socio–economic status is: first,
13
academic study; then second, no post–compulsory education; and only then, last of all,
participating in vocational study.
In order to further understand such results and this observed attractiveness of leaving full–
time education relative to full–time vocational study, it should be remembered that not
participating in full–time education does not necessarily mean doing nothing at all, and that
young people no longer participating in full-time education may be in employment or
engaged in other forms of learning. Examination of the YCS data shows that, of those young
people not participating in full–time education in the year after the completion of compulsory
education, 32% are in full–time employment, 13% in part–time employment and 25%
engaged on an apprenticeship. As for the remainder, 20% are unemployed, 8% economically
inactive and 2% do not report their economic status. Full–time employment rates do vary
positively, and unemployment rates negatively, with the number of GCSEs obtained by the
end of compulsory schooling, consistent with the findings in the previous paragraph that
leaving education for the labour market is relatively more attractive than full–time vocational
study amongst those with better GCSEs who have decided against further study for
academic qualifications.
3.3 Participation in Post–Compulsory Education by Marginal Students, by Type of Education – YCS
It was suggested in both the Introduction and in the previous sub–section that distance might
have a greater impact on the marginal individual, who is almost indifferent between
participating in post–compulsory education or not, or between undertaking academic or
vocational study. The question remains, however, how to identify the marginal individuals in
our analysis.
Table 4 splits each of the datasets into four groups according to the number of GCSEs
achieved at the completion of compulsory schooling. The proportion falling within each
category shows that these GCSE groups are not equal in size. The key column is that
showing the participation rate in academic post–compulsory education. Amongst those
young people with 7 or more good GCSEs (grades A*–C), the academic participation rate is
80–86%, depending on data set. By contrast, 11–12% of individuals with 1–3 good GCSEs,
and only 3–4% of individuals with no good GCSEs, undertake academic qualifications post–
16. Thus, the vast majority of those with 7 or more good GCSEs appear to automatically
follow the academic route, whilst this route appears closed to all but a few young people with
3 or fewer good GCSEs. However, those with 4–6 good GCSEs appear quite evenly split
14
marginal individual will therefore be found in this group. The hypothesis to be tested is
therefore that the distance effect will be greater for young people in the 4–6 GCSE group,
than in any other GCSE group. Note that any variation in distance effect size will not be
driven by different distances in the various groups21, since average distance to the nearest
education institution is very similar across all GCSE groups, in both data sets.
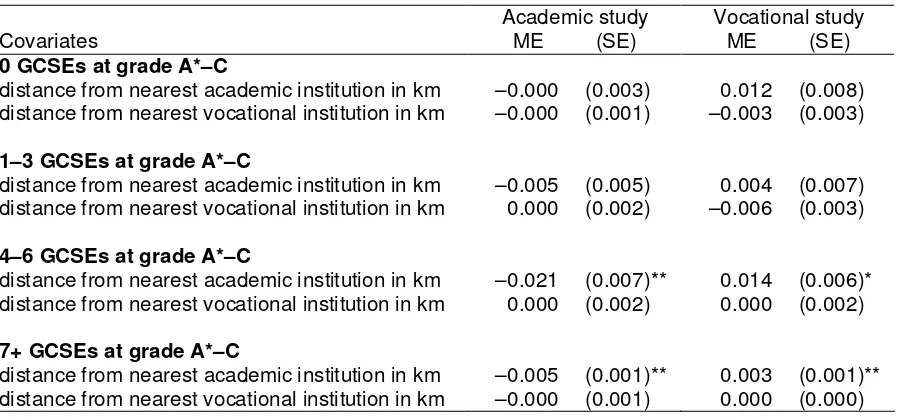
Table 5 reports the coefficients on the distance measures for four sub-groups of the cohort
defined by GCSE performance, in order to test the hypothesis proposed in the previous
paragraph. There is clear evidence in support of the hypothesis. Amongst young people with
either 0 or 1–3 good GCSEs, distance to nearest institution has no impact on their
participation, in either academic or vocational study. For these groups, their participation is
low, particularly for academic qualifications which are more affected by distance effects in
general as shown in Table 3 above. In most cases they have already decided not to
participate in academic post–compulsory study, and the presence of a nearby academic
institution is not going to change their minds. For individuals with 4–6 or 7+ good GCSEs,
distance to nearest institution offering academic qualifications does affect their likelihood of
participating in post–compulsory education. The marginal effects are statistically significantly
larger for individuals in the marginal group with 4–6 good GCSEs however. Thus, for each
kilometre that this group live distant from an institution offering academic qualifications, their
probability of undertaking post–compulsory academic study falls by 2.1 percentage points (or
a 5.25 percentage point fall in participation for a one standard deviation increase in distance),
while their probability of undertaking post–compulsory vocational study increases by 1.4
percentage points (or by 3.5 percentage points for a one standard deviation increase in
distance). Thus, for these ‘marginal’ participants, distance is an important determinant of
their participation decision.
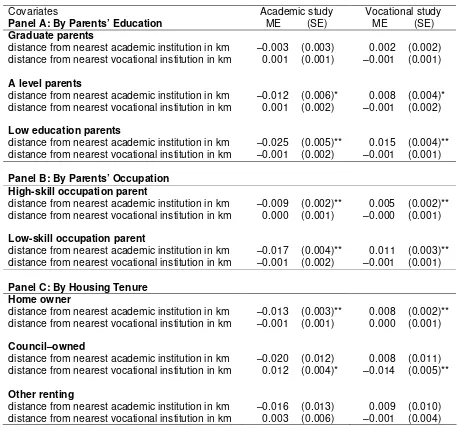
Table 6 considers alternative definitions of ‘marginal’ participants in post–compulsory
participation, this time in terms of their family background. It is well known that post–
compulsory participation is higher amongst families with higher income. For example, Machin
and Vignoles (2005) report a staying–on rate of 90% amongst children living in families in the
top quintile of household income in 2000, a proportion which is almost certainly even higher
now given the growth in participation. Our marginal participants will therefore not be found in
the richest households. Table 6 splits families by, respectively, parental education (Panel A),
21
15
parental occupation (Panel B) and type of housing tenure (Panel C). The negative impact of
distance on academic post–compulsory participation is greater amongst the young people
from less socio-economic advantaged families, with lower–education versus graduate
parents, and for council–owned tenure versus other forms of home ownership. The largest
distance effect observed in the three panels of Table 6 is for young people whose parents
only achieved a low level of education, for whom each additional kilometre distance from an
academic institution reduces their likelihood of post–compulsory participation by 2.5
percentage points (or a 6.25 percentage point fall in participation for a one–standard
deviation increase in distance).
3.4 Participation in Post–Compulsory Education, by Type of Education – LSYPE
Table 7 reports the results from a similar multinomial logit equation as was estimated in
Table 3, but now using the LSYPE rather than the YCS data. As the list of variables in Table
1 makes clear, LSYPE contains considerably more information with which to control for other
factors that might influence post–compulsory participation. In particular, there is much more
information on the schools attended by respondents whilst in compulsory education, as well
as more information on the attitudes to education of their parents. The results presented in
this section are therefore a robustness check on the key results obtained above with the
YCS, to determine whether the same results are obtained when these additional controls for
school quality and parental attitudes are included.
The results in Table 7 show that this greatly expanded list of control variables does not
significantly affect the size of the distance impact on participation.22 In LSYPE, each
additional kilometre distance from an institution providing academic qualifications reduces
respondents’ likelihood of participating in academic post–compulsory education by 1
percentage point (a 2.5 percentage point fall for a one standard deviation increase in
distance), while increasing their likelihood of participating in vocational post–compulsory
education by 0.9 percentage points (a 2.25 percentage point increase for a one standard
deviation increase in distance).23 In addition, there is a disincentive effect of living at a
greater distance from vocational education provision on vocational education participation in
LSYPE that was not observed in the YCS, of 0.5 percentage points per kilometre distance (or
2.6 percentage points for a one standard deviation increase in distance).
22
The probit results considering any type of post–compulsory participation were also qualitatively the same using LSYPE as those obtained with the YCS data and reported in Table 2 above. As the distance effect is statistically insignificant in this specification, the LSYPE probit results are not reported here.
16
The inclusion of the additional control variables available in LSYPE does not affect the
results found for the standard control variables, with prior attainment and family background
continuing to be the most important correlates of post–compulsory participation as before. Of
the new variables added, the characteristics of respondents’ former schools and average
attainment levels of their pupils individually have, at best, only a small role to play in
explaining post–compulsory participation, although they are jointly statistically significant.24
Amongst the new parental attitude variables, attending parents’ evenings, paying for private
tuition and parental desire for their child to continue in post-compulsory education all have
positive and statistically significant effects, and with the latter particularly strongly associated
with a higher likelihood of the young person participating in post–compulsory education.
Table 8 splits the LSYPE sample by prior attainment at GCSE level. The results are even
more striking than the YCS results (compare Table 5) in that it is clearly only the marginal
group with 4–6 good GCSEs where distance has any role in explaining post–compulsory
participation. The marginal effects for this group are larger than those observed in Table 5
with the YCS. Each kilometre increase in the distance an individual with 4–6 good GCSEs
has to travel to an institution offering academic qualifications reduces their likelihood of
participating in academic post–compulsory education by 3.8 percentage points (or by 9.5
percentage points for a one standard deviation increase in distance), while raising their
likelihood of participating in vocational post–compulsory education by 2.4 percentage points
(or by 6 percentage points for a one standard deviation increase in distance). Table 8 also
shows a smaller, but statistically significant, negative effect of distance to nearest institution
offering vocational education on the likelihood of undertaking vocational post–compulsory
learning for this marginal GCSE group.
3.5 Non–linear Effects of Distance
So far the effect of distance on post–compulsory participation has been assumed to be
linear. However, the effect may be non–linear, such that the negative influence of distance
may have an increasingly larger effect the greater the distances involved, or may only have
any impact at all for large distances. Thus, an extra kilometre may not influence the
participation decision much when short distances are involved (i.e. whether an individual
lives 1 or 2 kilometres from an education institution does not greatly affect their decision to
remain in post–compulsory education), but at further distances, an extra kilometre may just
tip the balance in the decision not to participate (i.e. living 7 kilometres away rather than 6
24
17
does have more of an effect on the staying–on decision). To investigate whether there are
such non–linear effects, the continuous distance measures used so far were replaced with
dummy variables indicating 2–8 kilometres from the nearest education institution and more
than 8 kilometres from the nearest education institution (with the base category being
individuals who live less than 2 kilometres away), separately for institutions providing
academic and vocational qualifications.25 The marginal effects for the new distance variables
are shown in Table 9 for YCS and LSYPE specifications that continue to control for the same
other covariates as above. The full sample results in Panel A show significantly lower
academic participation rates amongst those who live more than 8 kilometres distance from
an academic institution relative to those who live less than 2 kilometres distance, by around
10 percentage points in both data sets. When the sample is split by level of GCSE attainment
as in Panel B, the statistically significant effects are again clearly clustered amongst the
marginal participation group with 4–6 good GCSEs. The effects are also very large in
absolute size. Those young people who live more than 8 kilometres distance from an
academic institution are 18 percentage points (YCS) to 27 percentage points (LSYPE) less
likely to participate in academic post–compulsory education, compared to those who live less
than 2 kilometres distance. Given that Table 4 reported that the academic post–compulsory
participation rate of this group was 47% (YCS) or 38% (LSYPE), these marginal effects are
clearly very large. In addition, in the LSYPE results only, there is a negative effect of living
more than 8 kilometres from an institution offering vocational qualifications on the likelihood
of post–compulsory vocational participation amongst the marginal (4–6 good GCSE) group,
by 15 percentage points relative to those who live less than 2 kilometres distance.
4. Conclusions
This paper has used the unique provision of distance information to investigate, for the first
time in the literature, the impact of distance to one’s nearest education institution, on the
probability of participating in post–compulsory education. For many individuals, distance is
not an issue, as they live within easy (walking or cycling) distance of their nearest education
institution. In addition, many young people have their post–16 lives already clearly mapped
out, in terms of further academic study if they have achieved good results in their GCSE
examinations, or leaving full–time education if they have obtained few or no GCSEs. There is
25
18
however a group of young people who are on the margin between participating in post–
compulsory education or not. The results presented above show that, whether we define the
marginal participant in terms of having a mid–level of prior attainment (4–6 good GCSEs), or
in terms of coming from a relatively socio-economically disadvantaged background, we
consistently find that distance to nearest institution can affect the decision to partake in post–
compulsory education. These results are robust across two separate data sets. Some of the
effects of distance become very large, with the biggest effect suggesting that those who live
more than 8 kilometres distance from an academic institution are 27 percentage points less
likely to participate in academic post–compulsory education, compared to those who live less
than 2 kilometres distance (Table 9, LSYPE). Since only a small minority of young people
live at such distances from their nearest education institution, and the result only applies to
marginal students living at such distances, this result is clearly not widely applicable.
However, for those individuals affected, distance to the nearest education institution is an
important aspect to take into consideration when trying to decide whether to participate in
post–compulsory education.
As far as policy implications are concerned, the analysis cannot identify the cause of the
distance effect. Thus, it is not known whether greater distances reduce the incentive to
participate because of financial travel costs, or time and psychological (boredom) costs of
frequent long commutes. If the former turns out to be the cause, then subsidised travel for
those participating in post–compulsory education would be an effective policy. If the latter is
the cause, then one policy response would be to improve the frequency of travel services
and reduce travel time. Since distance affected only marginal students, making any such
policies universally applicable would involve considerable deadweight. Targeted policies on
those individuals whose decisions are influenced by distance would therefore be the most
effective. Clearly it would be easier to target financial travel subsidies than general travel
services. It would also be difficult to justify targeting subsidised travel specifically on the
group with 4–6 GCSEs. The other definitions of the marginal participant, in terms of family
background will therefore be more useful, with subsidised travel for students from less well–
off families being an appropriate policy response.
Finally, from an econometric methodology point of view, the results presented here have
relevance for any empirical field where an instrument is required for education or
qualifications acquired, for example in the returns to education literature. Given the effect of
distance on participation, and assuming family household location is judged to be exogenous
as far as the future earnings of the children is concerned, then distance to nearest institution
19
REFERENCES
Ashford, S., Gray, J. and Tranmer, M. (1993). ‘The introduction of GCSE exams and changes in post–16 participation.’ Employment Department Research Series, Youth Cohort Report no. 23.
Becker, G S (1993, 3rd edition) Human Capital, University of Chicago Press, NBER.
Clark, D. (2002). ‘Participation in post–compulsory education in England: what explains the boom and bust?’ Centre for the Economics of Education Discussion Paper 24.
Chevalier, A. (2004) ‘Parental education and child’s education: a natural experiment,’ Centre for Economics of Education Discussion Paper 40.
Conlon, G. (2005). ‘The determinants of undertaking academic and vocational qualifications in the United Kingdom.’ Education Economics, 13, 299–313.
Dearden, L., McIntosh, S., Myck, M. and Vignoles, A. (2002). ‘The returns to academic and vocational qualifications in Britain,’ Bulletin of Economic Research, 54, 249–274.
Gray, J., Jesson, D. and Tranmer, M. (1993). ‘Boosting post–16 participation in full–time education. A study of some key factors.’ Employment Department Research Series, Youth Cohort Report no. 20.
Haveman, R. and Wolfe, B. (1995). ‘The determinants of children’s attainments: A review of methods and findings.’ Journal of Economic Literature, 33, 1829–1878.
Lenton, P. (2005). ‘The school–to–work transition in England and Wales.’ Journal of Economic Studies, 32, 88–113.
Machin, S. and Vignoles, A. (2005). What’s the Good of Education? New Jersey: Princeton University Press.
McIntosh, S. (2001). ‘The demand for post–compulsory education in four European countries.’ Education Economics, 9, 69–90.
McIntosh, S. (2006). ‘Further analysis of the returns to academic and vocational qualifications,’ Oxford Bulletin of Economics and Statistics, 68, 225–251.
McVicar, D. and Rice, P. (2001). ‘Participation in further education in England and Wales: an analysis of post–war trends.’ Oxford Economic Papers, 53, 47–66.
Micklewright, J. (1989). ‘Choice at sixteen.’ Economica, 56, 25–39.
Payne, J. (1998). ‘Routes at sixteen. Trends and Choices in the Nineties.’ Department for Education and Employment Research Report 55.
20
Table 1: Descriptive Statistics
Variable description YCS LSYPE
PANEL A: Common specification
% participating in full–time education 74.7 71.7
% participating in full–time academic education1 47.0 47.6
% participating in full–time vocational education1 28.3 26.6
A1. Young person characteristics variables
% female 49.4 49.3
% respondent from ethnic minority 13.0 12.9
5+ A*–C GCSEs or equivalent 54.2 57.8
% 5+ A*–C GCSEs including Maths and English 44.3 45.8
% has health problem or disability 4.0 3.3
% played truant in Year 11 32.7 25.0
% expelled or suspended in Years 10 or 11 10.1 7.3
A2. School variables
% at grammar/independent school in Year 11 10.7 11.0
A3. Family background variables
% live in owner–occupied house 80.1 72.5
% lives in a council house 12.7 21.9
% live with father only 5.6 2.8
% live with mother only 16.1 23.2
% live with neither parent 3.9 1.1
% only mother employed 11.6 18.7
% only father employed 15.8 14.9
% both parents employed 59.3 51.3
% father's occupation in SOC 1–3 34.6 31.8
% mother's occupation in SOC 1–3 26.7 28.2
% at least one parent with a degree2 26.1 17.9
% at least one parent with A–levels2 20.5 24.5
A4. Spatial variables
distance from academic institution in km 2.29 2.29
distance from vocational institution in km 5.96 5.63
index of local deprivation 0.21 0.22
PANEL B. Additional variables available in LSYPE B1. Young person characteristics variables
key stage 3 average points score3 33.9
% parent mentions child has special needs 10.1
% child currently has statement of special needs 4.2
% had work experience place while at school 37.2
% whether has a job during term time 30.3
% whether has caring responsibilities 5.9
attitude to school4 32.3
B2. School variables
% independent school 7.2
% foundation school 15.5
% voluntary aided/controlled school 13.4
% of 15 year olds at school with SEN 14.3
% reaching Level 2 at school 55.1
KS3–GCSE value added at school5 991.4
% unauthorised absence rate at school 1.2
% eligible for free meals at school 14.1
% at school first language not English 8.6
B3. Family background variables
% father not present 24.4
% mother not present 4.0
21
Variable description YCS LSYPE
% father in intermediate job 20.4
% father in routine job 14.5
% mother in professional/managerial job 28.2
% mother in intermediate job 20.0
% mother in routine job 21.6
% mother has a degree 10.4
% mother has other HE 11.6
% mother has A–levels 12.5
% father has a degree 10.3
% father has other HE 7.6
% father has A–levels 12.3
% high family income6 54.3
% lives with both natural parents 62.0
% lives in a single parent family 24.5
number of siblings living in household 1.4
number of risk factors faced7 1.5
B4. Parental attitude variables
% whether attend parents' evenings 83.2
% arranged special meetings with teachers 27.0
% parent very / fairly involved in child's school life 75.4
% whether paid for private tuition in last year 14.1
% parent wants child to continue in post–comp. education 79.5
% parents will pay expenses of post–comp. education 86.7
Notes to Table 1
1. The proportions participating in academic and vocational education do not sum to the proportion participating in full-time education overall, because a small number individuals report undertaking both academic and vocational qualifications (which is perfectly possible), while a small number of others report being in full-time education but do not report which qualification they are studying for, and so cannot be classified as either academic or vocational. The first effect is numerically more important in this case, since the proportions in the separate streams sum to more than the proportion in full-time education overall. In the empirical analysis of Section 3.3 and 3.4 where type of education is distinguished, those studying both types of qualification are classified as academic, whilst those who do not report their type are omitted from the analysis.
2. The qualifications held by parents are measured as their highest qualification. The reason for the higher level of parental qualification in the YCS is not clear. The YCS question does include step– parents, whilst the LSYPE question refers to just parents, potentially giving more people amongst whom to find a higher qualification in the YCS.
3. The average Key Stage 3 score variable has a minimum value of 15 and maximum value of 53 in the data, with a standard deviation of 6.8.
4. The ‘attitude to school’ variable is derived from the responses to a series of statements in LSYPE, with which respondents are asked whether they agree or disagree. Examples of the statements include ‘I am happy when I am at school’, ‘school is a waste of time for me’, ‘school work is worth doing’, ‘I work as hard as I can at school’ etc. The variable has a minimum value of 0 and a maximum value of 48 in the data, with a standard deviation of 8.4.
5. The value added 'score' for each pupil is the difference between their GCSE/GNVQ total point score and the median GCSE/GNVQ point score for all pupils with a similar average Key Stage 3 score. These are then aggregated to give a 'score' for the school. This indicates the value the school has added, on average, for those pupils between Key Stage 3 and GCSE/GNVQ. In the data the variable has a minimum value of 930.4 and a maximum value of 1063.9, with a standard deviation of 18.0
6. ‘High family income’ is defined as above the median income. However, because the family income data is grouped into 13 bands, and the median falls part way into one band, then some individuals in this particular band are classed as ‘high income’ when in fact their unknown precise family income will lie just below the median. This gives an overall proportion of 54% reporting above median family income, rather than the anticipated 50%.
22
Table 2: Determinants of Participation in Post–Compulsory Education – YCS
Covariates ME (SE)
distance from nearest institution in km –0.002 (0.002)
lives in an urban area –0.006 (0.010)
female 0.040 (0.006)**
belongs to ethnic minority 0.102 (0.006)**
5+ A*–C GCSEs or equivalent 0.128 (0.012)**
5+ A*–C GCSEs including maths and English 0.112 (0.011)** has health problem or disability 0.014 (0.015)
played truant in year 11 –0.074 (0.008)**
expelled or suspended in years 10 or 11 –0.109 (0.015)** at grammar/independent school in year 11 0.079 (0.009)**
live in owner–occupied house 0.015 (0.013)
lives in a council house 0.003 (0.014)
live with father only –0.003 (0.014)
live with mother only 0.011 (0.010)
live with neither parent –0.069 (0.021)**
only mother employed –0.038 (0.015)*
only father employed –0.014 (0.013)
both parents employed –0.030 (0.011)**
father's occupation in SOC 1–3 0.014 (0.007)
mother's occupation in SOC 1–3 0.028 (0.007)**
at least one parent with degree 0.050 (0.008)** at least one parent with A level 0.029 (0.007)**
index of local deprivation –0.093 (0.023)**
Observations 12,139
Notes to Table 2
1. Table presents marginal effects (ME) on the probability of participation. 2. Standard errors (SE) in parentheses.
23
Table 3: Multinomial Logit for Participation in Post–Compulsory Education, by Type of Education – YCS
Notes to Table 3
1. Table presents marginal effects (ME) on the probability of participation. 2. Standard errors (SE) in parentheses.
3. * significant at 5%; ** significant at 1%.
Academic study Vocational study
Covariates ME (SE) ME (SE)
distance from nearest academic institution in km –0.015 (0.003)** 0.009 (0.002)** distance from nearest vocational institution in km –0.000 (0.001) –0.001 (0.001)
lives in an urban area –0.056 (0.020)** 0.028 (0.013)*
female 0.043 (0.012)** 0.004 (0.008)
belongs to ethnic minority 0.224 (0.020)** –0.038 (0.012)**
5+ A*–C GCSEs or equivalent 0.452 (0.020)** –0.215 (0.013)** 5+ A*–C GCSEs including maths and English 0.298 (0.015)** –0.168 (0.011)** has health problem or disability -0.013 (0.033) 0.015 (0.020)
played truant in year 11 –0.090 (0.013)** 0.009 (0.009)
expelled or suspended in years 10 or 11 –0.127 (0.027)** 0.018 (0.017) at grammar/independent school in year 11 0.279 (0.026)** –0.161 (0.021)**
live in owner–occupied house 0.027 (0.025) –0.009 (0.016)
lives in a council house –0.033 (0.031) 0.022 (0.018)
live with father only –0.002 (0.028 –0.004 (0.018)
live with mother only 0.017 (0.020) –0.005 (0.013)
live with neither parent –0.057 (0.036) –0.013 (0.023)
only mother employed –0.023 (0.027) –0.010 (0.017)
only father employed 0.019 (0.026) –0.021 (0.016)
both parents employed –0.006 (0.023) –0.017 (0.014)
father's occupation in SOC 1–3 0.068 (0.014)** –0.040 (0.009)** mother's occupation in SOC 1–3 0.057 (0.015)** –0.019 (0.010) at least one parent with degree 0.127 (0.016)** –0.048 (0.011)** at least one parent with A level 0.062 (0.015)** –0.018 (0.010)
index of local deprivation –0.097 (0.047)* –0.013 (0.029)
Constant –0.266 (0.043) 0.146 (0.027)
24
Table 4: Average Distance and Participation Rates, by GCSE Achievement
YCS
Participation1 Number of
A*-C GCSEs
Sample share (%)
Average distance (km)
Academic study (%)
Vocational study (%)
Non-parti-cipation (%)
0 24 2.2 4 31 54
1–3 19 2.2 12 45 36
4–6 15 2.2 47 36 23
7+ 42 2.4 86 17 6
total/mean 100 2.3 47 28 25
LSYPE
Participation1 Number of
A*-C GCSEs
Sample share (%)
Average distance (km)
Academic study (%)
Vocational study (%)
Non-parti-cipation (%)
0 21 2.1 3 30 58
1–3 17 2.2 11 39 46
4–6 15 2.2 38 31 32
7+ 47 2.4 80 21 9
total/mean 100 2.3 48 27 28
Notes to Table 4
25
Table 5: Multinomial Logit for Participation in Post–Compulsory Education, by Type of Education and Number of GCSEs – YCS
Notes to Table 5
1. Table presents marginal effects (ME) on the probability of participation. 2. Standard errors (SE) in parentheses.
3. * significant at 5%; ** significant at 1%.
4. All control variables shown in Table 3 are also included here.
Academic study Vocational study
Covariates ME (SE) ME (SE)
0 GCSEs at grade A*–C
distance from nearest academic institution in km –0.000 (0.003) 0.012 (0.008) distance from nearest vocational institution in km –0.000 (0.001) –0.003 (0.003)
1–3 GCSEs at grade A*–C
distance from nearest academic institution in km –0.005 (0.005) 0.004 (0.007) distance from nearest vocational institution in km 0.000 (0.002) –0.006 (0.003)
4–6 GCSEs at grade A*–C
distance from nearest academic institution in km –0.021 (0.007)** 0.014 (0.006)* distance from nearest vocational institution in km 0.000 (0.002) 0.000 (0.002)
7+ GCSEs at grade A*–C
26
Table 6: Multinomial Logit for Participation in Post–Compulsory Education, by Type of Education and Parents’ Education, Occupation and Housing Tenure – YCS
Notes to Table 6
1. Table presents marginal effects (ME) on the probability of participation. 2. Standard errors (SE) in parentheses.
3. * significant at 5%; ** significant at 1%.
4. All control variables shown in Table 3 are also included.
Covariates Academic study Vocational study
Panel A: By Parents’ Education ME (SE) ME (SE)
Graduate parents
distance from nearest academic institution in km –0.003 (0.003) 0.002 (0.002) distance from nearest vocational institution in km 0.001 (0.001) –0.001 (0.001)
A level parents
distance from nearest academic institution in km –0.012 (0.006)* 0.008 (0.004)* distance from nearest vocational institution in km 0.001 (0.002) –0.001 (0.002)
Low education parents
distance from nearest academic institution in km –0.025 (0.005)** 0.015 (0.004)** distance from nearest vocational institution in km –0.001 (0.002) –0.001 (0.001)
Panel B: By Parents’ Occupation High-skill occupation parent
distance from nearest academic institution in km –0.009 (0.002)** 0.005 (0.002)** distance from nearest vocational institution in km 0.000 (0.001) –0.000 (0.001)
Low-skill occupation parent
distance from nearest academic institution in km –0.017 (0.004)** 0.011 (0.003)** distance from nearest vocational institution in km –0.001 (0.002) –0.001 (0.001)
Panel C: By Housing Tenure Home owner
distance from nearest academic institution in km –0.013 (0.003)** 0.008 (0.002)** distance from nearest vocational institution in km –0.001 (0.001) 0.000 (0.001)
Council–owned
distance from nearest academic institution in km –0.020 (0.012) 0.008 (0.011) distance from nearest vocational institution in km 0.012 (0.004)* –0.014 (0.005)**
Other renting