This is a repository copy of Precision measurement of the growth rate and mechanism of ibuprofen {001} and {011} as a function of crystallization environment.
White Rose Research Online URL for this paper: http://eprints.whiterose.ac.uk/84721/
Version: Accepted Version
Article:
Nguyen, TTH, Hammond, RB, Roberts, KJ et al. (2 more authors) (2014) Precision
measurement of the growth rate and mechanism of ibuprofen {001} and {011} as a function of crystallization environment. CrystEngComm, 16 (21). 4568 - 4586. ISSN 1466-8033 https://doi.org/10.1039/c4ce00097h
eprints@whiterose.ac.uk https://eprints.whiterose.ac.uk/
Reuse
Unless indicated otherwise, fulltext items are protected by copyright with all rights reserved. The copyright exception in section 29 of the Copyright, Designs and Patents Act 1988 allows the making of a single copy solely for the purpose of non-commercial research or private study within the limits of fair dealing. The publisher or other rights-holder may allow further reproduction and re-use of this version - refer to the White Rose Research Online record for this item. Where records identify the publisher as the copyright holder, users can verify any specific terms of use on the publisher’s website.
Takedown
If you consider content in White Rose Research Online to be in breach of UK law, please notify us by
1
Precision measurement of the growth rate and mechanism of ibuprofen {001}
and {011} as a function of crystallization environment
T. T. H. Nguyen, R. B. Hammond, K. J. Roberts*
Institute of Particle Science and Engineering, Institute of Process Research and Development,
School of Process, Environmental and Materials Engineering, University of Leeds, Leeds, LS2
9JT, Leeds
I. Marziano, G. Nichols
Pfizer Worldwide Research and Development, Sandwich, CT13 9NJ, UK (*) Corresponding author’s email: K.J.Roberts@leeds.ac.uk
Abstract
The crystallisation of ibuprofen under diffusion-limited conditions measured as a function of
supersaturation, solvent (95% ethanol/water, ethyl acetate, acetonitrile and toluene) and reactor
scale is examined. Measurement of solubility as a function of temperature reveals less than ideal
behaviour, consistent with strong solute-solute interactions, particularly in the case of
acetonitrile. The crystal growth rates of the {001
}
and {011} faces of spontaneously nucleatedcrystals are precisely measured in-situ using optical microscopy revealing that their respective
growth rates increase with increasing supersaturation to different extents, depending on the
solvent type, with concomitant impact on the crystal habit. The measured aspect ratios, as a
function of supersaturation, are generally higher at the 15 mL than the 0.5 mL scale size.
Analysis of the growth rates versus supersaturation is consistent with a 2-D surface nucleation
(Birth and Spread) model for both faces and at both scale sizes. The growth rates of the {001}
and {011} faces exhibit much less growth rate dispersion when compared to literature data for a
2
The data is rationalized by examining the surface chemistry of the growing faces revealing, e.g.
that polar protic solvents inhibit the growth rate of faces containing available binding sites for
hydrogen bonding formation, such as carboxylic acid groups.
Key words: Crystallisation, ibuprofen crystals, growth rate measurements, optical microscopy,
image analysis, crystal morphology, solvent induced habit modification, re-entrant
morphological features, science of scale, interfacial kinetics characterisation, growth rate
3
1
Introduction
Crystallisation is an important purification, separation and pre-formulation process in the
pharmaceutical and fine chemical process industries. It is the primary method applied for the
intermediate and final stage production of a wide range of materials from inorganic compounds
to high value-added organic materials such as active pharmaceutical compounds and specialty
chemicals. However, the anisotropic nature of a crystalline material combined with the complex
molecular and crystal chemistry of many specialty compounds can conspire to produce a high
degree of variability in the physical properties of crystalline products. This can, in turn, lead to
significant changes in product quality, i.e. impacting upon stability, bioavailability,
processability, crystallinity and/or purity. In order to isolate the crystals which exhibit the desired
physical properties, the fundamental process of crystal growth and its associated kinetics need to
be understood, characterised and controlled. Previous studies in this area have mostly presented
measurements of growth rates of single crystal seeds grown at comparatively low
supersaturations [1-6]. Alternatively, measurements have been made of the growth rate of a
population of crystals as prepared under crystallisation reactor environment conditions e.g.
through the measurement of the characteristic dimensions (such as length, width, and equivalent
diameter etc.) associated with the growth of the crystals [7-14]. Linking these two, quite
distinctive, sets of measurements is a challenge mindful of the quite different hydrodynamic
environments involved. For example in the former case whilst measurements are made on the
individual growth faces, the influence imposed either by the hydrodynamic environment
associated with the measurements or by the selection of the specific seeds [15] for the studies is
not really defined. Similarity, in the latter case, it is hard to extract out the kinetics associated
4
surprisingly limited kinetic studies on the growth of the individual faces of
spontaneously-nucleated crystals as prepared under diffusion-limited growth conditions in stagnant solutions.
Such measurements are helpful in that they provide baseline crystal growth kinetic data from
which the impact of e.g. agitation and mixing can be subsequently assessed. Additionally, few
detailed studies of the growth rates of single crystals have been published which focused on
growth-rate dispersion [16-18] particularly those which highlight variability of the growth rate of
individual crystals within a population. A significant factor in the scarcity of research resulting
from investigations into the growth rates of single crystal growth perhaps lies in the lack of rapid
and routine experimental methodologies for studying these aspects. This, perhaps, reflects the
fact that the most common techniques available for crystallisation monitoring are intended for
use at the larger scales and are aimed at measuring what is defined as the crystal size distribution.
In such cases size is usually represented by an average values for growth rates based on an
assessment of a crystal population e.g. using focused beam reflectance measurements (FBRM)
[19-21], rather than face-specific growth rates as measured for batches of individual crystals. For
example, most of commercial particle size instruments calculate the crystal ‘size’ in terms of a
volume equivalent diameter (Dvolume) where:
D V (1)
Providing equant particles are being measured this is a reasonable charactersisation of particle
size but for crystals exhibiting anisotropic morphologies, the results can be confusing (see Figure
5
(a) (b) (c) (d)
Figure 1 Schematic diagram showing hypothetical particles with different shapes whilst still having the
same volume equivalent diameter highlighting the importance of measuring shape-dependant crystal
growth ratesμ (a) 100 m diameter sphere which has the same volume as (b) cube (with the size of an edge
= 80.6 m), (c) a rectangular needle (β0 m x β5 m x 1047 m) and (d) a very thin plate (β00 m x β6β
m x 10 m).
A fundamental evaluation of the growth kinetics must be based on the growth rates of individual
faces [22] for which a detailed understanding of the crystal shape is a crucial factor in growth
rate determination.
The above scenario is addressed in this study through the measurement of the growth rates of the
individual crystal faces of the pharmaceutical compound ibuprofen as a function of its solution
crystallisation environment from which the likely interfacial crystal growth mechanisms
involved were characterised.
RS-ibuprofen (2-(4-isobutyl-phenyl) propionic acid), C13H18O2 M = 206.28g/mol, melting point
(77-78oC) is a non-steroidal anti-inflammatory drug (NSAID) that has been used to relieve pain,
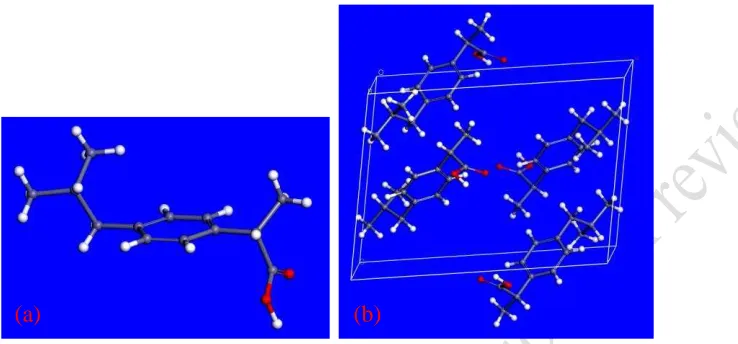
cold, fever and inflammation. This material crystallizes in a monoclinic crystal structure with
space group P21/c in a tetramolecular unit cell with unit cell dimensions a = 14.667Å, b = 7.886 Å, c = 10.7γ0 Å, = λλ.γ6β8o
, Z = 4 [23, 24]. The crystal packing manifests centrosymmetric
hydrogen-bonded dimers [23] (Figure 2). Dudognon, et al. [25] have shown an evidence for a
new crystalline form of racemic ibuprofen as prepared under quite extreme conditions, i.e. at
6
structure for this form has not yet been published. Crystal of the known structure of ibuprofen to
exhibit [26, 27] three dominant crystal habit faces; {100}, {001} and {011} and the crystals of
racemic ibuprofen exhibit different crystal habits as a result of varying the crystallisation
conditions. This material mostly has a plate-like crystal morphology dominated by a large {100}
face with smaller {001} and {011} side faces. Despite the fact that changes in crystal habit have
been reported many times [2, 26, 28-34], detailed studies of growth kinetics for this material
have been surprisingly limited. Rashid, et al. [11] studied growth rates of ibuprofen crystals
grown from ethanol by adding size proportional growth (SPG) seed crystals to an isothermal
non-nucleating batch crystallization vessel and sampling the resultant crystals during the batch.
They found that ibuprofen crystallising from ethanol exhibits significant growth rate dispersion.
This phenomenon refers to the fact that the growth rates of crystals of the same material and size,
when exposed to identical conditions of supersaturation, temperature and fluid dynamics, do not
subsequently grow at the same rate [17, 35, 36]. Cano, et al. [2] measured the growth rates of the
{100}, {001} and {011} faces in a single ibuprofen crystal using a crystal-growth flow cell.
During these measurements, a crystal was secured within the cell with the crystal faces of the
seed crystal being oriented with respect to the solution flow in order to obtain reproducible
growth conditions at relative supersaturation ( ) of 0.013. However, this work did not provide
information on the growth rates for spontaneously nucleated crystals nor were the variations in
the crystal growth rates between different crystals studied. Reflecting this, this paper reports the
measurement of the solution solubilities and crystal growth rates of the associated {001} and
{011} surfaces of self-nucleated single (RS)-ibuprofen crystals in stagnant solutions at two scale
7
toluene) and relative supersaturation from 0.55 to 1.γ. From this, the interfacial growth
[image:8.612.143.512.125.297.2]mechanisms of these faces with this range of supersaturation were characterised.
Figure 2 Molecular diagram showing (a) molecular structure and (b) intremolecular packing in the
crystallographic unit cell ibuprofen molecule
2
Crystal growth rates and kinetics
2.1
Growth rate expressions
There is broad agreement in the literature that there are three main methods [37] to express the
crystal growth rate:
2.1.1 Face growth rate
Face growth rate vhkl (m/s) is the velocity of movement forward of the crystallographic faces in a
direction perpendicular to a face (hkl), which can be measured on individual crystal faces over
time using a microscope thus:
R (2)
where L is the distance of movement forward of a crystal surface (hkl) in a period of time t
Growth rates expressed in this way can be related to the different interfacial crystal growth
mechanisms and models.
8 2.1.2 Overall mass growth rate
Overall mass growth rate, RG (kg/m2s), is expressed for the average growth rate of whole
population of crystals and has often been used for calculating product yields and for design
purposes for optimizing batch crystallisation processes;
(3)
where Mc is the mass of crystal; AC is the surface area of whole crystal; and Ahkl is the area of face hkl, vhkl is the face growth rate and Ahkl is the area of the faces on a crystal
2.1.3 Overall linear growth rate
Overall linear growth rate, G, (m/s or m/s), is the rate of change of the crystal’s characteristic
dimension, L, has dimensions of velocity, which depends on the specific characteristic
dimension used in the definition:
G = dL/dt
(4)
G and RG can be related as follows:
G dt dL dt L d L dt dM A
R C c c c
C G 3 3 ) ( . 1 * 1 3
2
(5)
(6)
(7)
where is the density of crystals, is the volume shape factor and is the crystal surface shape factor. If crystals are spherical or cubic then / = 6
RG C.G 2 1
9
It is important to define this dimension when using this expression. L is often defined with
respect to the technique used in its measurement.
The latter expression is commonly applied within population balance theory models which
relates the crystal size distribution (CSD) to the crystallisation kinetics [38] thus:
(9)
where n is the population density per unit volume, V is the total suspension volume of the
crystallizer, G is the linear growth rate, L is the crystal size and t is the time
Whilst the population balance model is helpful in defining crystallisation kinetics, it relies on
empirical parameters for the characteristic size. Recently, 2D [8, 13, 14, 39, 40] and
morphologically based [41-43] population balance models have been developed. The latter case
offers a significant improvement in that the multi-dimensional characteristic lengths are defined with respect to the growth rates of the individual crystal habit faces. This provides a more ‘first
-principle’ model and one, in particular, that takes into account the morphology of the growing
crystal. The utility of incorporating morphological data into measurements of the characteristic
length of crystals has been demonstrated by Penchev [44] who used morphological analysis to
decompose crystal size data of L-glutamic acid obtained in-situ using ultrasonic spectroscopy
into a sub-set of characteristic lengths based on the measurements of the three growth forms
(001), (111) and (011) for which their individual interface kinetic mechanisms were determined.
Nowadays, in-process data mostly uses FBRM instrumentation [19-21] which measures only the chord length distribution which can be challenging to extract ‘first-principles’ face-specific
10
Measurements of the growth rates of crystal populations, usually involve seeding within the
metastable zone. However, the process can itself provide variability in the measured growth rates
[46-48] depending on the seed preparation techniques adopted and/or the size fraction selected
and/or the seed concentration. The latter reflects the impact of these variables on the secondary
nucleation process highlighting the value of having base-line face-specific growth rate studies on
spontaneously nucleated crystal prepared under diffusion-controlled conditions.
It is well-known that crystals of the same material and size, when exposed to seemingly identical
crystallisation conditions, do not always grow at the same rate; a phenomenon known as growth
rate dispersion (GRD) [18, 35, 36, 49]. Whilst size dependent growth (SDG) [50] relates to
crystals of different sizes growing at different rates, GRD is a phenomenon where similar sized
crystals grow at different rates under apparently identical conditions of supersaturation,
temperature and hydrodynamics. Variations of growth rate of the uniform sized crystals affects
the CSD of the product crystals and hence the product quality. The studies of the physical
mechanisms underlying of GRD have resulted in the development of three models which
provide a basis for further analysis of experimental data: the constant crystal growth model
(CCG) [49]; the random fluctuation model (RF) [51]; and the ‘fast-growers’, ‘slow-growers’
model (FGSG) [52].
2.2
Crystal growth rate measurement techniques
There have been various techniques for in-situ crystallisation process monitoring and for
measurement of the crystal growth rates. However, different systems and applications require the
use of different methods. For example, transmission light optical microscopy is often used for the
11
contrast or interferometric incident light microscopies are usually used for measuring step
velocities, particularly in cases where the step height and spacing is small. Optical microscopy
techniques together with a video imaging and image analysis software have also been used to
derive growth rate data [2-5, 35, 53].
This approach has been enhanced through the use of stroboscopic techniques together with
computational methods for analysis of crystallisation processes within agitated batch vessels
[7-10]. High speed imaging processes has also been used to capture high resolution images on-line
and perform real-time, in situ particle analysis [10, 13, 14, 54]. Other methods reported for
growth rate determination include atomic force microscopy (AFM) [55-59], Michelson
interferometry [60-64] and laser polarization-interference techniques [65].
2.3
Assessment of the interfacial growth mechanism for growth rate data
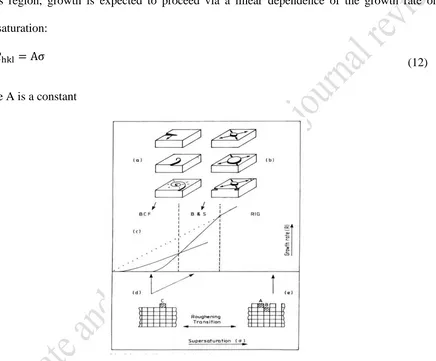
The growth rate of a crystal face is dependent on its underlying growth mechanism [66], which,in turn, is governed by the nature of the molecular attachment of solute molecules onto the
growing crystal surface [67]. There are three generally accepted mechanisms for crystal growth
each of which reflects on a particular range of supersaturation (Figure 3).
2.3.1 Screw dislocation (BCF) mechanism
According to the BCF mechanism (Burton, Cabrera and Frank) [68], at low supersaturation, the
crystal growth process occurs via 2-dimemsional diffusion of solute molecules over the crystal
surface. The incorporation of growth units onto the stepped surface provided by protrusion of
dislocations leads to the formation of a growth spiral over the crystal surface creating a
12
of growth units onto the surface hence facilitating its subsequent growth and development. The
resulting growth rate expression is given by:
2tanh( )
B
A
Rhkl (10)
where is relative supersaturation and A and B are complex temperature-dependent constants.
2.3.2 Birth and Spread mechanism (B&S)
In the absence of a permanent source of surface steps, the growth rate is limited by 2D nucleation
through the B&S mechanism [69, 70]. In this, at higher supersaturation nucleation can occur
without the need for the existence of the edge and kink sites provided in the BCF mechanism
and this can take place anywhere on the crystal surfaces. Surfaces growing with this mechanism
develop through the nucleation (birth) and growth (spread) a monolayer. After nucleation, further
molecules can absorb and integrate into the existing monolayer thus enabling it to spread over
the surface followed, in turn, by further 2D nucleation events when the surface layer has fully
spread over the surface. In this mechanism, the relationship between the face growth velocity and
supersaturation can be expressed through a largely exponential dependence on supersaturation:
15/6exp(2) A A
Rhkl (11)
Where A1 and A2 are system-specific constants
2.3.3 Continuous growth (rough interfacial growth) model:
At high supersaturation, the growth interface undergoes surface roughening providing through
this abundant sites for surface integration with a lot more step and kink sites thus resulting in a
much higher growth rate [71]. Within this region, the energetics of growth unit attachments are
13
the loss of a coherent set of surface terraces and well-defined crystal habit planes for growth. In
extreme cases this can lead to the formation of a hopper [72] or dendritic [73] crystal forms.
Multi-nucleation can also take place within the same spatial region resulting in formation of
intergrowths, inter-crystal aggregates as well as twining [74] and spherulitic [73] growth forms.
In this region, growth is expected to proceed via a linear dependence of the growth rate on
supersaturation:
A
(12)
Where A is a constant
Figure 3 Schematic diagram illustrating the different crystal growth rate mechanism place at the
crystal/solution interface, involving BCF (a) B&S (b) together with the expected correlation of these
crystal growth mechanisms as a function of solution supersaturation (c) and the transition between stable
growth on smooth surface to unstable growth at the roughened crystal/solution interface ((d) and (e)).
[image:14.612.101.537.189.550.2]14
For a given material, crystal symmetry may give rise to different surface chemistry for each of
the unique crystal forms. This can, in turn, lead to different surface bonding configurations being
associated with the growth process for the different habit faces. Hence, the interfacial growth
kinetics mechanism prevalent for a given crystal face may not be the same as that involved on
another surface. In addition, the supersaturation dependence of the growth rate can also be
expected differ between one crystallographically unique plane and another. Thus, full control
over the particle properties resulting from a crystallisation process ideality requires the
measurement of full kinetic data for each of the dominant crystal habit faces.
3
Materials and methods
3.1
Materials
Ibuprofen (melting point 75-77oC, purity ≥ λ8%) was obtained from Sigma Aldrich and Tokyo
Chemical Industry UK Ltd. The solvents used were: 95% ethanol/water (the azeotropic
composition of a binary mixture of ethanol and water) from Sigma Aldrich, ethyl acetate 99.5%
Acros Organics, acetonitrile 99.9% from LC-MS and anhydrous toluene 99.8% from
Sigma-Aldrich.
3.2
Experimental apparatus details
3.2.1 Solubility determination
An attenuated total reflection (ATR) UV/Vis spectroscopy system comprising a Varian Cary 50
spectrophotometer equipped with a 6.35mm diameter sapphire crystal titanium sheathed ATR
probe from Hellma Analytics (http://www.hellma-analytics.com/) was employed for solubility
determinations of solutions of ibuprofen in all solvents except toluene where gravimetric
methods were used. The UV/Vis spectrophotometer operated over the wavelength range from
15
solubility solutions) where standard transmission probes cannot be used. This measurement
approach had further advantages that: it involved no sampling; the solutions did need not be
diluted; it was applicable for the measurement of high-solids content slurries on-line; and it was
easy to set up with a flexible fiber-optics connection to the probe.
Unfortunately the UV/Vis depth of penetration for the ATR probe for the toluene system at the
critical angle increases to infinity at 319 nm [76] and hence this technique could not be used for
ibuprofen solubility measurements in toluene. In this case, the solubility was determined using
gravimetric methods.
3.2.2 Growth rate measurements
[image:16.612.76.515.267.589.2]
Figure 4 Crystallization system set up for measurement of crystal growth rate in a small scale cuvette
0.5ml (above) and in a larger scale jacketed-vessel15ml (below)
The growth rates for the {001} and {001} habit planes for individual single crystals as function
16
0.5ml and 15ml. The crystallization setup employed for this comprises an inverted optical
polarizing microscope (Olympus Optical IMT-2 or Leica/ Leitz DM IL 090-131-002) integrated
with a CCD Lumenera Infinity 3.3 megapixel camera, a PC with image capture and image
analyze software (http://www.lumenera.com/products/microscopy-cameras/index.php) to capture
crystal images during the growth process. The crystallisation vessels (Figure 4) comprised of:
A UV cuvette cell 0.5ml (54 x 10 x 1 mm) submerged in a shallow tank of water whose
temperature was controlled by a Haake F3 recirculation bath.
A 15ml jacketed vessel (34 (mm) ID diameter x 17(mm) height), with flat optical glass
dics at the top and the bottom connected to a Huber ministat chiller. The jacketed vessel
was equipped with an ATR UV/Vis spectrometer immersion probe to monitor the
solution concentration and hence the level of supersaturation during crystallisation.
3.3
Experimental techniques
3.3.1 Solubility measurements
A set of saturated solutions with excess, suspended solids of (RS)-ibuprofen in various solvents
were prepared in 20ml vials and put in a shaker unit (MaxQ 2000 Barnstead/Lab-line)
maintained at constant temperature using a Julabo F25 re-circulating bath. The vials were
agitated for 24 hours then allowed to settle for 6 hours to ensure all solids were separated from
the saturated solvent. The saturated solutions were separated from solid phase for solubility
measurement.
(a) ATR UV-Vis spectroscopy method: Calibration curves were obtained by scanning a series
of known concentrations of ibuprofen in solvents over the wavelength range from 300 to
250nm. Solutions of ibuprofen of known solute concentration were analyzed by UV-Vis
17
corresponding to the electron transition associated with the benzene ring. Saturated
solutions at different temperatures were also scanned to obtain absorbances and hence the
solubility of ibuprofen at various temperatures was determined from the calibration curve.
(b) Gravimetric method: One gram of saturated solution at different temperatures 15oC, 20oC,
25oC, 30oC, 35oC was withdrawn and transferred to vials, the solvents were then allowed to
evaporate at room temperature for approximately one week until the remaining mass of
solid-material was constant with time and then the solubility, expressed in gram of
solutes/gram of solvent, was calculated by the equation (g/gsolvent):
s (13)
3.3.2 Thermal analysis measurements
DSC data was measured using a Mettler DSC 820 differential scanning calorimeter. Each sample
was heated from 25 to 85°C at 5oC/min in aluminum pans under nitrogen atmosphere. The onsets
of the melting points and enthalpies of fusion obtained from the integration of the corresponding
exothermic peaks were determined using STARe software.
3.3.3 Growth rate measurements {001} and {011} faces
RS-ibuprofen solutions were prepared by dissolving solute in ethanol 95% (1.4g/ml), ethyl
acetate (1g/ml), acetonitrile (0.4g/ml) and toluene (1g/g). For the 0.5ml scale, a pipette was used
to transfer the prepared solution into the cuvette cell which was sealed and fixed to the bottom of
the water tank. For the 15ml scale, the prepared solution was transferred into the vessel.
The ibuprofen/solvent solutions were heated to 50oC to completely dissolve all ibuprofen crystals,
then the solutions were cooled down to a constant temperature such as 20, 23, 25 and 27oC to
18
spectroscopy and the system was monitored until crystals were found to appear. Image analyze
software was used to capture a temporal sequence of images of the crystals as they developed.
3.4
Data analysis
3.4.1 Solubility
The ideal solubility of a crystalline material in a solvent was calculated by:
T T R H X
fus fus 1 1 ln
(14)
where X is mole fraction of the ideal solubility of the solute; Hfus is molar enthalpy of fusion of
the pure solute; Tm is melting point (K); T is the solution temperature (K). The assumption was
made that the heat capacity difference between the melt and the solid state, both at solution
temperature, were independent of temperature and negligible.
From the experimental determination of the solubility data for ibuprofen in solvents, the enthalpy
and entropy of dissolution were calculated using the van’t Hoff equation:
R S RT
H
X diss diss
ln (15)
where X is the mole fraction of solute in solution and ∆Hdiss and ∆Sdiss are the enthalpy and
entropy of dissolution, respectively;
According to Raoult’s law, the activity coefficient of the solute in the saturated solution, , is
defined as the ratio of the ideal and the experimentally measured solubilities at a given
temperature:
a x
19
where a is the activity of the solute i in the saturated solution and x denotes the mole fraction
experimental solubility. For an ideal solution, a x .
The calculated activity coefficients ( ) were fitted with respect to its variation with temperature
by:
ln = aT + b (17)
3.4.2 Crystal growth rate determinations
The growth rates of the {110} and {011} faces were measured using two different methods as
shown in Figure 5whereby measurements are made of the:
Length of a line from the centre of the crystal and perpendicular to the projection of the
crystal edges for (001) or (00-1) & (011) or (0-11) or (01-1) or (0-1-1) faces (assuming
crystals are symmetric).
Separation distance between two opposite parallel faces of crystals which is then divided
[image:20.612.43.536.281.663.2]by two.
Figure 5 Image of crystal with overlaid annotations highlighting the methodology for the measurement of
growth rate of the individual faces
(100)
(001)
(011) (0-11) (0-1-1)
20
Due to that fact that ‘as grown crystals’ tend not always to be symmetric, the second method can
be a more accurate and is also easier to use than the first one. Assuming the crystal is lying flat
on one of its dominant {100} faces, the in-plane measurements were geometrically corrected
with the aid of the program MORANG [78] to allow for the tilt of the {001} and {011} planes
(80.64o and 84.42orespectively) with respect to the sample’s {100} habit plane. The growth rates
of the individual crystal faces were determined by capturing images at chosen time-intervals
(typically from 1-10 minutes, depending on the magnitude of the growth rate concerned). The
growth normal distance from the center of the crystals to the faces as a function of time was
calculated. The growth normal projection with time was found to be linear reflecting only a
slight depletion of the solute concentration. This was used to assess the individual growth rates
as a function of habit plane. Mean growth rates, together with their standard deviations, were
calculated from the samples measured, typically between five to eight crystals under similar
conditions. The linear growth rate of individual crystal surfaces was estimated from the increase
of the distance from center to the face during each time interval. The coefficient of variation
(CVV) for the growth rate of each crystal face in each solvent and two scale-sizes was calculated
by:
(18)
where SD is the standard deviation and R is the mean growth rate of the crystal faces for single
crystals or the mean size of volume based distribution for a population of crystals in agitated
21
3.4.3 Growth mechanism
The growth mechanism was investigated through the use of user-defined fitting function using
the two appropriate growth kinetic models, Birth and Spread (equation 4) and BCF (equation 5)
expected for facetted growth and the results compared to evaluate which model gave the better
fit. The data fitting was carried out using the nonlinear curve-fitting options in Origin [79]. The
quality of regression can be measured by the coefficient of determination R2. In this, if the
adjusted R-square were found to be close to 1, the relationship between supersaturation and
mean growth rate was regarded as being very strong, i.e. showing a high degree of confidence in
the regression model. In contrast, when adjusted R2 is negative this implies that the data fit to the
model is poor [79].
3.4.4 Surface chemistry analysis
Molecular scale models of the crystal surfaces were simulated using Accelrys Material Studio
[80]. From this, the changes in the measured crystal growth rates for the {001} and {011}
surfaces with growth environment were rationalised through surface chemistry analysis, through
which the characteristics of these surfaces (e.g. hydrophobicity, polarity or hydrogen-bonding
propensity) were examined and the relative binding interactions between solvent and solute and
the associated inter-molecular interaction involved on specific growing faces were analyzed.
4
Results and discussion
4.1
Solubility and solution behaviour
Full details of UV Vis calibration method and the gravimetric studies are given in section S1
within the supplementary materials.
The onset of melting point temperature and heat of fusion ( Hfus) were found to be 75.25oC and
22
and toluene solvents in both conventional and van’t Hoff coordinates together with the ideal
solubility relationship are given in Figure 6. These data are summarised in table 1.
Figure 6 Solubility of ibuprofen in ethanol 95% (blue), ethyl acetate (red), acetonitrile (green) and
toluene (purple) at temperatures from 15-35°C (a) together with plots of 1/T versus lnX of the ideal
[image:23.612.77.532.154.351.2]solubility (the dotted line) and the real solubility (solid lines) of ibuprofen in the same solvents (b)
Table 1 Enthalpy of dissolution, ∆H, and entropy of dissolution, ∆S, of ibuprofen in ethanol, ethyl acetate,
acetonitrile and toluene together with calculated activity coefficient and temperature dependence fitting
parameter. Logarithm of activity coefficients of ibuprofen in solvents as a function of saturated
temperature (equation 11)
Solvents Ethanol 95% Ethyl acetate Acetonitrile Toluene Dipole moment
Solubility (mg/g) 20oC 25oC 30oC 35oC ∆H (KJ/mol) ∆S (KJ/K-1mol-1)
(T = 15-35oC) a b 1.69 822.8 987.3 1240.5 1594.9 25.23 0.07 1.35-1.44 -0.002 0.3897 1.78 502 658 803 1047.9 26.16 0.075 1.04-1.09 -0.0008 0.077 3.92 152.7 254.5 356.2 508.9 53.76 0.154 3.57-7.60 -0.0398 2.6482 0.36 460.0 588.7 751.5 941.0 27.6 0.08 1.14-1.24 -0.0045 0.2837 0 0.25 0.5 0.75 1 1.25
10 15 20 25 30 35
S olu b il ity (g/m l)
T (oC)
(a) -4 -3 -2 -1 0
0.0032 0.0033 0.0034 0.0035
ln
X
1/T
23
The measured solubility and calculated activity coefficients determined in this study were found
to be consistent with literature data [26, 81, 82] (see Figure 7). The solubility of ibuprofen is
relatively high in ethanol, ethyl acetate and toluene and much lower in acetonitrile which can be
rationalized by the polarity that ‘like dissolves like’. A non-polar compound will be most likely
to be dissolved by non-polar solvents and vice versa. The solvent polarity can be assessed
through its dipole moment. Ibuprofen is an organic compound with medium polarity due to
containing both polar (-COOH group) and non-polar (benzene ring and substituted group -C2H6
attached to benzene ring) functional groups. While the dipole moment of ethanol, ethyl acetate
and toluene is lower than that of acetonitrile (shown in Table 1), ibuprofen has a high solubility
in ethanol, ethyl acetate and toluene but a much lower solubility in acetonitrile. Consequently,
the activity coefficient of ibuprofen in acetonitrile (3.57 -7.69) is higher than that in ethanol,
ethyl acetate and toluene (1.04 – 1.35). In acetonitrile, where values are much greater than 1.0,
the solution behavior becomes closer to ideality as the temperature increases. The high values of in acetonitrile reflect the stronger solute-solute interactions and concomitantly weaker
interactions between the ibuprofen and acetonitrile molecules. In contrast, the almost ideal values of in ethyl acetate, ethanol and toluene are consistent with much stronger solute/solvent
interactions reflecting the more equality of interaction strengths between constituent molecules
24
Figure 7 Comparison of the measured solubility in this study and from literature
4.2
Growth rates of {001} and {011} as a function of growth environment
A full set of the experimental growth rate data provided in this paper is given in the section S2 ofthe supplementary materials.
The data comprises a total of 125 single ibuprofen crystals, spontaneously nucleated in 120-130
growth runs measured in 95% ethanol/water, ethyl acetate, acetonitrile and toluene over a
supersaturation range from 0.54 to 1.31 at 2 scale sizes 0.5 and 15 mL.
A sequence of images of crystals grown in various solvents in the in-situ 0.5mL crystallization
cell is shown in Figure 8. An example of the plot the distance from the center of the crystals
along the growth normal as measured for 5 crystals in the 15ml growth cell to the faces as a
function of time (Figure 9) together with the ATR UV/Vis spectra of ibuprofen in 95%
ethanol/water during crystallization in the 15mL jacketed vessel is given in Figure 10 and the
mean growth rates for the {001} and {011} faces are summarised in Table 2. 0
0.2 0.4 0.6 0.8 1 1.2 1.4 1.6
10 15 20 25 30 35
S
olu
b
il
ity(
g/gso
lvent)
Temperature (oC)
Ethanol 95%: This study
Absolute ethanol: G&R (2002)
Absolute ethanol: Rashid (2008)
Ethyl acetate: This study
Ethyl acetate: G&R (2002)
Toluene: This study
Toluene: G&R (2002)
Acetonitrile: This study
25 (a) (b)
[image:26.612.70.566.105.560.2](c) (d)
Figure 8 Series of optical micrographs of ibuprofen crystals grown in ethanol 95% between = 1.17 and
= 0.66 (a), in ethyl acetate between = 1.β0 and = 0.6λ (b), in acetonitrile between = 1.1β and =
0.79 (c) and in toluene between = 1.17 and = 0.70 (d) at the 0.5ml scale size showing the growth of
26
Figure 9 An example of plot of the distance from the center of the crystals along the growth as measured
for 5 crystals in the 15ml growth cell to the faces as a function of time. The slope of the line gives the
measured growth rate of the face for the estimation of the growth rate for the {011} and {001} face. Each
line presents for the growth rate of individual crystals over time: (a) the {011} face in ethanol at = 0.66
[image:27.612.80.535.418.641.2]and (b) the {001} face in ethanol at = 0.66
Figure 10 An example of ATR UV/Vis spectra of ibuprofen in ethanol 95% during crystallization in the
15mL jacketed vessel as obtained every minute over the period of 30 mins (a); Solute concentration (blue)
and relative supersaturation (red) calculated from the UV-Vis absorbance calibration model (b) 0 200 400 600 800 1000
0 5 10 15 20 25
Distance f rom c en te r to fac e ( m) Time (mins) (a) 0 100 200 300 400
0 5 10 15 20 25
Distance f rom c en te r fac e ( m) Time (mins) (b) 0 0.02 0.04 0.06 0.08 0.1 0.12
250 260 270 280 290
A bsorbance Wavelength (nm) (a) 0 0.2 0.4 0.6 0.8 1 1.2 1.4 1.6
0 10 20 30
27
Table 2 Mean growth rates of {011} and {001} faces of ibuprofen in ethanol 95%, ethyl acetate and
acetonitrile and toluene in the 0.5ml cell and jacketed-vessel 15ml
Choice of solvents
S-1( ) Number of crystals
Mean Growth Rate R( m/min)
R{001} R{011}
0.5ml scale 15ml scale 0.5ml scale 15ml scale Ethanol 95% 0.66 0.79 0.89 0.97 1.17 5 8 5 5 5
3.6 ± 0.7 4.6 ± 0.4 6.2 ± 0.8 8.0 ± 0.9 13.2 ± 1.6
3.8 ± 0.5 5.6 ± 1.0 7.2 ± 0.8 8.9 ± 0.4 13.2 ± 0.7
8.5 ± 2.1 11.8 ± 1.1 14.3 ± 1.5 16.6 ± 1.7 21.6 ± 1.3
11.1 ± 0.8 14.9 ± 1.4 16.9 ± 0.9 18.4 ± 1.1 24.6 ± 4.1 Ethyl acetate 0.54 0.69 0.76 0.85 0.97 1.06 1.20 6 5 6 7 7 7 7
1.8 ± 0.3 3.4 ± 0.4 4.4 ± 0.6 6.3 ± 0.4 8.3 ± 0.8 9.7 ± 0.8 12.2 ± 2.6
1.9 ± 0.3 3.9 ± 0.9 5.8 ± 0.4 6.6 ± 0.7 10.1 ± 0.8 12.6 ± 0.5 13.8 ± 1.2
17.7 ± 2.0 31.6 ± 1.8 37.5 ± 3.1 42.5 ± 3.2 48.9 ± 3.7 52.1 ± 6.6 61.3 ± 7.7
19.1 ± 3.7 36.5 ± 3.0 41.7 ± 4.1 47.1 ± 2.1 53.0 ± 2.2 58.6 ± 3.3 65.4 ± 3.7 Acetonitrile 0.79
0.93 1.03 1.12 1.31 6 5 6 6 6
3.6 ± 0.7 5.0 ± 0.3 7.4 ± 2.0 10.7 ± 2.0 14.6 ± 2.6
4.8 ± 1.0 5.8 ± 0.3 9.3 ± 0.6 12.7 ± 1.4 16.9 ± 1.4
51.5 ± 5.2 60.0 ± 6.7 79.9 ±11.5 90.0 ± 11.7 112 ± 12.5
56.3 ± 5.0 72.9 ± 3.5 85.4 ± 7.9 104.9 ± 8.8 121.4 ± 12.6
Toluene 0.7 0.78 0.86 1.17 6 5 6 6
1.8 ± 0.2 2.1 ± 0.2 3.2 ± 0.6 4.4 ± 1.7
2.4 ± 0.5 2.8 ± 0.5 3.5 ± 0.8 5.0 ± 0.4
27.8 ± 1.8 30.5 ± 2.6 34.1 ± 4.2 40.2 ± 5.1
32.0 ± 2.3 33.6 ± 4.4 38.7 ± 3.1 43.8 ± 2.4
The growth rate of the {011} and {001} faces of ibuprofen in ethanol in this study was compared
to previous kinetic studies on organic materials (Table 3) and also to previous work on ibuprofen
by Rashid et al [11] (Table 4). In the latter case the kinetic data was modelled using an empirical
rate equation:
G = kG n (19)
28 In this the fitting revealed that kG = 15 and n = 1.
Table 3 Comparison of the mean growth rates with the growth rate calculated from Rashid [11]
Supersaturation This study Data after Rashid [11]
Face {001} Face {011}
0.66 3.6 - 3.8 8.5 - 11.1 9.9
0.79 4.6 – 5.6 11.8-11.9 11.85
0.89 6.2 – 7.2 14.3 – 16.9 13.35
0.97 8.9 - 8.9 16.6 - 18.4 14.55
1.17 13.2 21.6 - 24.6 17.55
Table 4 The growth rate of some organic materials from literature
Compounds T (oC) Mean growth
rate ( m/min)
References
Tripalmitin (melt) 47 – 52 12 – 27 Staple, A.G. F et al. [12]
Paracetamol in 60% methanol and 40% water
0.25 18 O’Ciardha et al.[48]
L-Glutamic Acid 0.47- 0.5 RL: 1.5 – 1.9 RW: 0.3 – 0.36
Wang, X. Z. et al. [13]
Paracetamolin the [110], [010] and [001] direction
0.06 -0.26 1.2 – 9.6 Finnie, S. D. et al. [83]
* RLand RW : Growth rate for length and width of needle-like crystals
The mean growth rates (R) of the {001} and {011} faces increase quite significantly with
increasing relative supersaturation. R{001} and R{011} are responsible for defining the in-plane
shape of the crystals. For all the solvents studied, R{011} was found to be greater than R{001},
in particular for crystals grown in ethyl acetate, acetonitrile and toluene. This anisotropy results
29
acetonitrile and toluene solutions (see Figure 12). No significant differences were observed
between the two scale sizes. Considering the four solvents together, for solutions at the same
supersaturation level, R{011} in acetonitrile was found to be the highest and R{011} in ethanol
the lowest. R{001} of ibuprofen crystals in ethanol and ethyl acetate were found to be fairly
similar and R{001} in acetonitrile lower. R{011} in acetonitrile was found to increase much
more with increasing supersaturation when compared to other solvents. The rate of change of
growth rate with changing supersaturation (dR/d ) for the {001} and {011} faces in the four
solvents was not found to follow a linear relationship. Specifically, in ethyl acetate the gradients
of R{011} with supersaturation (dR{011} /d ) for > 0.76 were found to be lower than those
measured for ≤ 0.76. At <0.76 dR{011} /d is 90.4 and dR{001} /d is 11.6 but at > 0.76 dR{011} /d is 50.7 and dR{001} /d is 17.4.
At the 15ml scale, R{001} and R{011} were found to be greater than that found for the
measurements at 0.5ml. According to Noyes and Whitney [84], the driving force for crystal
growth is the difference between the concentration in the bulk of solution and at the solid surface.
As crystals start to grow, the concentration drops at the interface between the boundary layer of
solution adjacent to it thus facilitating the concentration gradient with respect to the bulk solution
which drives the solute diffusion process through which solute molecules move from the bulk
solution phase to the growing crystal. It can be postulated that the mass transfer for the larger
scale size, due to the larger solution volume consistent with a faster diffusion rate would be
greater at the 15ml solution when compared to the 0.5ml scale size. Hence it can be expected that
the driving force for the crystal growth should be somewhat less in the 0.5mL cuvette. With the
same amount of crystals forming for both scale sizes, the local supersaturation levels might be
30
cell. However, examination of the ATR UV/Vis data measured in-situ in the 15mL cell shows
supersaturation level to be comparatively constant during the crystallisation process. This
probably reflects the small amount of crystals nucleated in the vessel resulting in only a modest
and perhaps un-detectable supersaturation change.
4.3
Crystal morphology as a function of growth environment
The morphology of ibuprofen crystals as a function of solvent and supersaturation was found to
be quite consistent from crystal to crystal and between two scale sizes in good agreement with
previous studies [2, 26, 27]. Plate-like ‘hexagonal’ crystals were obtained from ethanol whilst
more elongated forms were found in ethyl acetate, acetonitrile and toluene. Crystals prepared
from toluene and acetonitrile solutions were found to grow with the most needle-like
morphology. The former exhibited a degree of curvature on the {001} faces which might be
consistent with the onset of kinetics roughening. The microscopic images obtained were of very
high quality revealing the traces of the growth sector boundaries and revealing no evidence for
the presence of a substantial level of crystal defects such as solvent inclusions, twining etc.
Changes of relative growth rate of the {001} and {011} faces with solvent-type and
supersaturation resulted in a variation of the crystal aspect ratios reflecting the fact that the
crystals tended to be more elongated in the polar aprotic and non-polar solvents and with
decreasing supersaturation, as shown in Figure 11 and Figure 12. Similar effects were reported
by Ristic, et al. [85] who observed that the growth morphology of monoclinic paracetamol from
pure aqueous solution at different supersaturations exhibited a strong
supersaturation-dependence associated with a change from a columnar to a plate-like habit with increasing
31
[image:32.612.32.593.62.644.2]
Figure 11 Representative micrographs taken from in-situ images at 0.5mL scale size summarizing the
influence of solvent and supersaturation on the growth morphologies of ibuprofen together with the Ethyl acetate
Toluene Acetonitrile
95% ethanol/water
Vacuum morphology = 1.15
= 0.66
= 1.17 = 0.70
= 1.1β = 0.66
32
vacuum morphology figure from Bunyan [26]. Note that the aspect ratios mostly tend to increase with
[image:33.612.141.519.129.332.2]decreasing supersaturation.
Figure 12 Aspect ratios of ibuprofen crystal grown from 95% ethanol/water (blue), ethyl acetate (red),
acetonitrile (green) and toluene (purple) versus relative supersaturation at two scale-sizes: 0.5ml (squares)
and 15ml (circles).
It was found that at higher levels of supersaturation for all solvents (particularly ethanol) the
crystals were found to present significantly large higher order re-entrant faces at the boundary
between {011} and {01-1}, see Figure 13. The mechanistic origin of this effect is currently
being characterised in further detail and the results will be presented in a future publication.
Figure 13 Schematic (a) and pictures of ibuprofen crystal grown from 95% ethanol/water (b), acetonitrile
(c), ethyl acetate (d), and toluene (e) showing the emergence of higher index re-entrant faces at the
boundary between the end-capping {011} faces 0
4 8 12 16 20 24
0.5 0.7 0.9 1.1 1.3 1.5
Aspec
t
rat
io
Relative supersaturation
(b) (c) (d) (e)
[image:33.612.43.501.534.663.2]33
The morphology of a crystal in different growth environments depends, collectively, on the
relative growth rates associated with its constituent crystal habit faces. Mechanistically, these
rates reflect the balance between the rate of desolvation of solvent molecules and the rate of
solute adsorption at the different crystal growth interfaces. Ultimately these rates are linked to
the respective interaction energies associated with the solute and solvents molecules on these
surfaces. Hence, the growth rate of an individual habit face can be rationalised in terms of the
respective binding between solute and solvents on specific faces using molecular modeling to
[image:34.612.73.537.282.458.2]examine the molecular arrangements present on at the {011} and {001} surfaces as shown in
Figure 14.
Figure 14 Molecular packing diagrams based upon the crystallographic structures: (left) the {001} face
showing its hydrophobic nature with -CH3 groups exposed at the surface with the protic COOH groups
exposed in one direction and in a quite restricted position; (right) {011} face showing a more polar
surface with exposed–COOH groups at the surface with two different directions that are more exposed
and easier accessible than –COOH group on face {001} which provides good binding sites for polar
solvent molecules.
On the {011} face the molecules can be seen to be arranged alternatively nearly parallel and
perpendicular to the surface and exhibits great hydrophilicity because the -COOH groups are
more exposed and easier accessible for the formation of the hydrogen bonds hence so the use of polar
34
protic solvents (ethanol with -OH groups which can act either as a hydrogen bond donors or
acceptors) would inhibit the growth of {011} resulting in shortened crystals (plate-like crystals).
On the contrary, the more polar aprotic (ethyl acetate or acetonitrile) or non-polar (toluene)
solvents would be less likely to interact on the {011} surface and more likely to bind to the
hydrophobic {001} surfaces thus resulting more elongated crystals for theses solvents. Moreover,
interactions of less polar solvents with alkyl groups on the {001} face hinders the growth of this
face.
4.4
Variation in growth rates between crystals prepared under the same
conditions
Each crystal growth rate data point reported in Table 2 represents a mean value from between
five and eight individual crystals for which the growth rate was measured. Figure 9 illustrates the
growth of the {001} and {011} face over time for five individual crystals. The face specific
growth rates were found to display a good linear fit with time for each crystal surface indicating
that these surfaces follow the constant crystal growth model which proposes a constant relative
growth rate of each crystal during the growth period, albeit with different growth rates for
different crystals. The average standard deviation of these particular crystal measurements was
found to be about 12%. The % crystal growth rate variation crystal by crystal and for both faces
was found to increase with an increase in the mean growth rate in a similar manner to previous
observations made on citric acid monohydrate [86], sucrose [87], and proteins [18]. The growth
rate variations of ibuprofen are summarised in Table 5. Comparing these data with that from
35
Table 5. The coefficient of variation (%) for the growth rate of the crystal faces
Solvent type The {001} face The {011} face
0.5mL 15mL 0.5mL 15mL
Ethanol 0.12 0.103 0.12 0.09
Ethyl acetate 0.123 0.10 0.095 0.07
Acetonitrile 0.177 0.103 0.12 0.083
[image:36.612.119.494.299.500.2]Toluene 0.193 0.173 0.092 0.084
Table 6. Growth Rate Dispersion of some other organic and inorganic materials
Materials The coefficient
of variation
References
Lysozyme (face {110}) Lysozyme (face {101}) Paracetamol (face {110}) Sucrose
Citric acid monohydrate ADP
Ibuprofen
0.05 - 0.2 0.05 - 0.33 0.061 - 0.141 0.28
0.35 0.37 0.07- 0.19
Judge et al. [18] Judge et al. [18] Finnie et al. [83]
Berglund and Murphy [87] Berglund and Larson [86] Garside and Ristic [17] This study
However, caution should be exercised in over interpreting this data as errors e.g. due to the
blurring of the crystal boundaries together with minor errors from manual measurements etc.
could have been introduced. Nonetheless, the standard deviations of the measured growth rates
are broadly representative of the expected variation in growth rates of crystal habit faces in
individual crystals. According to observations of sequence of single crystals grown during a
period of time, there were different growth rate between four similar faces (011), (0-11), (01-1)
36
that the initial size of crystals studied was very similar, these observations are more consistent
with being due to growth rate dispersion (GRD) rather than one of size dependant growth (SDG).
In this study, the growth rate data shows a lower growth rate variation for the growth of
spontaneously nucleated crystals in stagnant, supersaturated solutions compared to the GRD
observed in a stirred batch crystallizer which was measured from size distribution of crystals
from seeding [11]. The latter study showed ibuprofen growth in absolute ethanol at the 1L stirred
seeded batch crystallisation vessel size exhibits GRD with a log normal distribution of growth
rates having a spread of the coefficient of variation CVv = 0.5 (Figure 15). Similarity, studies of
the growth rate behaviour of anhydrous sodium sulphate revealed that GRD of single crystals
grown in a flow cell was less than that found among a population of crystals prepared in a batch
crystallizer [88]. This latter data was rationalised in terms of the crystal collisions occurring in
[image:37.612.92.407.425.594.2]the agitated crystalliser producing greater numbers of faster growing nuclei.
Figure 15 Distribution spread CVv versus experimental growth time at 25oC in absolute ethanol
(reproduced with permission from Rashid et al.[11])
Whilst a significant number of studies have been carried out, the mechanism of GRD is still a
37
GRD at the higher supersaturations and the GRD in the 15 mL vessel is less than that observed
for the 0.5 mL cuvette. These observations are similar to the data recorded for other materials
citric acid monohydrate [86], sucrose [87], and proteins [18]. At the higher supersaturations, the
nucleation rate was found to be greater, which means more crystals are generated in the in-situ
cell which grow at the same time in solution resulting in a more rapid desupersaturation of the
growth solution at the smaller scale size (0.5 mL). The GRD effect was not found to vary
significantly between the solvents except for toluene. However, this observation might due to the
very needle-like crystals produced with this solvent, e.g. curvy {001} faces which were found in
toluene.
4.5
Characterisation of the interfacial growth mechanisms
The microscopy observations reveal that the crystal growth was clearly planar in nature. This,
together with the appearance of crystals which are bounded by well-defined crystallographic
surfaces which are not roughened would suggest that the growth mechanism would be either due
to the BCF or B&S mechanism. This supposition is confirmed through examination of data
presented in Figure 16 which show that there is a strong and non linear dependence of the relative
growth rates, on supersaturation ruling out models, such as the rough surface model [71] for
which a linear dependence of growth rate on supersaturation fitting would be expected. Plots of
the measured crystal growth rates versus relative supersaturation together with fitting against
38
Figure 16 Plots of the growth rate versus relative supersaturation in ethanol (blue), ethyl acetate (red),
acetonitrile (green) and toluene (purple) together with fitted B&S (solid lines) and BCF (dotted lines)
[image:39.612.77.539.72.446.2]mechanism modelsfor both {011} (left) and {001} (right) and for both 0.5mL (top) and 15mL (bottom)
Table 7 Fitting parameters for the faces {011} and (002) of ibuprofen grown in ethanol 95%, ethyl acetate,
acetonitrile and toluene with BCF model (equation 10) and B&S model (equation 11) together with the
adj.R2
Solvent choice 0.5mL 15mL
{011} face {001} face {011}face {001}face B&S BCF B&S BCF B&S BCF B&S BCF Ethanol
95%
A B
adj.R2
41.782 -0.962 0.986
16.540 8.79E8 0.966
39.41 -1.51 0.94
8.03 4.2E11 0.94
29.13 -0.40 0.99
33.97 0.65 0.99
32.28 -1.22 0.996
[image:39.612.25.574.597.704.2]39 Ethyl
acetate ( = 0.54-0.76) A B adj.R2 152.62 -0.88 0.996 65.02 63.46
0.973 31.94 -1.29 0.994 8.15 2.2E9 0.95 162.55 -0.85 0.97 72.95 61.89
0.95 41.57 -1.36 0.986 10.16 8.3E12 0.941 Ethyl
acetate ( = 0.76-1.20) A B adj.R2 61.53 -0.20 0.995 53.41 49.22 -0.22 63.56 -0.15 0.998 54.75 48.74 -0.28 Acetonitrile A
B adj.R2 167.66 -0.81 0.937 72.09 37.45 0.872 70.88 -2.38 0.891 6.05 2.0E8 0.70 175.15 -0.75 0.99 82.03 32.75 0.88 91.95 -2.47 0.932 7.69 1.91E6 0707
Toluene A
B adj.R2 33.76 0.078 0.958 45.25 24.89 -5.77 9.56 -1.00 0.77 3.51 46.2 0.76 32.46 0.21 0.97 39.82 8.07 -5.86 6.902 -0.528 0.994 5.858 0.857 0.994
Table 7 showed shows the fitting parameters A and B (see equation (10) and (11)) and the adj. R2
for the faces {011} and {001} grown in various solvents fitted against the B&S and BCF models.
Generally and overall, the B&S model provides a better fit to the data than that for BCF model
for most data measured. The main exceptions are for R{011} and R{001} in ethanolic solutions,
which provided broadly similar values for the fitting adj. R2 (0.97-0.99) for both models.
In ethyl acetate, the growth rate was studied at lower range of supersaturations, i.e. from 0.54 to 1.β. It was shown that at supersaturation from 0.54 to 0.76 R{011} versus fits well for both
BCF and B&S model (the adj. R2 = 0.λλ6 and 0.λ7γ, respectively). However, at ranging 0.76 to
1.20 only the B&S shows acceptable fit (the adj. R2 = 0.995 for B&S and -0.22 for BCF)
consistent with the growth mechanisms where the BCF mechanism might be occur at low
supersaturation [71]. At intermediate supersaturations ( from 0.54 to 0.76) spiral growth and
birth and spread mechanisms may both be present. However, at higher supersaturation ( from
0.76 to 1.20) the B&S mechanism provided a better fit to the data. This observation might
suggest a change of the growth mechanism between these two supersaturation regions.
In summary, the crystals grown from four solvents were mostly found to be consistent with
[image:40.612.66.584.69.283.2]40
1.31. For some solvents and supersaturations the BCF model was also found to provide an
acceptable fit. In addition the data revealed no significant evidence for any mechanistic changes
associated with crystal growth between scale sizes.
5
Conclusions
The solution mediated crystal growth rates of the {011} and {001} faces of spontaneously
nucleated ibuprofen crystals have been measured as a function of supersaturation and solvent
under diffusion-limited conditions at two scale sizes (0.5mL and 15mL). The results show that
the mean growth rate of the {001} and {011} faces were found to increase with increasing
relative supersaturation with R{011} being higher than R{001}. This is found particularly to be the
case for crystals grown in ethyl acetate, acetonitrile and toluene solutions at the two different
scale sizes.
At a similar supersaturation level, R{011} were found to be lowest in ethanol and highest in
acetonitrile with R{001} lowest in toluene and highest in ethanol and ethyl acetate. The difference
in the growth rates between different crystal surfaces as well as the growth rate of the same
surface when grown from different solvents can be rationalised in terms of the differences in the
inter-molecular interactions between crystal surfaces and the solvents. Changes in the relative
growth rate of the {001} and {011} faces with solvent type and supersaturation level cause a
change in the crystal aspect ratios associated with the crystals becoming more elongated in ethyl
acetate, acetonitrile and toluene solutions in comparison to the crystals grown in 95%
ethanol/water. The aspect ratios for crystals grown at 0.5 mL and 15 mL scale-sizes were found
to be quite similar. GRD was found to occur for crystal growth on both surfaces and at all
supersaturation levels. However, it was found to be less pronounced when compared to the case
41
and R{011} in the 15 mL vessel are greater than the growth rates in the 0.5 mL cuvette possibly
due to better mass transfer environment in the larger vessel and due to the fact that
supersaturation levels probably decrease more rapidly in the smaller vessel. However, the GRD
measured in the 15 mL vessel was found to be less than the GRD in the 0.5 mL cuvette. The
supersaturation at the 15 mL scale as measured in-situ using an ATR UV/Vis
spectrophotometer was found to be nearly constant during the growth process, supporting the
utility of this methodology for the routine determination of the growth kinetics and mechanism.
The B&S interfacial kinetic model was found to describe best the dependence of the growth rate
of the {011} face and {001} face on the supersaturation from 0.54 to 1.22, albeit for a few
cases the BCF mechanism was also found to fit that data satisfactorily.
Acknowledgement. The authors gratefully acknowledge the financial support of this work by
Pfizer and UK Northern Universities (N8) METRC initiative in molecular engineering. We also
thank Prof. Ted White (University of Queensland, Australia) for his most helpful comments and
discussions concerning the growth rate measurements of ibuprofen.
We also gratefully acknowledge the UK's EPSRC for their support in nucleation research at the
Universities of Leeds and Manchester through their funding of the Critical Mass Project
"Molecules, Clusters and Crystals" (grant references EP/I014446/1 and EP/I013563/1,


![Table 3 Comparison of the mean growth rates with the growth rate calculated from Rashid [11]](https://thumb-us.123doks.com/thumbv2/123dok_us/7951818.197327/29.612.88.590.97.571/table-comparison-mean-growth-rates-growth-calculated-rashid.webp)

