promoting access to White Rose research papers
White Rose Research Online
Universities of Leeds, Sheffield and York
http://eprints.whiterose.ac.uk/
This is an author produced version of a paper published in Electronic Journal of
Probability.
White Rose Research Online URL for this paper:
Published paper
Jordan, J. (2011) Randomised reproducing graphs, Electronic Journal of
Probability, 16, pp. 1549-1562
Randomised reproducing graphs
Jonathan Jordan University of Sheffield ∗
July 26, 2011
Abstract
We introduce a model for a growing random graph based on simultaneous reproduction of the vertices. The model can be thought of as a generalisation of the reproducing graphs of Southwell and Cannings and Bonato et al to allow for a random element, and there are three parameters, α, β and γ, which are the probabilities of edges appearing between different types of vertices. We show that as the probabilities associated with the model vary there are a number of phase transitions, in particular concerning the degree sequence. If (1 +α)(1 +γ)<1 then the degree distribution converges to a stationary distribution, which in most cases has an approximately power law tail with an index which depends onαandγ. If (1 +α)(1 +γ)>1 then the degree of a typical vertex grows to infinity, and the proportion of vertices having any fixed degreedtends to zero. We also give some results on the number of edges and on the spectral gap.
AMS 2000 Subject Classification: Primary 05C82; secondary 60G99, 60J10
Key words and phrases: reproducing graphs, random graphs, degree distribution, phase transi-tion
Submitted to EJP 21 December 2010, final version accepted 18 July 2011.
∗
1
Introduction
In this paper we introduce a new model for a growing random graph based on simultaneous reproduction of the vertices in the graph, with edges being formed between the new vertices and each other and between the new vertices and the existing ones according to a random mechanism conditioned on the pattern of edges between the vertices in the previously existing graph. The model is a generalisation of the models introduced by Southwell and Cannings [10, 11, 12] and the Iterated Local Transitivity (ILT) model of [2], introducing stochasticity, which causes the regular structure found in the graphs of [10, 11, 12] to be lost, and which may make them more suitable for modelling in areas such as social networks; the authors of [2] particularly suggest their model as a model for online social networks, mentioning Facebook and Twitter among other examples.
We will show that our model, which depends on three parameters α, β and γ, which are to be thought of as probabilities, exhibits a number of phase transitions as the parameters vary; for example for some values of the parameters we will show that the degree distribution of the graph converges to a limiting probability distribution, while for other choices of the parameters the degree of a randomly chosen (in an appropriate sense) vertex in Gn can be shown to tend
to infinity as n → ∞. We will also show that for certain choices of the parameter values the model exhibits a power-law-like decay of the degree distribution, which is a property reported for many “real world” networks, and is also associated with other random graph models such as preferential attachment.
We start with a graph G0, and form a new graph Gn+1 by adding a “child” vertex for every
vertex ofGn. As in [10, 11, 12] we denote the vertices by binary strings, writingv0 for the “child”
of vertex v∈V(Gn) and v1 for the continuation of vertex v as a vertex of Gn+1. The edges of
Gn+1 are then obtained according to the following mechanism. For each n define independent
(of each other and of the random variables at other stages of the construction) Bernoulli random variables a(n){u,v} ∼ Ber(α) for each unordered pair {u, v} of vertices of Gn, b(n)u ∼ Ber(β) for
each vertex in Gn, c(n)(u,v) ∼ Ber(γ) for each ordered pair (u, v) of vertices of Gn, and connect
vertices as follows:
(a) u1 is connected to v1 in Gn+1 if and only if u and v are connected in Gn, that is existing
edges are retained, and no further edges are formed between existing vertices.
(b) u0 is connected tou1 in Gn+1 if and only ifb(n)u = 1, so each child is connected to its parent
(c) u0 is connected tov1 inGn+1 if and only if c(n)(u,v) = 1 andu and v are connected in Gn, so
each child is connected to each of its parent’s neighbours with probability γ.
(d) u0 is connected to v0 inGn+1 if and only of a{(n)u,v} = 1 and u and v are connected in Gn,
so each child is connected to each of its parent’s neighbours’ children with probability α.
The models introduced in [10, 11, 12] have α, β, γ ∈ {0,1}, so are deterministic. Additionally the case whereα= 0, β= 1, γ= 1 is the ILT model, introduced in [2] as a model for online social networks. The ILT(p) model introduced in [2] as a stochastic generalisation of the ILT model adds extra random edges between the child vertices without regard to whether their parents were connected, and thus cannot be seen as a special case of our model. In addition as defined in [2] the ILT(p) model always has at least the edges found in the basic ILT model, so is not suited to producing relatively sparse graphs.
The model differs from duplication graphs, for example those considered in [3, 5], in that in those models only one vertex, chosen at random, duplicates at any one time step, whereas in the models considered here and in [2, 10, 11, 12] all vertices simultaneously duplicate.
Our main results concern the degree distribution. We will deal with the cases where β= 0 and β >0 separately, as the behaviour of the model when β = 0 is potentially quite different, with large numbers of isolated vertices.
Theorem 1. Let β = 0. Then, if (1 +γ)(α+γ) ≤1, the probability that a randomly chosen vertex in the graph Gn is isolated tends to 1 as n → ∞, and the proportion of vertices in the
graph with degree zero tends to 1, almost surely. If (1 +γ)(α+γ)>1, then the probability that a randomly chosen vertex in the graph Gn is isolated converges to some value strictly less than
1.
Theorem 2. Assumeβ >0, and letp(n)d be the proportion of vertices inGn with degreed. Then
(a) If (1 +γ)(α+γ) < 1 there exists a random variable X such that p(n)d → P(X = d) as n→ ∞, almost surely.
(b) Under the conditions of (a), the random variable X has a finite pth moment if (1 +γ)p+ (α+γ)p<2, and does not have a finitepth moment if(1 +γ)p+ (α+γ)p >2.
(c) If (1 +γ)(α+γ)>1 then p(n)d →0 as n→ ∞, almost surely.
In [2], it is shown that the ILT model exhibits a “densification power law”, which is defined to mean that, if En is the number of edges of Gn and Vn the number of vertices, then En is
proportional to (Vn)a for somea∈(1,2). The following result shows that our model exhibits a
phase transition in this respect, with the transition occurring where 2γ +α = 1. Note that in our model, as in the ILT model, Vn= 2nV0 for alln.
Theorem 3. (a) If 2γ+α >1 then Wn = (1+2γ+α)En n converges to a positive limit, so that the
model has a densification power law as defined by [2] with exponent log(1+2γ+α)log 2 .
(b) If 2γ+α <1 then
En
2n →
V0β
1−2γ−α,
almost surely, asn→ ∞, so that the number of edges grows at the same rate as the number of vertices
(c) If 2γ+α= 1 then
En
2nn →
V0β
2 , almost surely, as n→ ∞.
Note that the combination of Theorems 3 and 2 implies that when 2γ+α >1 but (1+γ)(α+γ)< 1 the process exhibits both a densification power law in the sense of [2] and an approximately power law limit for the degree distribution.
A further result in [2] on the ILT model concerns the spectral gap. They show that the normalised graph LaplacianL, as defined by Chung [4], of the ILT model has a large spectral radius, defined as max{|λ1−1|,|λn−1−1|}, whereλ1is the second smallest eigenvalue (the smallest beingλ0= 0
for any graph) and λn−1 is the largest eigenvalue and thus that the graph has relatively poor
expansion properties. The following results show that the same is also true for our model. We concentrate on the case β = 1, where the graphs are connected; otherwiseλ1 will be zero. The
proofs use the Cheeger constant and its relationship toλ1, as defined in Chapter 2 of Chung [4].
Theorem 4. Let β = 1 and assume that G0 is connected, so that Gn will also be connected for
all n. Let λ1(Gn) be the smallest non-negative eigenvalue of the Laplacian ofGn. Then
(a) If 2γ+α≤1 then λ1(Gn)→0 as n→ ∞.
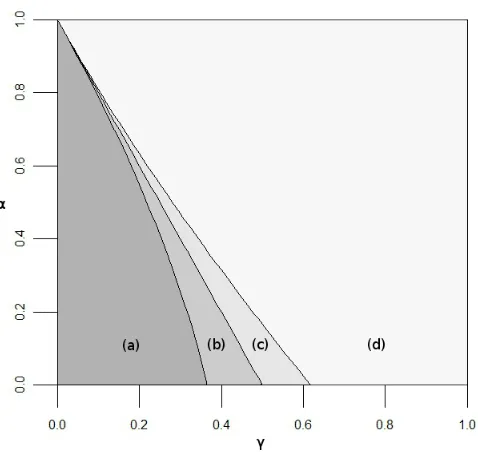
Some of the results of Theorems 2 and 3 are illustrated by the phase diagram of the γ–α plane in Figure 1.
2
Pictures
This section shows a few examples of graphs of this type, which were generated using a script written with the igraph package, [6], in R. Figure 2 shows examples with n = 7, α = 0 and β = 1, with γ varying. These show the graph changing as γ increases from a sparse tree-like graph where most vertices have low degree to a much denser graph where many vertices have high degree.
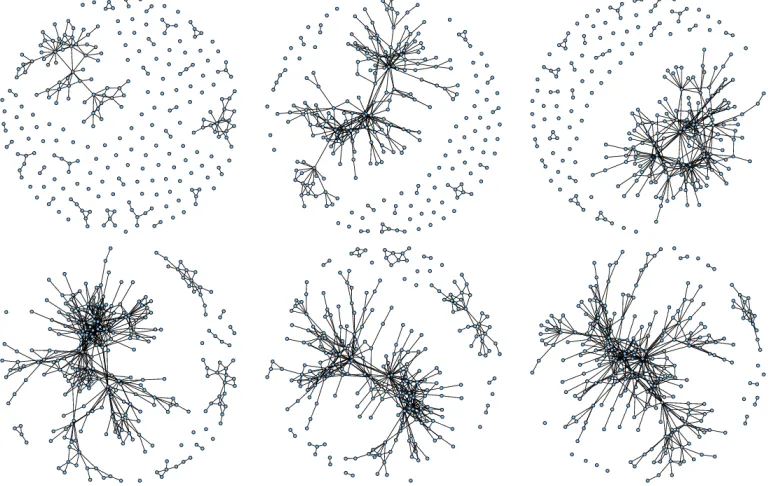
Figure 3 shows examples with α = 0 and γ = 0.366 (this is approximately
√
3−1
2 ), two values
of β and again n= 7. Those with higher β have fewer isolated vertices and have more of the vertices in the largest component.
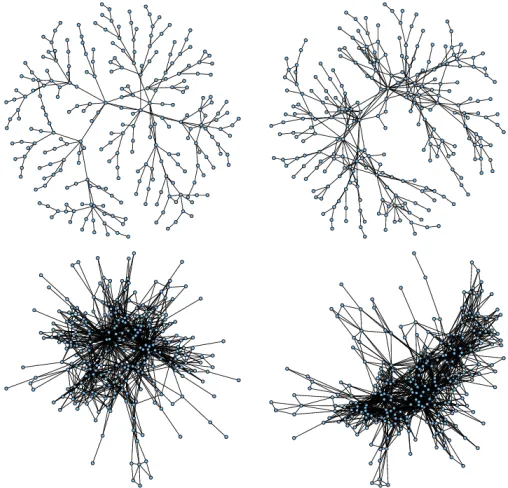
Finally, Figure 4 shows examples withβ = 1, γ = 0.05 andα varying. These show graphs with a less-tree like structure with fewer very low degree vertices as α increases.
3
Proofs of Theorems
We start with a lemma on the conditional expectation and variance of the number of edges in Gn, En. This lemma will be useful for obtaining the mean of the stationary distribution of a
Markov chain which we will use to prove Theorems 1 and 2. We define Fn to be the σ-algebra generated by the graphs Gm for m ≤ n, and we use the notation Bin(n, p) for the binomial
distribution with ntrials and success probabilityp.
Lemma 5. The conditional expectation and variance of En+1 satisfy
E(En+1|Fn) = (1 + 2γ+α)En+ 2nβV0
Var(En+1|Fn) = En(2γ(1−γ) +α(1−α)) + 2nV0β(1−β)
Proof. This follows from the fact that the En+1 can be writtenEn+En+1,1+En+1,2+En+1,3
whereEn+1,1,En+1,2 and En+1,3 are independent,En+1,1 represents the edges between parents
Figure 1: Phase diagram showing how the limiting behaviour of the graphs in the β 6= 0, as described by Theorems 2 and 3, case can vary with α andγ. In region (a) the degree sequence converges to a distribution with both first and second moments finite; in region (b) the limiting distribution has first moment finite but the second moment not; in region (c) the limiting distribution has infinite mean; in region (d) there is no limiting degree distribution. In regions (a) and (b) the graphs are sparse; in regions (c) and (d) they have a densification power law as described by Theorem 3. The borders between the regions intersect the γ axis at
√
3−1 2 ,
1 2 and
√
Figure 3: Example simulations with α = 0 and γ = 0.366. The top row have β = 0.4 and the bottom rowβ = 0.8.
[image:9.612.108.482.492.615.2]represents the edges between children of neighbouring vertices and, conditional on Fn has a
Bin(En, α) distribution, and En+1,3 represents the edges between parents and their children
and, conditional on Fn has aBin(Vn, β) distribution. AsVn= 2nV0 the result follows.
3.1 Proof of Theorem 3
We start with (a), the case where 2γ+α >1. The following approach is based on that in [1] for multitype branching processes, the idea being that the vertices and edges in the graph Gn can
be thought of as the two types in a population undergoing branching. However the resulting multitype branching process is not irreducible, so the results in [1] cannot be used directly.
Given an edge in Gm between verticesu and v, there will be an edge inGm+1 betweenu1 and
v1, and in addition there will be edges between u1 andv0 andv1 andu0 each with probability
γ and an edge betweenu0 andv0 with probability α. We can consider these edges as offspring of the edge between u and v, and thus consider the set of edges in Gn (for n > m) which are
descendants of the edge between u andv inGm as a generation in a Galton-Watson branching
process with offspring mean 1 + 2γ+α, and where the extinction probability is zero and the number of offspring bounded. Treating the descendants of a given edge inGm as a subset of the
edge set of Gn, this shows that lim inf (1+2γ+α)En n is a positive random variable.
Now define
Wn=
Vn+2γ+αβ−1En
(1 + 2γ+α)n .
Then E(Wn+1|Fn) =Wn, so (Wn)n∈N is a non-negative martingale, and thus almost surely has
a non-negative limit W. The above conclusion on lim inf En
(1+2γ+α)n shows that P(W = 0) = 0,
giving the result.
For (b), the case where 2γ+α <1, Lemma 5 shows that E(En) = 1−V2γ0β−α2n+o(2n) and
Var(En) = 2n−1
V0β
1−2γ−α(2γ(1−γ)+o(2
n)+α(1−α))+2nV
0β(1−β)+(1+2γ+α)2Var(En−1),
which shows that
Var En 2n =O max 1 2,
(1 + 2γ+α)2 4
n
,
For (c), the case where 2γ+α= 1, an iterative use of Lemma 5 shows thatE(En) = 2n
E0+ βV20n
and Var(En+1) = 2n−1nβV0(2γ(1−γ) +α(1−α) + 4) +O(2n). Then
Var
En
2nn
=O
1 n22n
,
allowing the Chebyshev/Borel-Cantelli argument again.
3.2 Proof of Theorem 4
We consider some small m, and find the Cheeger constant of Gm. By the definition in [4], this
will be e(Sm,S¯m)/vol(Sm) for some Sm ⊆ V(Gm), where for two subsets of the vertex set S
and S0 e(S, S0) is the number of edges between a vertex inS and one in S0, and vol(S) is the sum of the degrees of vertices in S. (Note that vol(S) = 2e(S, S) +e(S,S¯.) Now consider the descendants of Sm inGn as a subset Sn ⊆ V(Gn). Then the same arguments as in the proof
of Theorem 3, applied to the subgraphs descending from Sm and ¯Sm, show that if 2γ +α <1
then the e(Sn, Sn) and e( ¯Sn,S¯n) both grow at rate 2n, in the sense that e(S2nn,Sn) and
e( ¯Sn,S¯n)
2n
converge almost surely to positive constants as n → ∞, and similarly if 2γ +α = 1 e(Sn, Sn)
and e( ¯Sn,S¯n) both grow at rate 2nn, and if 2γ +α > 1 e(Sn, Sn) and e( ¯Sn,S¯n) both grow at
rate (1 + 2γ+α)n.
Next, again as in the proof of Theorem 3, (e(Sn,S¯n))n∈N forms a Galton-Watson branching
process with mean of the offspring distribution 1 + 2γ +α, and extinction probability zero, so e(Sn,S¯n) will grow at rate (1 + 2γ+α)n. So for 2γ+α > 1 e(Sn,
¯ Sn)
min(vol(Sn),vol( ¯Sn)), which by the
definition in [4] is greater than the Cheeger constant of Gn, converges to a constant (less than
1, as vol(Sn) = 2e(Sn, Sn) +e(Sn,S¯n)) and this constant bounds the lim sup of the Cheeger
constant of Gn above.
In the case where 2γ+α <1
e(Sn,S¯n)
max(vol(Sn),vol( ¯Sn))
=O
1 + 2γ+α 2
n
→0
asn→ ∞, and hence so is the Cheeger constant. Similarly if 2γ+α= 1
e(Sn,S¯n)
max(vol(Sn),vol( ¯Sn))
=O 1 n ,
Hence by the Cheeger inequality (Lemma 2.1 and Theorem 2.2 of [4]), lim supn→∞λ1(Gn) <1
almost surely in the case 2γ+α >1, andλ1(Gn) tends to zero in the case 2γ+α≤1.
3.3 Proofs of Theorems 1 and 2
The proofs of Theorems 1 and 2 will rely on defining a certain Markov chain whose value Xn
represents the degree of a random vertex in the graph Gn. We construct this by letting v0 be
a vertex of G0 chosen uniformly at random, and then, using the binary string notation for the
vertices described above, for n≥1 let vn =vn−11 with probability 1/2 and letting vn=vn−10
with probability 1/2. We then letXn be the degree ofvn inGn.
Then
Xn+1=ξn+1Xn+ (1−ξn+1)Wn+1+Yn+1+Zn+1, (1)
where, conditional on Gn, Yn+1 ∼ Bin(Xn, γ), Wn+1 ∼ Bin(Xn, α), Zn+1 ∼ Bin(1, β) and
ξn+1 ∼Bin(1,12), with all these variables being conditionally independent given Gn.
Here,ξn+1= 1 if our vertex inGn+1is a parent and 0 if it is a child,Wn+1 represents child-child
connections (so does not appear if ξn+1 = 1),Yn+1 represents connections between a child and
its parents’ neighbours, and Zn+1 represents the connection between the child and its parent.
As defined above, (Xn)n∈N is a discrete time Markov chain on the natural numbers (including
zero if β <1). It is irreducible and aperiodic if β >0, α < 1 and γ <1. (If β = 0 then zero is an absorbing state, and if either α or γ is 1 then Xn is increasing in n and so the chain is
certainly not irreducible, but otherwiseP(Xn+1= 1|Fn) is always positive.)
Proposition 6. If 2γ+α <1 the distribution of Xn converges in the Wasserstein-1 metric to
a unique fixed point with finite mean 1−2β2γ−α.
Proof. Note that if we have another random variable ˆXnwith a different distribution onN0, we
can apply (1) to it by defining, conditional on ˆXn, ˆYn+1∼Bin( ˆXn, γ) and ˆWn+1∼Bin( ˆXn, α)
using the same set of Bernoulli trials as forYn+1 and Wn+1 respectively, and letting
ˆ
Xn+1=ξn+1Xˆn+ (1−ξn+1) ˆWn+1+ ˆYn+1+Zn+1.
Then, conditional on Fn, if ˆXn> Xn we have
ˆ
where ˆWn+1−Wn+1 ∼Bin( ˆXn−Xn, α) and ˆYn+1−Yn+1 ∼Bin( ˆXn−Xn, γ), and similarly, if
ˆ
Xn< Xnwe have
Xn+1−Xˆn+1 =ξn+1(Xn−Xˆn) + (1−ξn+1)(Wn+1−Wˆn+1) +Yn+1−Yˆn+1,
whereWn+1−Wˆn+1 ∼Bin(Xn−Xˆn, α) andYn+1−Yˆn+1 ∼Bin(Xn−Xˆn, γ). Combining these,
we can see that
E(|Xn+1−Xˆn+1||Fn) =
1
2(2γ+α+ 1)|Xn−Xˆn|,
so that we have a contraction in the Wasserstein metric if 2γ+α <1. Hence in this case there is convergence in the Wasserstein-1 metric of the degree distributions to a unique fixed point with finite mean.
We can calculate the mean of this distribution by using Lemma 5: letting m= 2 we get
E(k2(n+1)) = (2γ+α+ 1)k (n) 2 + 2
nβv 0,
wherev0 is the number of vertices in the initial graph, and solving this we find that the expected
number of edges inGn is
βv0(2n−(1 + 2γ+α)n)
1−2γ−α ,
so (as the number of vertices inGn is 2nv0) the expected average degree is
β(2n−(1 + 2γ+α)n)
2n−1(1−2γ−α) ,
which converges to 1−2γ2β−α asn→ ∞.
To go further than this we use Foster-Lyapunov techniques, as described in Meyn and Tweedie [8] in the more general case of an uncountable state space. The following lemma on the conditional moments ofXn+1 (including negative and fractional moments) will be useful.
Lemma 7. Let p∈R. Then as x→ ∞,
E
1 +x+Yn+1+Zn+1
1 +x
p
|Xn=x
→(1 +γ)p,
and
E
1 +Wn+1+Yn+1+Zn+1
1 +x
p
|Xn=x
Proof. In the case wherep <0 this is a special case of Theorem 2.1 of Garc´ıa and Palacios in [7]. When p >0, the result follows from convergence in distribution of the conditional distributions of 1+x+Yn+1+Zn+1
1+x and
1+Wn+1+Yn+1+Zn+1
1+x givenXn=xto 1+γ andα+γrespectively asx→ ∞,
together with the fact that they are positive and bounded above by 2.
Proposition 8. If (1 +γ)(α+γ) < 1, the Markov chain is positive recurrent, and thus the distribution of Xn converges to a stationary distribution.
Proof. This uses Theorem 11.0.1 of [8].
We choosep∈(0,1) such that (1 +γ)p+ (α+γ)p <2. Because dpd((1 +γ)p+ (α+γ)p) is negative atp= 0 if log(1 +γ) + log(α+γ)<0, it will be possible to find such a pif (1 +γ)(α+γ)<1.
We now let V(x) =xp. In [8], the drift ∆V(x) is defined as
∆V(x) =E(V(Xn+1)−V(Xn)|Xn=x),
and by Theorem 11.0.1 of [8] the chain will be positive recurrent if (for some V) ∆V(x) ≤ −1 forx large enough. Now
E(Xn+1p |Xn=x) =
xp
2
E
1 +Yn+1 x +
Zn+1
x p
|Gn
+E Wn+1 x + Yn+1 x + Zn+1 x p
|Gn
≤ x
p
2 ((1 +γ)
p+ (α+γ)p) +o(xp)
(by Lemma 7),
so
∆V(x)≤xp
(1 +γ)p+ (α+γ)p
2 −1
+o(xp),
which will be less than −1 for x large enough, giving the result.
We now investigate the tail behaviour of the stationary distribution, in the case where Proposi-tion 8 shows one exists.
Proposition 9. Let p > 0. If (1 +γ)p + (α+γ)p < 2, then a random variable X with the stationary distribution of the chain has finite pth moment E(Xp), and we have convergence of
Proof. Again this uses a Foster-Lyapunov type technique, in this case Theorem 14.0.1 of [8] which states that if, for a given function f ≥ 1, we can find V such that ∆V(x) <−f(x) for x large enough then f has a finite integral with respect to the stationary distribution and that
E(f(Xn)) converges to this integral. We will setf(x) =xp+ 1.
Let V(x) =kxp, wherek is chosen so that
k
(1 +γ)p+ (α+γ)p
2 −1
<−1.
Then, by Lemma 7,
∆V(x)≤kxp
(1 +γ)p+ (α+γ)p
2 −1
+o(xp),
and so ∆V(x)≤ −f(x) for x large enough, giving the result.
Proposition 10. Let p > 0. If (1 +γ)p+ (α+γ)p > 2, then a random variable X with the stationary distribution of the chain does not have finite pth moment E(Xp).
Proof. As Zn+1≥0, we have
E(Xn+1p |Xn=x)≥
xp 2
E
1 +Yn+1 x
p
|Xn=x
+E Wn+1 x + Yn+1 x p
|Xn=x
,
so by Lemma 7
E(Xn+1p |Xn=x)≥
xp
2 ((1 +γ)
p+ (α+γ)p) +o(xp).
Hence the pth moment of Xn tends to infinity as n → ∞, so by Theorem 14.0.1 of [8], again
applied tof(x) =xp+ 1, the stationary distribution cannot have a finite pth moment.
Proposition 11. If β >0 and(1 +γ)(α+γ)>1 the Markov chain is transient.
Proof. By (1) and Lemma 7,
E((1 +Xn+1)p|Xn=x)
(1 +x)p →
(1 +γ)p+ (α+γ)p
2 , (2)
so we apply Theorem 8.0.2 (i) of [8] with V(x) = 1 −(1 +x)p for some p < 0 such that
The case whereβ = 0 is something of a special case as the chain is not irreducible. However we can show that when (1 +γ)(α+γ)≤1 the probability that a randomly chosen vertex is isolated tends to 1, while there is positive probability that a randomly chosen vertex is not isolated when (1 +γ)(α+γ)>1.
Proposition 12. If β= 0, then
1. if(1 +γ)(α+γ)≤1then almost surely Xn= 0 for nsufficiently large, and the proportion
of isolated vertices in Gn tends to1 almost surely as n→ ∞;
2. if(1 +γ)(α+γ)>1 then there is q >0 such that the probability that Xn→ ∞ as n→ ∞
is q and the probability that Xn→0 as n→ ∞ is1−q.
Proof. We note that (Xn) follows a Smith-Wilkinson branching process in random environment,
[9]. The environmental variables which determine the random environment are the random variables ξn, with the offspring distribution of the branching process at time n having mean
1 +γ ifξn+1 = 1 and α+γ if ξn+1 = 0. Hence, by Theorem 3.1 of [9], the branching process
dies out with probability 1 if 12log(1 +γ) +12log(α+γ)≤0, i.e. if (1 +γ)(α+γ)≤1, and the branching process dies out with probability strictly less than 1 otherwise, hence there is positive probability that Xn→ ∞ as n→ ∞. To see that the proportion of isolated vertices tends to 1
almost surely when (1 +γ)(α+γ)≤1, note that the proportion of isolated vertices is increasing (as if a vertex v is isolated in Gn both v0 and v1 are isolated in Gn+1) and therefore must
converge to some value, which cannot be less than 1 as the degree of a random vertex converges to zero almost surely.
Proposition 13. (a) If β > 0 and (1 +γ)(α+γ) < 1, the degree distribution of the graph converges to the stationary distribution of the Markov chain in the sense that if we letp(n)d be the proportion of vertices in Gn with degree d, and let X be a random variable with the
stationary distribution of the Markov chain, then p(n)d → P(X = d) as n → ∞, almost surely, for all d∈N0.
(b) If β >0 and(1 +γ)(α+γ)>1 then p(n)d →0 as n→ ∞, almost surely, for all d∈N0.
Proof. The graph at stage r contains 2rv0 vertices. We then consider the edges of Gr+s in
two sets: those which are between descendants of the same vertex in Gr, and those which are
between descendants of different vertices inGr. For the former, the appearance of edges between
descendants of one given vertex is independent of what happens to the descendants of the other vertices, so we can model these edges of Gr+s as consisting of 2rv0 independent copies of ˜Gs,
by Chebyshev’s inequality and a Borel-Cantelli argument, as r → ∞ proportions of vertices in Gr+s with degree d excluding connections to descendants of different vertices in Gr converge,
almost surely, to P(Xs =d). In the (1 +γ)(α+γ) >1 case we know that P(Xs =d) → 0 as
s → ∞ for all d, and the actual degree of a vertex is bounded below by the degree excluding some connections, so this is enough to prove (b).
To complete the proof of (a), we need to consider edges between vertices which are descendants of different vertices inGr. We couple the process, starting from Gr, with a process with β = 0
by removing all edges between a vertex and its offspring, and all edges descended from such edges. The edges thus removed fromGr+s will all be between vertices descended from the same
vertex inGr, so all edges between vertices descended from different vertices inGr are present in
theβ = 0 version. But by Proposition 12 the proportion of vertices inGr+swhich have non-zero
degree in theβ= 0 version tends to zero ass→ ∞, and so this also applies to the proportion of vertices in Gr+s which have edges connecting them to vertices with a different ancestor in Gr.
Hence as both r and s→ ∞ the proportion which have degreedconverges toP(Xs=d).
Finally we can put the Propositions above together to deduce Theorems 1 and 2.
Proof of Theorem 1. Theorem 1 follows from Proposition 12; in the supercritical case where (1 +γ)(α+γ)>1 the probability that a randomly chosen vertex in the graph is isolated tends to 1−q <1.
Proof of Theorem 2. Theorem 2 follows immediately from Propositions 8, 9, 10 and 13.
4
Acknowledgements
References
[1] K. E. Athreya and P. E. Ney. Branching Processes. Dover Publications, Mineola, New York, 1972.
[2] A. Bonato, N. Hadi, P. Horn, P. Pra lat, and C. Wang. Models of on-line social networks. Internet Mathematics, 6:285–313, 2011.
[3] F. Chung, L. Lu, T. Dewey, and D. Gales. Duplication models for biological networks. Journal of Computational Biology, 10:677–687, 2003.
[4] F. R. K. Chung. Spectral Graph Theory. Number 92 in CBMS Regional Conference Series. AMS, Providence, Rhode Island, 1997.
[5] N. Cohen, J. Jordan, and M. Voliotis. Preferential duplication graphs. Journal of Applied Probability, 2010.
[6] G. Cs´ardi and T. Nepusz. The igraph software package for complex network research. InterJournal Complex Systems.
[7] Nancy Lopes Garc´ıa and Jos´e Luis Palacios. On inverse moments of nonnegative random variables. Statist. Probab. Lett., 53(3):235–239, 2001.
[8] S. Meyn and R. Tweedie. Markov Chains and Stochastic Stability. Springer-Verlag, London, 1993.
[9] W. Smith and W. Wilkinson. On branching processes in random environments. Annals of Mathematical Statistics, 40:814–827, 1969.
[10] R. Southwell and C. Cannings. Games on graphs that grow deterministically. In Proc. International Conference on Game Theory for Networks GameNets ’09, pages 347–356, 13–15 May 2009.
[11] R. Southwell and C. Cannings. Some models of reproducing graphs. 1 Pure reproduction. Applied Mathematics, 1:137–145, 2010.