‘VALIDATED ANALYTICAL METHOD DEVELOPMENT FOR
THE QUANTIFICATION OF MULTICOMPONENT DRUGS
WITH SPECIAL EMPHASIS ON HERBAL AND SYNTHETIC
DRUG FORMULATIONS’
THESIS
Submitted to
The Tamil Nadu Dr. M. G. R. Medical University, Guindy, Chennai- 600032, Tamilnadu, India
In partial fulfillment of the requirement for the award of the degree of
DOCTOR OF PHILOSOPHY
(FACULTY OF PHARMACY)
Submitted By
Mr. Nitin Sitaram Jadhav
M.Pharm.Under the guidance of
Dr. K. G. Lalitha, M. Pharm., Ph. D.,
Professor and Head,Department of Pharmaceutical Chemistry
ULTRA COLLEGE OF PHARMACY, MADURAI - 625020
DECLARATION
I hereby declare that the thesis entitled ‘Validated Analytical Method
Development for the Quantification of Multicomponent Drugs with Special
Emphasis on Herbal and Synthetic Drug Formulations’ submitted to The Tamilnadu
Dr. M.G.R Medical University, Chennai, in partial fulfillment of the requirements for the award of Degree of Doctor of Philosophy in Pharmacy, is the result of my original and independent research work carried out at Department of Pharmaceutical Chemistry, Ultra College of Pharmacy, Madurai during the period from October 2010 to June 2014
under the supervision of the valuable and efficient guidance of
Dr. K. G. Lalitha, M. Pharm., Ph.D., Professor and Head, Department of
Pharmaceutical Chemistry, Ultra College of Pharmacy, Madurai. The thesis or any part thereof has not formed the basis for the award of any degree, diploma, associateship, fellowship, or any other similar title, of this or any other University, previously.
ULTRA COLLEGE OF PHARMACY,
4/235, COLLEGE ROAD,
THASILDAR NAGAR,
MADURAI - 20.
CERTIFICATE
This is to certify that the thesis entitled ‘Validated Analytical Method
Development for the Quantification of Multicomponent Drugs with Special
Emphasis on Herbal and Synthetic Drug Formulations’ is the research work done
and submitted in partial fulfillment of the requirement for the award of degree of Doctor
of Philosophy in Pharmacy of the Tamilnadu Dr. M.G.R Medical University, Chennai.
The work was done by Mr. Nitin Sitaram Jadhav in the Department of Pharmaceutical Chemistry, Ultra College of Pharmacy, Madurai under my guidance and supervision.
Place: Madurai Dr. K.G. Lalitha, M.Pharm., Ph. D.,
Date: Professor and Head,
Department of Pharmaceutical Chemistry, Ultra College of Pharmacy,
ULTRA COLLEGE OF PHARMACY,
4/235, COLLEGE ROAD,
THASILDAR NAGAR,
MADURAI - 20.
CERTIFICATE
This is to certify that the thesis entitled ‘Validated Analytical Method
Development for the Quantification of Multicomponent Drugs with Special
Emphasis on Herbal and Synthetic Drug Formulations’ is the research work done and
submitted in partial fulfillment of the requirement for the award of degree of Doctor of
Philosophy in Pharmacy of the Tamilnadu Dr. M.G.R Medical University, Chennai.
The work was done by Mr. Nitin Sitaram Jadhav and was guided and supervised by
Dr. K. G. Lalitha, M. Pharm., Ph.D., Professor and Head, Department of
Pharmaceutical Chemistry, Ultra College of Pharmacy, Madurai.
Place: Madurai Prof. K. R. ARUMUGAM,
Head of Institution,
Acknowledgement
This is an effort not by me but my parents, a dream visualized by them to see me excel.
Firstly I thank to almighty god for showering his blessing on me and giving me the strength to carry out the present work with utmost dedication and passion. It is agreat pleasure for me to acknowledge all those who have contributed towards the conception, origion and nurturing of this project.
With profound sense of gratitude and humbleness I express my most sincere thanks to my respected teacher and guide. I consider my self lucky to work under the guidance of Dr. K G Lalitha, H. O. D & Professor, Dept. of Pharmaceutical Chemistry, Ultra College of Pharmacy, Madurai. I will always cherish her discipline, principles, simplicity and provision of fearless work environment; I express my sincere thanks to her for her thought-provoking discussions, meticulous guidance, never-ending enthusiasm and support.
I am grateful to correspondent, Prof. K. R. Arumugam Chirman, Ultra Trust Madurai, Dr. C. Vijaya Dean Department of pharmacology, Dr. A. Babu Thandapani,
Ultra College of Pharmacy, Madurai, for providing the necessary infrastructure and support to carry out the project work.
I extend my sincere thanks to the Doctoral committee members Prof. KR Arumugam Head of the Institution, Ultra College of Pharmacy, Madurai. and Dr. V.S. Saravana Prof. Erode college of Pharmacy, Erode. and Principle Arulmigu
Kalasalingam College of Pharmacy Virudhunagar.
I extend My sincere thanks to all teaching and non-teaching staff members of Ultra college of Pharmacy, Madurai, for their co-operation in various aspects of my study.
I am very grateful to Dr. sridhar, and Dr. Ravi Spectrum Pharma.spectrum Pharma, Hyderabad. for their Support for helping me to solve my queries as and when needed and to guidance during my research work.
I am highly obliged to extend my grateful thanks to SL Drug and Pharma Ltd., Hyderabed, Glenmark Pharmaceuticals Ltd., Icon Biosystem equipments and fine chemicals, Hyderabad for providing me the drug samples without which my project
would not have succeeded.
I pay a mark respect to my beloved family for their love, trust, patience, support and for lifting me up till tis phase of life. My heartful gratitude to my parents, wife Ruchita and my son Mithilesh, my brother Dr. Pravin Patil, my vahini Dr. Aditi Patil,and our sweet shalaka and my sister Sau. Jayashri Gawande and Sau. Manisha Bhutekar for their love care and motivation that I have reached so far in my career.
I am very thankful to my collegues Mr. Harshal Pawar, Mr. Vendatechalam, Mrss. Kalaiselvi, Mr. Kishor, Ms. Anitha Ayre & Mr. Nilesh Khutle who gave me
immense support and help during my project.
I am thankful and grateful to my best friends. K. Sridher Rao, and Mr. Rajender Asst. Professor, Trinity College of Pharmacy, for constant encouragement, moral support throughout my course and being there for me when I needed them the most.
With a great sense of affection, I thank to Nandina and Ramesh Krishana for there Co operational timely help.
Finally I would like to thank everybody who was important to the successful completion of my study, as well as express my apology that I could not mention personally one by one for the mistake I have committed.
Thanks a lot
LIST OF ABBREVIATIONS AND UNITS
RP-HPLC - Reverse Phase High Performance Liquid Chromatography NP-HPLC - Normal Phase High Performance Liquid Chromatography HPTLC - High Performance Thin Liquid Chromatography
TLC - Thin Layer Chromatography
GC - Gas Chromatography
CC - Column Chromatography
PC - Paper Chromatography
GLC - Gas Liquid Chromatography GSC - Gas Solid Chromatography
LC - Liquid Chromatography
LLC - Liquid-Liquid Chromatography LSC - Liquid-Solid Chromatography
UV - Ultra-Violet
IR - Infra-Red Spectroscopy NMR - Nuclear Magnetic Resonance AAS - Atomic Absorption Spectroscopy AES - Atomic Emission Spectroscopy API - Active Pharmaceutical reagent λmax - Maximum wavelength
E (1%, 1cm) - Absorptivity value of 1% conc in 1cmpathlength conc - Concentration
cm - centimeter
µg - Micro-gram
µl - Micro-liter
µm - Micro-meter
nm - Nanometer
ml - Mili-liter
mm - Mili-meter
Fig. - Figure
No. - Number
cGMP - Current Good Manufacturing Practices FDA - Food and Drug Administration
DP - Drug Product
C8 - Octyl
C18 - Octadecyl
ODS - Octadecysilane
PEI - Polyethylamine
v/v - Volumn by volumn
Rf - Retention Factor/ Retardation Factor
ICH - International conference on harminization pKa - Dissociation constant
Ao - Angstrom
Rs - Resolution
°C - Degree centigrade Sr.No. - Serial number
silica gel 60 - Silica gel with 60 pore size in Ao
silica gel 60F - Fluorescent indicator Silica gel with 60 pore size in Ao F254/F366 - Excitation wavelength of fluorescence indicator
USP - United states of pharmacopoeia N - Theoretical Plates
T - Tailing factor
k’ - Capacity factor LOD - Limit of Detection LOQ - Limit of Quantification ppm - Parts per million
v/w - Volumn by weight
DS - Drug Substance
DP - Drug Products
min - Minute
h/hrs - hour
LOS - Losartan Potassium CTD - Chlorthalidone
PROG - Proguanil ACST - Acetylcysteine ACBF - Acebrofylline THF - Tetrahydrofuran ng - Nanogram
Hcl - Hydrochloric acid
NaoH - Sodium hydroxide NMT - Not more than NLT - Not less than L-dopa - Levodopamine
CONTENTS
CHAPTER TITLE PAGE
NO.
1. INTRODUCTION 1-38
2 REVIEW OF LITERATURE 39-67
3 AIMS AND OBJECTIVES 68-69
4 SCOPE AND PLAN OF WORK 70-72
5 MATERIALS AND METHOD 73-126
5.1 Development of HPLC methods 76-96
5.2 Developed HPLC methods are validated as per ICH/USP 97-99
5.3 Forced degradation study at different stress conditions 99-100
5.4 Development of UV Spectrophotometric methods 101-104
5.5 Developed UV Spectrophotometric methods are validated as per ICH/USP guidelines
104-105
5.6 Development of HPTLC methods 105-108
5.7 Developed HPTLC methods are validated as per ICH guidelines for Validation parameter
108-119
5.8 Development of HPTLC Methods for Herbal drug Analysis
119-126
6 RESULTS AND DISCUSSION 127-216
7 SUMMARY AND CONCLUSION 217-223
8 BIBLIOGRAPHY/REFRANCES
9 APPENDIX-I DRUG PROFILE
APPENDIX-II PUBLISHED PAPERS
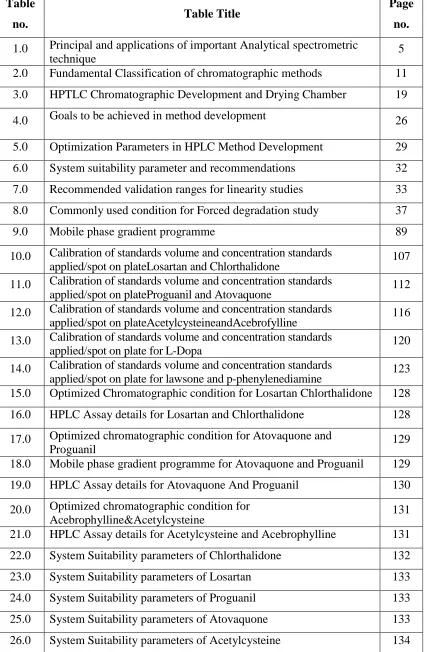
LIST OF TABLES
Table
no. Table Title
Page
no.
1.0 Principal and applications of important Analytical spectrometric
technique 5
2.0 Fundamental Classification of chromatographic methods 11 3.0 HPTLC Chromatographic Development and Drying Chamber 19
4.0 Goals to be achieved in method development 26
5.0 Optimization Parameters in HPLC Method Development 29 6.0 System suitability parameter and recommendations 32 7.0 Recommended validation ranges for linearity studies 33 8.0 Commonly used condition for Forced degradation study 37
9.0 Mobile phase gradient programme 89
10.0 Calibration of standards volume and concentration standards
applied/spot on plateLosartan and Chlorthalidone 107 11.0 Calibration of standards volume and concentration standards
applied/spot on plateProguanil and Atovaquone 112 12.0 Calibration of standards volume and concentration standards
applied/spot on plateAcetylcysteineandAcebrofylline 116 13.0 Calibration of standards volume and concentration standards
applied/spot on plate for L-Dopa 120
14.0 Calibration of standards volume and concentration standards
applied/spot on plate for lawsone and p-phenylenediamine 123 15.0 Optimized Chromatographic condition for Losartan Chlorthalidone 128 16.0 HPLC Assay details for Losartan and Chlorthalidone 128 17.0 Optimized chromatographic condition for Atovaquone and
Proguanil 129
18.0 Mobile phase gradient programme for Atovaquone and Proguanil 129 19.0 HPLC Assay details for Atovaquone And Proguanil 130 20.0 Optimized chromatographic condition for
Acebrophylline&Acetylcysteine 131
21.0 HPLC Assay details for Acetylcysteine and Acebrophylline 131 22.0 System Suitability parameters of Chlorthalidone 132
23.0 System Suitability parameters of Losartan 133
24.0 System Suitability parameters of Proguanil 133
25.0 System Suitability parameters of Atovaquone 133
[image:12.595.106.533.105.757.2]27.0 System Suitability parameters of Acebrofylline 134 28.0 Linearity data forChlorthalidone and Losartan 135
29.0 Linearity data forProguanil and Atovaquone 136
30.0 Linearity data forAcetylcysteine and Acebrofylline 137
31.0 Accuracy data forChlorthalidone 138
32.0 Accuracy data forLosartan 139
33.0 Accuracy data forProguanil 139
34.0 Accuracy data forAtovaquone 139
35.0 Accuracy data forAcetylcysteine 140
36.0 Accuracy data forAcebrofylline 140
37.0 Precision data forChlorthalidone and Losartan 141
38.0 Precision data forProguanil and Atovaquone 141
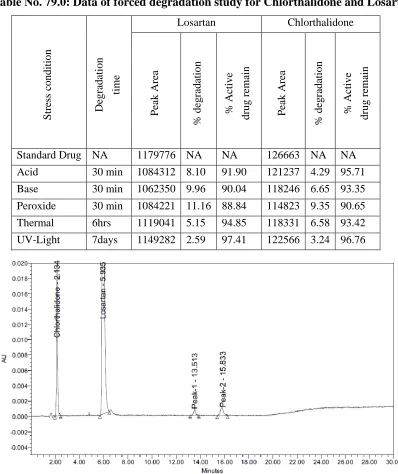
59.0 Mobile Phase Composition change (-2%) data for Proguanil 151 60.0 Mobile Phase Composition change (-2%) data for Atovaquone 152 61.0 Mobile Phase Composition change (+2%) data for Proguanil 152 62.0 Mobile Phase Composition change (+2%) data for Atovaquone 152 63.0 Column Temperature change (-5º) data for Proguanil 153 64.0 Column Temperature change (-5º) data for Atovaquone 153 65.0 Column Temperature change (+5º) data for Proguanil 153 66.0 Column Temperature change (+5º) data for Atovaquone 154 67.0 Flow Rate change (-0.1ml) data for Acetylcysteine 154 68.0 Flow Rate change (-0.10ml) data for Acebrofylline 154 69.0 Flow Rate change (+0.10ml) data for Acetylcysteine 155 70.0 Flow Rate change (+0.10ml) data for Acebrofylline 155 71.0 Mobile Phase Composition change (-2%) data for Acetylcysteine 155 72.0 Mobile Phase Composition change (-2%) data for Acebrofylline 156 73.0 Mobile Phase Composition change (+2%) data for Acetylcysteine 156 74.0 Mobile Phase Composition change (+2%) data for Acebrofylline 156 75.0 Column Temperature change (-5º) data for Acetylcysteine 157 76.0 Column Temperature change (-5º) data for Acebrofylline 157 77.0 Column Temperature change (+5º) data for Acetylcysteine 158 78.0 Column Temperature change (+5º) data for Acebrofylline 158 79.0 Data of forced degradation study for Chlorthalidone and Losartan 160 80.0 Data of forced degradation study for Atovaquone and Proguanil 163 81.0 Data of forced degradation study for Acetylcysteine and
Acebrophylline 166
82.0 UV Spectrophotometric assay Results for Losartan and Chlorthalidone 170 83.0 UV Spectrophotometric assay Results for Atovaquone and Proguanil 171 84.0 UV Spectrophotometric assay Results for Acebrophylline and
Acetylcysteine 172
85.0 UV Spectroscopy Data for Losartan and Chlorthalidone 173 86.0 UV Spectroscopy Data for Atovaquone and Proguanil 174 87.0 UV Spectroscopy Data for Acetylcysteine and Acebrofylline 176 88.0 UV Spectroscopy Accuracy Data for Chorthalidone 177
89.0 UV Spectroscopy Accuracy Data for Losartan 178
91.0 UV Spectroscopy Accuracy Data for Atovaquone 178 92.0 UV Spectroscopy Accuracy Data for Acetylcysteine 179 93.0 UV Spectroscopy Accuracy Data for Acebrofylline 179 94.0 UV Spectroscopy Precision Data for Losartan and Chlorthalidone 180 95.0 UV Spectroscopy Precision Data for Proguanil and Atovaquone 180 96.0 UV Spectroscopy Precision Data for Acetylcysteine and
Acebrofylline 181
97.0 UV Spectroscopy LOD and LOQ Data for Losartan &Chlorthalidone 181 98.0 UV Spectroscopy LOD and LOQ Data for Proguanil and
Atovaquone 182
99.0 UV Spectroscopy LOD and LOQ Data for
AcetylcysteineandAcebrofylline 182
100.0 UV Summary of Results for selected Combinations 183 101.0 HPTLC Optimized Chromatographic Condition for chlorthalidone
and losartan 185
102.0 HPTLC Assay Results for LOS &CTD 186
103.0 HPTLC Optimized Chromatographic Condition for Atovaqvone and
proguanil 188
104.0 HPTLC Assay Results for ATOV and PROG 189
105.0 HPTLC Optimized Chromatographic Condition for acetylcysteine
and acebrofylline 190
106.0 HPTLC Assay Results for ATOV and PROG 191
107.0 HPTLC Calibration data for Chlorthalidone 192
108.0 HPTLC Calibration data for Losartan 192
109.0 HPTLC Calibration data for Atovaquone 194
110.0 HPTLC Calibration data for proguanil 194
111.0 HPTLC Calibration data for Acetylcysteine 196
112.0 HPTLC Calibration data for Acebrofylline 196
113.0 Results from recovery studies of Losartan and Chlorthalidone 198 114.0 Results from recovery studies of Atovaquone and Proguanil 199 115.0 Results from recovery studies of Acetylcysteine and Acebrofylline 199
116.0 Results from recovery studies of L Dopa 199
121.0 HPTLC Intra-Day and Inter-Day study of proguanil 202 122.0 HPTLC Intra-Day and Inter-Day data of acetylcysteine 202 123.0 HPTLC Intra-Day and Inter-Day data of acebrofylline 203 124.0 HPTLC Robustness data of Chlorthalidone and Losartan 203 125.0 HPTLC Robustness data ofAtovaquone and Proguanil 204 126.0 HPTLC Robustness data of Acetylcysteine and Acebrofylline 204
127.0 HPTLC Calibration data for L-dopa 207
128.0 HPTLC Peak Area of L- Dopa for standard and sample 208 129.0 HPTLC Intra-Day and Inter-Day Data of L Dopa 210
130.0 HPTLC Calibration data for Lawsone 212
131.0 HPTLC Calibration data for p-Phenylenediamine 212 132.0 HPTLC Assay of lawsone and p-Phenylenediamine in herbal
formulation 214
LIST OF FIGURES
Figure no. Figure Title Page
no.
1.0 λmax of two absorbing drugs x and y 7
2.0 First, second, third and fourth derivatives of a Gaussian band. 8
3.0 Steps involved in HPTLC 16
4.0 Camag Nanomat automatic apllicator 18
5.0 Steps involved in scrapping and elution 21
6.0 A Flow Chart of HPLC Method Development 24
7.0 Parameters used for the validation of analytical method 31 8.0 Flow chart for different stress conditions used for the
degradation of drug substance and drug products.
37 9.0 Trial 1 chromatograms for losartan and chlorthalidone 78 10.0 Trial 2 chromatograms for losartan and chlorthalidone 79 11.0 Trial 3 chromatograms for losartan and chlorthalidone 80 12.0 Trial 4 chromatograms for losartan and chlorthalidone 81 13.0 Trial 5 chromatograms for losartan and chlorthalidone 82 14.0 Trial 1 chromatogram for Proguanil and Atovaquone 84 15.0 Trial 2 chromatogram for Proguanil and Atovaquone 85 16.0 Trial 3 chromatogram for Proguanil and Atovaquone 86 17.0 Trial 4 chromatogram for Proguanil and Atovaquone 87 18.0 Trial 5 chromatogram for Proguanil and Atovaquone 88 19.0 Trial 6 chromatogram for Proguanil and Atovaquone 89 20.0 Trial 1 chromatogram for Acebrophylline and Acetylcysteine 91 21.0 Trial 2 chromatogram for Acebrophylline and Acetylcysteine 92 22.0 Trial 3 chromatogram for Acebrophylline and Acetylcysteine 93 23.0 Trial 4 chromatogram for Acebrophylline and Acetylcysteine 94 24.0 Trial 5 chromatogram for Acebrophylline and Acetylcysteine 95 25.0 HPLC Chromatogram for Losartan Chlorthalidone 128 26.0 HPLC Chromatogram for Atovaquone And Proguanil 130 27.0 HPLC Chromatogram for Acetylcysteine and Acebrofylline 131
28.0 HPLC Calibration Curve for Chlorthalidone 135
30.0 HPLC Calibration Curve for Atovaquone 136
31.0 HPLC Calibration Curve for Proguanil 137
32.0 HPLCCalibration Curve for Acebrofylline 137
33.0 HPLCCalibration Curve for Acetylcysteine 138
34.0 Specificity for Chlorthalidone and Losartan 142
35.0 Specificity for Proguanil and Atovaquone 142
36.0 Specificity for Acetylcysteine and Acebrofylline 143 37.0 Acid degraded chromatogram for Losartan and Chlorthalidone 160 38.0 Base degraded chromatogram for Losartan and Chlorthalidone 161 39.0 Peroxide degraded chromatogram for Losartan and Chlorthalidone 161 40.0 Thermal degraded chromatogram for Losartan and Chlorthalidone 162 41.0 Photo degraded chromatogram for Losartan and Chlorthalidone 162 42.0 Acid degraded chromatogram for Atovaquone and Proguanil 163 43.0 Base degraded chromatogram for Atovaquone and Proguanil 164 44.0 Peroxide degraded chromatogram for Atovaquone and
Proguanil
164
45.0 Thermal degraded chromatogram for Atovaquone and Proguanil
165 46.0 Photo degraded chromatogram for Atovaquone and Proguanil 165 47.0 Acid degraded chromatogram for Acetylcysteine and
Acebrophylline
166
48.0 Base degraded chromatogram for Acetylcysteine and Acebrophylline
167
49.0 Peroxide degraded chromatogram for Acetylcysteine and Acebrophylline
167
50.0 Thermal degraded chromatogram for Acetylcysteine and Acebrophylline
168
51.0 Photo degraded chromatogram for Acetylcysteine and Acebrophylline
168 52.0 Overlay spectra of Losartan and Chlorthalidone 169
53.0 Overlay spectra of Atovaquone and Proguanil 170
54.0 Overlay spectra of Acebrophylline and Acetylcysteine 172
55.0 UV Calibration Curve for Losartan 173
56.0 UV Calibration Curve for Chlorthalidone 174
57.0 UV Calibration Curve for Proguanil 175
58.0 UV Calibration Curve for Atovaquone 175
60.0 UV Calibration Curve for Acebrofylline 177 61.0 HPTLC Overlay spectra of chlorthalidone and losartan 185 62.0 Chromatogram of mixed calibration standards of chlorthalidone
and losartan.
186
63.0 Representative chromatogram of chlorthalidone (Rf 0.26) and losartan (Rf 0.37)
186
64.0 Chromatogram of mixed calibration standards of Atovaqvone and proguanil
188
65.0 Representative chromatogram of Atovaqvone (Rf 0.78) and proguanil (Rf 0.36)Acetylcysteine and Acebrofylline
189 66.0 HPTLC Overlay spectra of Acetylcysteine and Acebrofylline 190 67.0 Representative chromatogram of acetylcysteine (Rf 0.37) and
acebrofylline (Rf 0.26)
191
68.0 HPTLC Calibration curve for Chlorthalidone 193
69.0 HPTLC Calibration curve for Losartan 193
70.0 HPTLC Calibration curve for Atovaquone 195
71.0 HPTLC Calibration curve for Proguanil 195
72.0 Representative chromatogram of mixed calibration standards 197
73.0 HPTLC Calibration curve for Acetylcysteine 1977
74.0 HPTLC Calibration curve for Acebrofylline 198
75.0 HPTLC Calibration plot for L-Dopa 207
76.0 Typical HPTLC chromatogram of L dopa in standard 208 77.0 Typical HPTLC chromatogram of L dopain sample (methanolic
extract of Zandopa powder
209 78.0 HPTLC Overlay spectral display for STD and sample 209
79.0 HPTLC Calibration curve for lawsone 213
80.0 HPTLC Calibration curve for p-phenylenediamine 213 81.0 HPTLC Chromatogram for calibration plot of lawsone and PPD 214 82.0 Representative chromatogram of lawsone (Rf 0.82) and
p-phenylenediamine(Rf 0.34)
CHAPTER 1 INTRODUCTION
ULTRA COLLEGE OF PHARMACY, MADURAI 1
1. INTRODUCTION
The quality is important in every product or service but it is more vital in medicine as it involves life. As a matter of fact, quality is built in from the time of inception of the thought to make a product, to the time it is finally made and sent out. The assurance of the quality together with their careful control are our moral obligations arising from the humanism towards the seek human beings. Analytical chemistry is mainly concerned with determining the qualitative and quantitative composition of material under study. Analytical monitoring of pharmaceutical products, or of specific ingredients within the product, is necessary to ensure its safety and efficacy throughout all phases of its shelf life, including storage, distribution, and use1,2.
Analytical chemistry, or the art of recognizing different substances and determining their constituents, occupies a prominent position among the applications of science3. The development in analytical sciences has been more significant and prominent in recent years than the past and has broadened our vistas to develop new methods of analysis. Pharmaceutical Analysis is the branch of Pharmacy, which is responsible for developing sensitive, reliable and more accurate methods for the estimation of drugs in pharmaceutical dosage forms and in biological system4,1. Drug analysis involves identification, characterization and determination of drugs in dosage forms and biological fluids and which play an important role in the different steps of development, manufacture and therapeutic use of drug5.
CHAPTER 1 INTRODUCTION
ULTRA COLLEGE OF PHARMACY, MADURAI 2
1.1 Multicomponent drug formulations
Nowadays, the pharmaceutical dosage forms of combinational drugs are very much useful in multiple therapies rather than the use of single drug formulations because of
• Multiple actions
• Synergistic effect/additive effect
• Economy in productions, distribution and use
• Fewer side effects
• Quicker relief
• Smaller doses of individual drugs avoided
• Easy for storage and carrying
• Convenient for the patients to take single multicomponent tablet instead of two or three different tablets for multitherapies.
Thus, the manufacturing trends have been changed to manufacture more and more complex formulation containing several drugs with very similar chemical behavior. It is a quite easy way for medical practioner to write the prescriptions as well as to give instructions to the patients and simultaneously it is very convenient for the patient to take the medicine without missing their doses. To device an accurate estimation procedure for each ingredient of such multicomponent dosage form containing several therapeutically active drugs is not an easy task, as they are present in widely divergent concentrations and contains additives. The presence of additives, excipients and decomposition products further complicates the development of analytical procedures8.
1.2 Modern Analytical Methods
Development of the modern analytical methods for the determination of multocomponent drugs in different dosage forms is very essential because of the various reasons like9
- New drug combinations are not official in Pharmacopoeias.
- Problems with the interferences of other drug as well as excipients. - No simple, accurate and precise analytical methods are available for
quantifications.
CHAPTER 1 INTRODUCTION
ULTRA COLLEGE OF PHARMACY, MADURAI 3
- Available methods are quite tedious, costly and time consuming methods for drug separations and their extractions.
Modern analytical methods are generally classified into instrumental and non-instrumental category. By using instrument, measurement of some physical property is made to determine the contents or composition of a substance.It involves chemical colour reactions, solubility, and physical constants like refractive index, melting point, optical rotation, and instrumental techniques like IR, NMR, UV, AAS, AES, and Mass spectroscopy. While in non-instrumental methods, the conventional physicochemical properties are used to analyze the sample. The non-instrumental methods which are primarily based upon the measurement of the mass and volume includes the techniques of volumetric and gravimetric analysis.
The instrumental methods are based upon the measurement of some physical property of substance to determine its chemical composition and structures. Physical properties of substance may be specific or non specific but by converting their signals into units which are used for determination of structure and the concentrations.
Instrumental methods are mostly employed for the estimation of the drug in their formulations includes Spectroscopic method like UV-visible, Fluorimetry, Flame photometry, NMR, IR which are used to measure the electromagnetic radiations which is either absorbed or emitted by the sample as a function of drug concentrations utilized for qualitative and quantitative analysis.
CHAPTER 1 INTRODUCTION
ULTRA COLLEGE OF PHARMACY, MADURAI 4
Advantages of Instrumental methods
- A small quantity of sample is required - Estimation of drug is fast
- Complex mixture can be analyzed
- Separation, qualification and quantifications are simultaneously possible in chromatography
1.2.1 Modern Analytical Spectroscopy
A spectrometric technique from the largest and most important single group of techniques used in analytical chemistry provides a wide range of quantitative and qualitative information.
All spectrometric techniques depend on the emission, scattered or absorption of electromagnetic radiation. This absorption, emission or scattered light radiation is associated with changes in the energy states of the interacting chemical species and since each species has characteristic energy states within an atomic or molecular system9.
The set of energy levels associated with a particular substance is a unique characteristic of that substance and determines the frequencies at which electromagnetic radiation can be absorbed or emitted.
Qualitative information regarding the composition and structure of a sample is obtained through a study of the positions and relative intensities of spectral lines or bands.
CHAPTER 1 INTRODUCTION
ULTRA COLLEGE OF PHARMACY, MADURAI 5
Table No 1.0: Principal and Applications of important Analytical spectrometric technique
Name of technique Principle Major applications
Flame photometry, plasma
emission spectrometry, Atomic emission
Qualitative and Quantitative determination of metals, largely as minor or trace constituents
X-ray Fluroscence spectrometry, atomic fluorescence spectrometry Atomic fluorescence emission
Quantitative determination of metals at minor or trace constituents
Atomic absorption spectrometry
Atomic absorption
Quantitative determination of metals as minor or trace constituents
UV-Visible spectrometry,
Infrared spectrometry Molecular absorption
Quantitative determination of elements and compounds, mainly as trace and minor constituents Identification and structural analysis of organic compounds
NMR spectrometry Nuclear absorption
Identification and structural analysis of organic compounds
Mass spectrometry
Structural fragmentation or ionization of atoms
Identification and structural analysis of organic
compounds
Spectrophotometric Methods For Estimation Of Drugs6,10
UV-Visible Spectrophotometry is the absorption spectroscopy in which the organic molecules are analysed by their absorption characteristics of UV or visible radiation resulting in the electronic transition from singlet ground state to singlet excited state accompanied with vibrational and rotational transitions. This transition occurs when the energy of absorption is equal to the difference in the energy between the two states. Most commonly employed spectrophotometric technique includes ultraviolet, visible, infrared and atomic absorption spectrophotometry. There are various methods employed for the single and multicomponent analysis. The basis of single component analysis-
CHAPTER 1 INTRODUCTION
ULTRA COLLEGE OF PHARMACY, MADURAI 6
2) A standard calibration curve is plotted using series of standard solutions as concentrations against absorbance and the concentration of the sample is determined from the graph.
3) Establishing absorptivity values E (1%, 1cm) for standard at selected wavelength (λmax) in particular solvents.
The basis of multicomponent samples analysis is the property that at all wavelengths is the absorbance of solution is the sum of absorbances of the individual components or the measured absorbance is the difference between the total absorbance of the solution in sample cell and that of the solution in the reference (blank) cell.
Multicomponent analysis is carried out by following methods
1. Simultaneous equation method or Vierodts method 2. Derivative spectrophotometric method
3. Difference spectrophotometric method 4. Geometric correction method
5. Absorbance ratio method 6. Orthogonal polynomial method 7. Absorbance correction method
Simultaneous equation method or Vierodts methods
If sample contains two absorbing drugs (x and y) each of this absorbs at the λmax of the other as shown in Fig. No. 1.0. It may be possible to determine both the drugs by the techniques of simultaneous equation methods provided that
- Two absorbing drugs (x and y), each of this absorbs at the λ max of the other - The λ max of two drugs should be reasonably dissimilar.
CHAPTER 1 INTRODUCTION
ULTRA COLLEGE OF PHARMACY, MADURAI 7
Fig. No.1.0: λmax absorption of two drugs (x and y)
The two equations are constructed based on the fact at λ1 and λ2 the absorbance of mixture is sum of individual absorbances x and y.
At λ1 A1 = ax1.BCx + ay1.bCy ---(1)
At λ2 A2 = ax2.BCx + ay2.bCy ---(2)
Rearranging equation (1) and (2) gives, A2.ay1 - A1.ay2
Cx =
ax2.ay1 – ax1.ay2
and
A1.ax2 - A2.ax1
Cy =
ax2.ay1 – ax1.ay2
where, Cx and Cy are concentrations of x and y respectively,
ax1 and ax2 are absorptivities of x at λ1 and λ2 respectively
ay1 and ay2 are absorptivities of y at λ1 and λ2 respectively
A1and A2 are absorbances of diluted mixture at λ1 and λ2 respectively. Derivative spectrophotometric method
When the sample of drug shows large irrelevant absorption, then this method is very useful. This method involves conversion of normal spectrum to its first, second and higher derivative spectrum.
Derivative spectra can be used to clarify absorption bands in more complex UV spectra. The technique is used extensively in rapidly developing field of near infrared spectroscopy and can also be applied in the determination of the purity of chromatographic peaks where when they are monitored by diode array detection. The main effect of derivatisation is to remove underlying broad absorption bands where
S p e ct r a o f C o m p o u n d 1 S p e ct r a o f C o m p o u n d 2
W a v e le n g t h A
b s o rb a n c e
CHAPTER 1
ULTRA COLLEGE OF PHARMACY, MADURAI
there is only a gradual change in slope. The first derivative spectrum is obtained by plotting for instance the slopes of 2 nm segments of the spectrum, and this res
shown for a Gaussian band in the below
at the maximum of the peak and the slope is maximum at approximately half the peak height. In the second derivative spectrum the slopes of adjacent 2 nm segments compared and this gives the points of maximum curvature of the spectum. The rate of curvature of a spectrum has its greatest negative value at its maximum and the greatest rates of curvature are observed for narrow absorption bands.
Fig.No. 2.0: First, second, third and fourth derivatives of a Gaussian band.
Difference spectrophotometric method
The essential feature of a difference spectrophotometric assay is that the measured value is the difference absorbance (∆
the analyte in different chemical forms which exhibit different spectral characteristics. The criteria for applying difference spectrophotometry to the assay of a substance in the presence of other absorbing substance are
- Reproducible changes may be induced in the spectrum of the analyte by the addition of one or more reagents.
ULTRA COLLEGE OF PHARMACY, MADURAI
there is only a gradual change in slope. The first derivative spectrum is obtained by plotting for instance the slopes of 2 nm segments of the spectrum, and this res
ssian band in the below Fig.No.2.0. In this spectrum
at the maximum of the peak and the slope is maximum at approximately half the peak height. In the second derivative spectrum the slopes of adjacent 2 nm segments compared and this gives the points of maximum curvature of the spectum. The rate of curvature of a spectrum has its greatest negative value at its maximum and the greatest rates of curvature are observed for narrow absorption bands.
rst, second, third and fourth derivatives of a Gaussian band.
spectrophotometric method
The essential feature of a difference spectrophotometric assay is that the measured value is the difference absorbance (∆A) between two equimolar solutions of the analyte in different chemical forms which exhibit different spectral characteristics. teria for applying difference spectrophotometry to the assay of a substance in the presence of other absorbing substance are
Reproducible changes may be induced in the spectrum of the analyte by the addition of one or more reagents.
INTRODUCTION
8 there is only a gradual change in slope. The first derivative spectrum is obtained by plotting for instance the slopes of 2 nm segments of the spectrum, and this results as In this spectrum the slope is zero at the maximum of the peak and the slope is maximum at approximately half the peak height. In the second derivative spectrum the slopes of adjacent 2 nm segments are compared and this gives the points of maximum curvature of the spectum. The rate of curvature of a spectrum has its greatest negative value at its maximum and the greatest rates of curvature are observed for narrow absorption bands.
rst, second, third and fourth derivatives of a Gaussian band.
The essential feature of a difference spectrophotometric assay is that the ∆A) between two equimolar solutions of the analyte in different chemical forms which exhibit different spectral characteristics. teria for applying difference spectrophotometry to the assay of a substance in
CHAPTER 1 INTRODUCTION
ULTRA COLLEGE OF PHARMACY, MADURAI 9
- The absorbance of the interfering substances is not altered by the reagents.
Geometric correction method
A number of mathematical correction procedures have been developed which reduce or eliminate the background irrelevant absorption that may be present in the sample of biological origin. The simplest of these procedures is the three point’s geometric procedure which may be applied if the irrelevant absorption is linear at the three wavelengths selected.
Absorbance ratio method
This method is a modification of the simultaneous equation method. It depends on the property that, for a substance that obeys the beers law at all wavelengths. The ratio of absorbance at any two wavelengths is a constant value independent of concentration or path length.
Orthogonal polynomial method
The technique of orthogonal polynomial method is another mathematical correction procedure which involves complex calculation. The basis of this method is that an absorption spectrum may be represented in terms of orthogonal function as follows:
A(λ) = P0P0 + P1P1(λ) + P2P2(λ) + ---PnPn(λ)
where ‘A’ denotes the absorbance at wavelength belonging to set of n+1 equally spaced wavelength at which the orthogonal polynomials P0(λ), P1(λ), P2(λ) ---
Pn(λ) are each defined.
Absorbance correction method
It is also a modification of simultaneous equation method where quantitative determination of one drug carried out by E (1%, 1cm) value and quantification of other drug carried out by subtracting absorption due to interfering drug using absorption factor. This method includes following steps:
- Selection of wavelength - Study of beers-lamberts law - Study of additivity of substance
- Determination of absorptivity E (1%, 1cm) value - Estimation of drug in laboratory mixture.
CHAPTER 1 INTRODUCTION
ULTRA COLLEGE OF PHARMACY, MADURAI 10
1.2.2 Chromatography
Chromatography is a very specialized, yet widely applicable technique of separation science by which one can effectively separate chemically similar substances in complex mixtures. There are three distinct physical methods for attaining separation, yet all are characterized by their common application of a stationary and a mobile phase.
The stationary phase provides the chemical surface, which interacts with the components of the mixture to be separated. The difference in the chemistry of these components results in various degrees of molecular bonding or entrapment to the stationary phase. If the mixture is carried across a bed of stationary phase by some mobile phase, the molecules experiencing the least interaction with the stationary phase will tend to advance more quickly than those retained on the bed by stronger molecular interactions. This results in the separation of similar species as influenced by differences in migration rates across the stationary bed. The three distinct separation strategies are-
-Frontal chromatography- The mobile phase is the sample mixture, and as the sample migrates down the separation bed, the least retained species are concentrated near the leading edge.
-Displacement chromatography- A sample mixture is applied to one end of a stationary phase, and then a mobile phase is introduced. The mobile phase selectively binds to the stationary phase competing for the same binding sites as the sample. Separation is established as a relative function of the intermolecular interactions of the sample and mobile-phase species with the stationary phase.
-Elution chromatography- A sample mixture is applied to one end of a stationary phase, which may already contain mobile phase. The mobile phase does not interact significantly with the stationary phase and only carries the sample mixture through the stationary bed. The differences in selective binding of sample mixture components with the stationary phase retard migration of some species so that separation occurs. This is the most analytically useful form of chromatography due to its tremendous power of separation of very similar species11.
CHAPTER 1
ULTRA COLLEGE OF PHARMACY, MADURAI phase are brought into contact. In
held in a narrow tube through which the mobile phase is forced under pressure. It includes CC, GC, and HPLC. In
supported on a flat plate or in the interstices of a paper; here, the mobile phase moves through the stationary phase by capillary action or under the influence of gravity. It includes TLC, HPTLC and PC. A m
chromatographic method is one based upon the types of mobile and stationary phases as shown in Table No. 2.0
Table No. 2.0: Fundamental Classification of chromatographic methods
1.2.3 High Performance Liquid Chromatography
High performance liquid chromatography is also named as high pressure liquid chromatography since it provides varieties of features like
1. High resolving power 2. Speedy separation
3. Continuous monitoring of the column effluent 4. Accurate quantitative m
5. Repetitive and reproducible analysis using the same column 6. Automation of the analytical procedure and data handling 7. Suitability for the nonvolatile species or thermally fragile ones 8. Highly sensitive due to availability of various detectors
9. Choice of mobile phases and ULTRA COLLEGE OF PHARMACY, MADURAI
phase are brought into contact. In column chromatography, the stationary phase is held in a narrow tube through which the mobile phase is forced under pressure. It includes CC, GC, and HPLC. In planner chromatography, the stationary phase is supported on a flat plate or in the interstices of a paper; here, the mobile phase moves through the stationary phase by capillary action or under the influence of gravity. It includes TLC, HPTLC and PC. A more fundamental classification of chromatographic method is one based upon the types of mobile and stationary phases
shown in Table No. 2.0
Fundamental Classification of chromatographic methods
High Performance Liquid Chromatography12-13 (HPLC)
High performance liquid chromatography is also named as high pressure liquid chromatography since it provides varieties of features like-
High resolving power Speedy separation
Continuous monitoring of the column effluent Accurate quantitative measurement
Repetitive and reproducible analysis using the same column Automation of the analytical procedure and data handling Suitability for the nonvolatile species or thermally fragile ones Highly sensitive due to availability of various detectors
ce of mobile phases and wider stationary phases
INTRODUCTION
11 the stationary phase is held in a narrow tube through which the mobile phase is forced under pressure. It , the stationary phase is supported on a flat plate or in the interstices of a paper; here, the mobile phase moves through the stationary phase by capillary action or under the influence of gravity. It ore fundamental classification of chromatographic method is one based upon the types of mobile and stationary phases
Fundamental Classification of chromatographic methods
(HPLC)
High performance liquid chromatography is also named as high pressure
CHAPTER 1 INTRODUCTION
ULTRA COLLEGE OF PHARMACY, MADURAI 12
The different types of liquid chromatography are classified based on the mechanism of separation involved. The various mechanism of separation includes adsorption, partition, ion exchange, ion pair, size exclusion and affinity. For solute having molecular weights greater than 10,000, exclusive chromatography and reversed phase partition chromatography are used. For the lower molecular weight ionic species ion- exchange chromatography is widely used. Small polar but non ionic species are best handled by partition method. Adsorption chromatography is often chosen for separating non-polar species, structural isomers, and compound classes such as aliphatic hydrocarbon from aliphatic alcohols.
Adsorption chromatography or Liquid Solid Chromatography (LSC)
Liquid solid chromatography is based on interaction between the solute and fixed active sites on finely divided solid adsorbents used as a stationary phase. The adsorbent generally packed in a column or spread over plate which provides high surface area e.g. Silica gel, Alumina, or charcoal also used but most commonly silica gel is used. Highly active adsorbents may give rise to irreversible solute adsorption so, may not be suitable, silica gel, which is slightly acidic may strongly retain basic compounds, whereas alumina non acid wash is basic and should not be used for the chromatography of base sensitive compounds. Adsorbents of varying partial size generally 5µm are commercially used. The role of the solvent in LSC is vital since a mobile phase molecule competes with solute molecules for polar adsorption sites. The stronger the interaction between the mobile phase and stationary phase, weaker solute adsorption, and vice versa. The classification of solvents according to their strength of adsorption is called an eluotropic series which may be used as a guide to find the optimum solvent strength for a particular separation. In general, the compounds best separated by LSC are those which are soluble in organic solvents and non ionic.
Partition chromatography or Liquid-liquid chromatography (LLC)
CHAPTER 1 INTRODUCTION
ULTRA COLLEGE OF PHARMACY, MADURAI 13
separated by non polar phases, and polar materials requires stationary phases that are even molar polar. Hence it is convenient to divide LLC into two categories, based on the relative polarities of the stationary and mobile phases.
- Normal phase HPLC - Reverse phase HPLC
Normal phase HPLC
In NP-HPLC the Polar stationary phase and non-polar mobile phase is used. In this technique, non-polar compounds travel faster and are eluted first. This is because of the lower affinity between the non-polar compounds and the stationary phase. Polar compounds are retained for longer times because of their higher affinity with the stationary phase. These compounds, therefore take more times to elute. Normal phase mode of separation is therefore, not generally used for pharmaceutical applications because most of the drug molecules are polar in nature and hence take longer time to elute.
Reversed phase HPLC
RP-HPLC is the most popular mode for analytical and preparative separations of compound of interest in chemical, biological, pharmaceutical, food and biomedical sciences. In this mode, the stationary phase is non-polar hydrophobic packing with octyl or octadecyl functional group bonded to silica gel and the mobile phase is polar solvent.
An aqueous mobile phase allows the use of secondary solute chemical equilibrium (such as ionization control, ion suppression, ion pairing and complexation) to control retention and selectivity. The polar compound gets eluted first in this mode and nonpolar compounds are retained for longer time. As most of the drugs and pharmaceuticals are Polar in nature, they are not retained for longer times and hence elute faster. The different columns used are ODS or C18, C8, C4, etc., (in the order of increasing polarity of the stationary phase).
Ion exchange chromatography
CHAPTER 1 INTRODUCTION
ULTRA COLLEGE OF PHARMACY, MADURAI 14
Natural ion exchangers, such as clays and zeolites, have been recognised and used for several decades. Synthetic ion exchange resins were first produced in the mid-1930s for water softening, water deionization, and solution purification. The most common active sites for cation-exchange resins are the sulfonic acid group-SO3H, a strong acid, and the carboxylic acid group-COOH, a weak acid. Anionic
exchanger contains tertiary amine groups-N (CH3) OH- or primary amine
groups-NH3OH, the former is strong base and latter is weak one. Ion pair chromatography
Ion pair chromatography is used for the separation and determination of ionic compounds and this method can also substitute for ion exchange chromatography. The mobile phase in ion phase chromatography consist of an aqueous buffer containing an organic solvents such as methanol or acetonitrile and an ionic compound containing a counter ion of opposite charge to the analyte.
A counter ion is an ion that combines with the analyte ion to form an ion pair which is neutral species that is retained by a reversed-phase packing. Strong acidic and basic compounds may be separated by reversed phase mode by forming ion pairs (columbic association species formed between two ions of opposite electric charge) with suitable counter ions. This technique is referred to as reversed phase ion pair chromatography. Most of the counter ions contain alkyl group to enhance retention of the resulting ion pair on the non popular stationary phase. Elution of the ion pairs is then accomplished with an aqueous solution of methanol or acetonitrile or other water soluble organic solvent.
Size-Exclusion chromatography
CHAPTER 1 INTRODUCTION
ULTRA COLLEGE OF PHARMACY, MADURAI 15
Molecules having diameter that are significantly smaller than the pore can penetrate or permeate throughout the pore maze and are thus entrapped for the greatest time; these are last to be eluted. Between these two extremes are intermediate size molecules whose average penetration into the pores of the packing depends upon their diameters. Within this group fractionation occurs, which is directly related to molecular size and to some extent molecular shape.
Affinity chromatography
It is the most selective of the mechanisms used in chromatography mostly for the separation of biological molecules. Hence it also named as bioaffinity chromatography. It uses highly specific interaction between the immobile phase and solute molecules. These interactions are usually enzyme-substrate, enzyme inhibitor or antibody-antigen reactions, which are highly selective. For example, it is well known that antibodies are extremely specific in their reactions with antigen and can be used in bio-affinity chromatography where an antibody, immobilised on a stationary phase (by covalently binding to it), can react with one protein (antigen) from a mixture containing even several hundred similar protein, binding it to the column. Once the column has been washed to remove all other proteins, the desired substance can be eluted out of the column by changing the ionic strength of the eluent. The fact that certain organic molecules such as synthetic dyes (used in textile) as well as metal ions exhibit selective affinity for biological molecules has been exploited in the form of dye-ligand chromatography and immobilised metal ion chromatography in biotechnology.
1.2.4 High Performance thin layer chromatography14-16 (HPTLC)
This is a sophisticated, advanced, versatile and automated version of the thin layer chromatography. It is the fastest growing technique for the analysis of drugs. Of many chromatographic methods presently available TLC/HPTLC provides the rapid analysis of plant drugs leading to semi quantitative or quantitative information on chief constituents of the formulation. It can provide fingerprinting for monitoring the identity and purity of drug and detection of adulteration or substitution.
CHAPTER 1 INTRODUCTION
ULTRA COLLEGE OF PHARMACY, MADURAI 16
travels slower and are thus retained and those with lesser affinity towards the stationary phase travels faster and are thus eluted earlier. Its main advantages are
• Disposable Pre-coated plates are available
• Minimum technical training required
• Minimum place for working
• Sample components are stored on plate, allowing repeated analysis
• Quantification at micro, nano and picto-gram levels even in complex formulations.
• Multiple samples can be run simultaneously under identical conditions
• Economic than HPLC technique.
Steps involved in HPTLC
Fig. No 3.0: Steps involved in HPTLC
Selection of chromatographic layer
Sorbents: The most commonly used sorbents in pre-coated plates are silica
gel 60, silica gel 60F, silica gel 60F254/F366 aluminium oxide, high purity silica gel 60,
cellulose, PEI impregnated cellulose, chemically modified silica gel including amino, cyano and diol derivative, etc. The pre-coated plates with sorbent thickness of
100-Selection and optimization of mobile phase Pre-washing of pre-coated plates
In-situ pre-chromatographic derivatization Saturation of chamber; pre-conditioning layer
UV-visible/fluorescent Post chromatographic derivatization Selection of sorbent layer
Sample and standard preparations
Application of standard and sample
Chromatographic development
Detection of analytes
Quantitative evaluation
CHAPTER 1 INTRODUCTION
ULTRA COLLEGE OF PHARMACY, MADURAI 17
250 µm are used for qualitative and quantitative analysis. For preparative TLC, sorbent thicknesses of 1-2mm are available in addition to chemical modified layers.
Plates: The plates may be a glass support, polyester (plastic) sheets (0.2mm
thick) or aluminum sheet (0.1 mm thick). Pre-coated HPTLC plates in size of 20×20cm with aluminum or polyester support are usually procured mainly for economic reasons. These can be cut to size and shape to suit particular analysis.
Pre-washing of pre-coated plates
Sorbents with large surface area absorb water vapors and other volatile impurities from laboratories atmosphere leading to non-reproducible results thus necessitates pre-washing. Ascending, dipping and continuous mode are the common pre-washing methods. The plates are then dried for a sufficient time to completely remove the washing liquids.
Activation of pre-coated plates (layer pre-conditioning)
Plates exposed to high humidity may have to be activated in oven at 110-120°C for 30 minutes to remove adsorbed water. Over-activation should be avoided as it leads to sample decomposition.
Sample preparation
The sample preparation procedure is to dissolve the dosage form with complete recovery of intact compound(s) of interest and minimum of matrix with a suitable concentration of analyte (s) for direct application on the HPTLC plate. For normal phase chromatography using silica gel pre-coated plates, non-polar, volatile solvents are used for dissolving samples. In contrast, for RP-HPTLC, polar solvents are used. Steps for sample pre-treatment involve sampling, mechanical crushing, extraction, filtration and enrichment of minor compounds. If necessary, sufficient quantity of sample should be initially cleaned up and should be derivatized before chromatographic development (pre-chromatographic derivatization).
Application of sample
CHAPTER 1
ULTRA COLLEGE OF PHARMACY, MADURAI - Camag Nano
which delivers sample volumes in the range of 500 - Camag Nanomat with a platinum
Fig.No. 4.0: Camag Nanomat automatic apllicator
The small diameter of the sample spots applied in H
of 20-30 sample in a single plate, thus reducing the development time of 20 minutes to 1 minute per sample. This certainly places HPTLC in a competitive position with HPLC in terms of speed of analysis.
Mobile phase optimisation
Mobile phase commonly called solvent system is traditionally selected by controlled process of trial and error. It should be chosen taking into consideration chemical properties of analytes and the sorbent layer. Use of mobile phase containing more than three or four components should normally be avoided as it is often difficult to get reproducible ratios of different components. Solvent composition is expressed by volumes (v/v) and usually sum of total volume is 100.
Chamber pre-conditioning (saturation)
The Chamber should be saturated before the chromatographic development to avoid the evaporation of the solvent mainly from the solvent front thus avoiding larger usage of solvents resulting in lower R
nature and composition of mobile phase and increases with increase in the layer thickness.
Chromatographic development and drying
ULTRA COLLEGE OF PHARMACY, MADURAI
Camag Nano-Applicator with micrometer controlled Hamilton syringe which delivers sample volumes in the range of 500-2000 µ
Camag Nanomat with a platinum-iridium capillary handles 0.2 µ
Fig.No. 4.0: Camag Nanomat automatic apllicator
The small diameter of the sample spots applied in HPTLC allows for analysis 30 sample in a single plate, thus reducing the development time of 20 minutes to 1 minute per sample. This certainly places HPTLC in a competitive position with HPLC in terms of speed of analysis.
Mobile phase optimisation
obile phase commonly called solvent system is traditionally selected by controlled process of trial and error. It should be chosen taking into consideration chemical properties of analytes and the sorbent layer. Use of mobile phase containing ee or four components should normally be avoided as it is often difficult to get reproducible ratios of different components. Solvent composition is expressed by volumes (v/v) and usually sum of total volume is 100.
conditioning (saturation)
he Chamber should be saturated before the chromatographic development to avoid the evaporation of the solvent mainly from the solvent front thus avoiding larger usage of solvents resulting in lower Rf values. Saturation time depends on the
sition of mobile phase and increases with increase in the layer
ographic development and drying
INTRODUCTION
18 controlled Hamilton syringe
2000 µl. iridium capillary handles 0.2 µl.
Fig.No. 4.0: Camag Nanomat automatic apllicator
PTLC allows for analysis 30 sample in a single plate, thus reducing the development time of 20 minutes to 1 minute per sample. This certainly places HPTLC in a competitive position with
obile phase commonly called solvent system is traditionally selected by controlled process of trial and error. It should be chosen taking into consideration chemical properties of analytes and the sorbent layer. Use of mobile phase containing ee or four components should normally be avoided as it is often difficult to get reproducible ratios of different components. Solvent composition is expressed
CHAPTER 1 INTRODUCTION
ULTRA COLLEGE OF PHARMACY, MADURAI 19
Some of the commonly used development types and the respective chamber used are as follows:
Table No. 3.0: Types of HPTLC Chromatographic Development technique and
Drying Chamber
The developed plate is then removed from the chamber and the mobile phase is removed completely in a fume cup-board to avoid contamination of laboratories atmosphere. The plates should always be laid horizontally so that the separated components will migrate evenly to the surface where they can be detected easily.
Detection and Visualisation
The zones can be located by various physical, chemical and biological-physiological methods. There is apparently no difficulty in detecting coloured substances or colourless substances absorbing in short wave UV region (254 nm) or with intrinsic fluorescence. Those which do not have the above properties should be derivatised as detectable substances by means of chromogenic or fluorogenic reagents (Post-chromatographic derivatisation). Detection under UV light is the first choice and is non-destructive in most of the cases and is commonly employed for densitometric scanning. The derivatising reagents are applied both by spraying or dipping technique. While resorting to in situ pre- or post-chromatographic derivatisation followed by quantitative analysis, it is absolutely essential to ensure that reaction on the plate is complete or atleast stoichiometric and reproducible.
Stabilisation of developed zones
The derivatised color or fluorescent chromatographic zones should be stable at least for 30 minutes for carrying out various steps involved in quantitative analysis.
Sr.No. Types of Development Chambers used
1. - Ascending
-Descending Rectangular glass chamber
2. Two-dimensional Twin-trough chambers
3. Horizontal Horizontal development chamber
4. Radial (circular) Circular U chamber 5. Anti-radial (anti-circular) Anti-circular U chamber 6. Multimodal
(multi-dimensional
CHAPTER 1 INTRODUCTION
ULTRA COLLEGE OF PHARMACY, MADURAI 20
Therefore, the chromatographs should be stabilized and intensified by adopting suitable conditions.
Quantitation (evaluation)
Quantitation basically involves two types of methods:
The first method involves some type of measurement on the layer such as visual comparison, area measurement or in-situ densitometry on the layer. The second method involves removal of the analyte from the plate
followed by quantitation.
Visual Comparison
This method can be used to determine if impurities are within a certain limit and to determine the number and approximate quantities of impurities that may be present. Since spots with low Rf values are too concentrated to be evaluated
accurately and since the spots with high Rf values may be too diffuse to estimate
accurately, visual comparison should be used for spots with Rf values between 0.3 and
0.7.
Area Measurement
The use of area measurement after separation of the spot reduces the errors in quantitation to 5-15%. Several methods for area measurements used are planimetry, tracing spots on writing paper followed by the traditional cutting and weighing approach and photographing the spots for cutting and weighing. The area can also be measured by counting squares occupied by the trace of the spot on millimetre graph paper and photocopying the spot prior to cutting and weighing. The quantity of material in the sample spot can be determined by interpolation after construction of a standard curve. The area of the spot is linearly related to the log of the sample weight.
In-Situ Densitometry
Densitometry is the in-situ instrumental measurement of visible, UV absorbance, fluorescence or fluorescence quenching directly on the layer without resorting to scrapping and elution. The measurements are usually made by reflection from the plate using single beam, double beam or single beam-dual wavelength operation of scanning instruments at the wavelength of maximum absorbance to achieve sensitivity. The purpose of the scanner is to convert the spot or band in the layer into chromatogram consisting of peaks whose position on the recorder chart are related to Rf values of the spots on the layer and peak height or area is related to the
CHAPTER 1 INTRODUCTION
ULTRA COLLEGE OF PHARMACY, MADURAI 21
the absorption of transmitted or reflected light that passes through the spot compared to blank portion of the sorbent layer. The HPTLC densitometric analysis, three or four standard and purified samples are applied on the same plate. A calibration curve consisting of scan area of standard versus amount of analyte is constructed and amount of analyte in the sample represented by scan area is interpolated from the standard curve. Concentration of the analyte in the sample is calculated by considering the weight of the sample initially taken and dilution factors.
Scrapping and Elution
This involves the following steps:
Fig. No 5.0: Steps involved in scrapping and elution
Location of the Analyte
The analyte zones are located by any of the detection methods like exposure to UV light or Iodine vapours or by the formation of coloured / fluorescent derivatives using corresponding derivatising reagents.
Collection of the Sorbent
Once the zone has been located, the sorbent can be removed quantitatively by the following procedures:
- Simple scrapping of the sorbent as a circular ring along with the analyte - Drawing the sorbent through a glass tip of a vacuum device and depositing
it on a glass frit / glass wool.
Removal of Analyte (Isolation) From the Sorbent (Elution)
The elution chamber is sealed over the analyte on the circular sorbent ring and the eluent is pumped into the chamber.
Location of the analyte zone
Collection of the sorbent
Removal of the analyte (isolation) from the sorbent