University of Southern Queensland
Faculty of Engineering and Surveying
REDUCTION OF NITROGEN OXIDES
(NO
X) USING LIQUEFIED PETROLEUM
GAS (LPG) IN SPARK IGNITION (SI)
ENGINE
A dissertation submitted by
CHAN, Lai Kuan
In fulfillment of the requirements of
ENG 4111 and ENG 4112 Research Project
Towards the degree of
Bachelor of Engineering (Mechanical)
ABSTRACT
Conventional fuels such as gasoline and diesel are causing serious environmental issues due to their high amount of pollutants. Moreover, emissions such as nitrogen oxides (NOx), carbon monoxide (CO), sulphur oxides (SO2) and so on
have adverse impacts on the human body. Therefore, alternative fuels such as LPG are being considered to replace the role of conventional fuel in order to reduce these harmful emissions to a safer level. LPG is commonly used as a cooking fuel in Malaysia and is widely available commercially in small sized portable cylinders.
A study was conducted on the use of LPG in conventional two-stroke and four-stroke gasoline engines. The laboratory facilities were provided by UNITEN (University of Tenaga Malaysia). The engines were tested using LPG and gasoline so that comparisons of the emissions of pollutant gases and engine performance can be made. The results obtained are very encouraging in the emission aspect. The average reduction of emission gases from the LPG fuel system are 64% for NOx, 31% for CO2 and 57% for CO for the two-stroke
engine. The four-stroke engine achieved a reduction of 41% for NOx, 11% for
CO2 and 40% for CO. On the other hand, the LPG fuel system also delivered a
University of Southern Queensland
Faculty of Engineering and Surveying
ENG 4111 and ENG 4112 Research Project
Limitations of Use
The council of University of Southern Queensland, its Faculty of Engineering and Surveying, and the staff of the University of Southern Queensland, do not accept any responsibility for the truth, accuracy and completeness of materials contained within or associated with this dissertation.
Persons using all or any part of this material do so at their own risk, and not at the risk of the Councils of the University of Southern Queensland, its Faculty of Engineering and Surveying or the staff of the University of Southern Queensland.
This dissertation reports an educational exercise and has no purpose or validity beyond this exercise. The sole purpose of the course pair entitled “Research Project” is to contribute to the overall education within the student’s chosen degree program. This document, the associated appendices should not be used for any other purpose: if they are so used, it is entirely at the risk of the user.
Prof G Baker
Dean
Certification
I certify that the ideas, designs and experimental work, results, analyses and
conclusions set put in this dissertation are entirely my own effort, except where
otherwise indicated and acknowledged
I further certify that the work is original and has not been previously submitted
for assessment in any other course or institution, except where specifically stated.
CHAN Lai Kuan
Student Number: 0050027401
________________________
(Signature)
________________________
ACKNOWLEDGMENT
I would like to express my heartfelt gratitude and thanks to my supervisors, Dr. Harry Ku, Dr. Fok Sai Cheong and Dr. Talal F. Yusaf for their invaluable guidance, encouragement, expert advices and constructive comments.
My sincere appreciation to the laboratory assistant of University of Tenaga Malaysia (UNITEN), Mr. Waleed, for his kind assistance during practical work. His support is greatly appreciated.
Deepest thanks to my family members for their endlessly support throughout all these years.
TABLE OF CONTENTS
Page
ABSTRACT i
DISCLAIMER ii
CERTIFICATION iii
ACKNOWLEDGEMENT iv
TABLE OF CONTENTS v
LIST OF FIGURES x
LIST OF TABLES xiii
GLOSSARY xiv
NOMENCLATURE xv
CHAPTER 1 - INTRODUCTION
1.1 Project Background 1
1.2 Objectives 3
1.3 Methodology 4
CHAPTER 2– LITERATURE REVIEW
2.1.1 History of Liquefied Petroleum Gas 8 2.1.2 Physical and Chemical Properties of LPG 9
2.1.3 Advantages of LPG 12
2.1.4 Limitations of LPG 13 2.1.5 Comparisons between Gasoline and LPG 14 2.1.6 Safety Issue of LPG 15
2.2 Introduction of Nitrogen Oxide (NOx) 16
2.2.1 Formation of NOx 17
2.2.2 Concentration of NOx 20 2.2.3 Effects of NOx toward the Environment 20 2.2.4 Factors Affecting NOx Emissions 21
2.2.5 NOx Reduction Techniques 23
2.3 Other Emissions of LPG 25
2.3.1 Carbon Monoxide (CO) 26
2.3.2 Carbon Dioxide (CO2) 27
2.3.3 Sulpfur Dioxide (SO2) 27
2.3.4 Hydrocarbons (HC) 28
CHAPTER 3 – ENGINE
3.1 Two-stroke Engine 30
3.1.1 Advantages of Two-stroke Engine 32 3.1.2 Disadvantages of Two-stroke Engine 32
3.2 Four-stroke Engine 33
3.3 Engine Performance 35
3.3.2 Brake Power 36 3.3.3 Specific Fuel Consumption 38
3.3.4 Engine Efficiency 39
CHAPTER 4 – EXPERIMENTAL SETUP
4.1 Introduction 41
4.2 Engine Specifications 42
4.3 Descriptions of Experiment Equipments 44
4.3.1 Control Panel 44
4.3.2 Load Bank 44
4.3.3 Digital Power Meter 45
4.3.4 LPG Storage Cylinder 45
4.3.5 Pressure Regulator 45
4.3.6 Pressure Sensor and Crank Angle Encoder 46 4.3.7 Flow Meter and Venturi Air Meter 46 4.3.8 Digital Thermocouple 46
4.3.9 Gas Analyzer 46
4.3.10 Air Fuel Mixer and Air Filter 48 4.3.11 Data Acquisition System 48
4.4 Experimental Setup 49
CHAPTER 5 – RESULTS AND DISCUSSIONS
5.1 Analysis 51
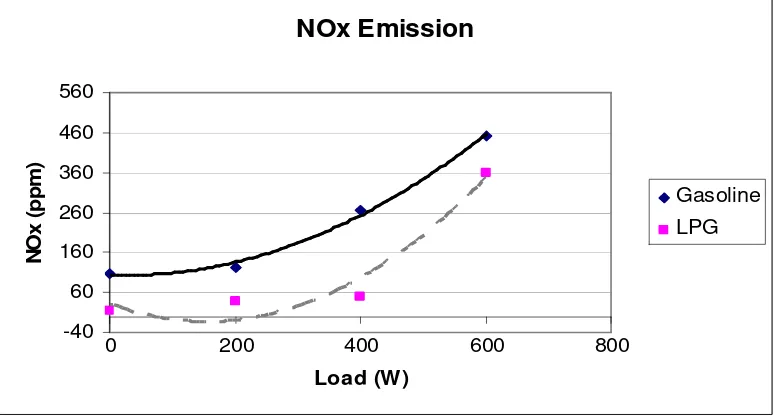
5.2 Emissions of Two-stroke Engine 51 5.2.1 Emission of Nitrogen Oxides (NOx) 52
5.2.3 Emission of Carbon Monoxide (CO) 54 5.2.4 Emission of Oxygen (O2) 55
5.2.5 Emission of Hydrocarbon (HC) 57
5.3 Two-stroke Engine Performance 58 5.3.1 Brake Specific Fuel Consumption (bsfc) 58
5.3.2 Indicated Work 59
5.3.3 Engine Efficiency 62
5.4 Temperatures of Two-stroke Engine 63
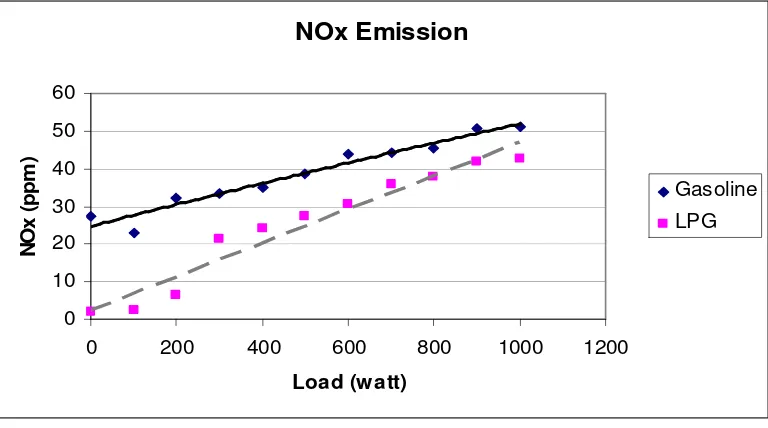
5.5 Emissions of Four-stroke Engine 64 5.5.1 Emission of Nitrogen Oxides (NOx) 64
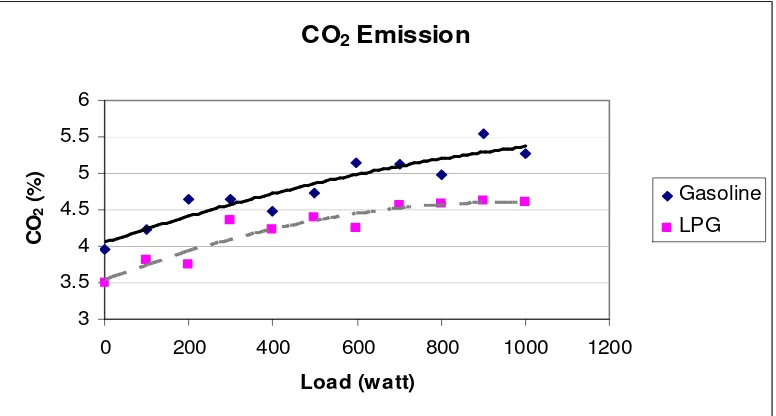
5.5.2 Emission of Carbon Dioxide (CO2) 66
5.5.3 Emission of Carbon Monoxide (CO) 67 5.5.4 Emission of Oxygen (O2) 68
5.5.5 Emission of Hydrocarbon (HC) 69
5.6 Engine Performance of Four-stroke Engine 70 5.6.1 Brake Specific Fuel Consumption (bsfc) 71
5.6.2 Engine Efficiency 72
5.7 Temperature of Four-stroke Engine 73
5.8 Concluding Discussions 74
5.9 Justifications of Lower LPG Engine Efficiency 76
CHAPTER 6 – CONCLUSION
6.1 Achievement of Objectives 78
REFERENCES 82
BIBLIOGRAPHY 86
APPENDIX A – PROJECT SPECIFICATION 87
APPENDIX B – TABULATION OF DATA FOR 90
TWO-STROKE ENGINE
APPENDIX C – TABULATION OF DATA FOR 99
FOUR-STROKE ENGINE
LIST OF FIGURES
Figure number Page
1.1 Project Methodology 5
2.1 Type of cylinder and regulator system used in the year of 1912 8
2.2 Correlation of NO reduction with diluent heat capacity for a 24 spark-ignition engine
3.1 Basic components of a two-stroke engine 30
3.2 Cross-scavenged two-stroke engine 31
3.3 The movement of four-stroke engine 34
4.1 AutoLogic gas analyzer 47
4.2 Automatic filtering and water removing 48
4.3 Schematic diagram of the experimental set up 50
5.1 Emissions of NOx at variable loads 52
5.2 Lambda values for gasoline and LPG fuel in two-stroke engine 53
5.3 Emissions of CO2 at variable loads 54
5.4 Emissions of CO at variable loads 55
5.6 Emissions of HC at variable loads 57
5.7 Brake specific fuel consumption on variable loads 58
5.8 Indicated work for gasoline and LPG fuel system at 0 Watts 60
5.9 Indicated work for gasoline and LPG fuel system at 200 Watts 60
5.10 Indicated work for gasoline and LPG fuel system at 400 Watts 61
5.11 Indicated work for gasoline and LPG fuel system at 600 Watts 61
5.12 Comparison of engine efficiency of gasoline and LPG fuel system 62
5.13 Exhaust temperature of two-stroke engine 63
5.14 Body temperature of two-stroke engine 64
5.15 Emissions of NOx at variable loads 65
5.16 Lambda values for gasoline and LPG fuel in four-stroke engine 66
5.17 Emissions of CO2 at variable loads 67
5.18 Emissions of CO at variable loads 68
5.19 Emissions of O2 at variable loads 69
5.20 Emissions of HC at variable loads 70
5.21 Brake Specific Fuel Consumption on variable loads 71
5.23 Exhaust temperature of four-stroke engine 73
LIST OF TABLES
Table number Page
2.1 Types of LPG available in the market 7
2.2 Properties of Gasoline and LPG 10
2.3 Projected 2000 Fuel Prices of LPG and Gasoline 12
4.1 Specifications of Yamaha ET 950 two-stroke engine 42
4.2 Specifications of Honda GX160K1 four-stroke engine 43
5.1 Average emission gases for two-stroke engine 75
5.2 Average engine performance for two-stroke engine 75
5.3 Average emission gases for four-stroke engine 75
5.4 Average engine performance for four-stroke engine 76
5.5 The prices of fuel in Peninsular Malaysia 77
5.6 The prices of fuel in Sabah, Malaysia 77
GLOSSARY
BDC Bottom dead center C3H8 Propane
C4H10 Butane
CO Carbon monoxide CO2 Carbon dioxide
DC Direct current EI Emission index
HC Hydrocarbon
HCN Hydrogen cyanide LPG Liquefied petroleum gas
N2 Nitrogen
NO Nitric oxide NO2 Nitrogen dioxide
NOx Nitrogen oxides
O3 Ozone
PM Particular matter PPM Particle per million
PPMW Particles per million by weight fraction Qexhaust Energy lost in the exhaust flow
Qloss Other energy lost to the surroundings by heat transfer
rpm Resolution per minute SI Spark-ignition
SO2 Sulphur dioxide
SOx Sulfur oxide gases
TDC Top dead center THC Total hydrocarbon
UNITEN University of Tenaga Malaysia VOCs Volatile organic compounds
W Watts
Wacc Power to run engine accessories
NOMENCLATURE
BP Brake power
bsfc Brake specific fuel consumption EP Electric power
I Current
IP Input power
f
m Mass flow rate of fuel N Engine speed
P Power developed by engine
HV
Q Lower calorific value of fuel sfc Specific fuel consumption
V Voltage
π 3.142
τ Torque (N.m)
f
η Engine efficiency
ρ Density
λ Air-fuel ratio
CHAPTER 1
INTRODUCTION
1.1
Project Background
Environmental issues regarding the emission of conventional fuels such as gasoline and diesel are of serious concern worldwide. The standard emission from conventional fuel vehicles are hydrocarbon (HC), carbon dioxide (CO2), carbon
monoxide (CO), nitrogen oxides (NOx) and particulate matter (PM). These emissions
are harmful gases which can have adverse impact on human body and destroy the environment by playing an important role in formation of the greenhouse effect, acid rain and global warming. Therefore, alternative fuels such as natural gas are being considered to replace the role of conventional fuel in order to reduce these harmful emissions from being released to the atmosphere. These alternative fuels may possibly contribute to a significant reduction in emission in most vehicles operating worldwide.
Natural gas had long been introduced to the market where application of cleanliness is emphasized. Liquefied petroleum gas (LPG) is one of the members of natural gases and has been declared as the “cleaner fuel” (Nett Technologies, 2004). LPG is increasingly chosen as the preferred burning fuel for all types of vehicles due to its advantageous fuel properties. According to Murray et al. (2000), LPG is proven to have lower emission of pollutants such as hydrocarbon (HC), carbon dioxide (CO2),
fuels. For examples, CO is reduced by over 20%, total hydrocarbon (THCs) by over 40% and NOx by over 30% (as compared to petrol) in light-duty vehicles. Whereas for heavy-duty engines, CO is reduced by over 90%, total hydrocarbon (THCs) by over 80% and NOx by about 60% (compared to diesel). Furthermore, particulate matter (PMs) is virtually eliminated from LPG vehicle emissions (Murray et al., 2000).
A lot of researches have been done to prove that vehicles using LPG as the burning fuel shows no decreased in efficiency compared to the conventional fuel operating vehicles along with its advantage of reduction in emission gases from the exhaust of an engine (Murray et al., 2000). Besides that, LPG has the capability to reduce the noise from a running engine, helping to effectively decrease noise pollution in urban areas especially during the traffic congestion period. LPG offers a reduction of around 50% perceived noise levels as a LPG operated bus shows a record of at least 2–3 dB reduction in comparison to a diesel operated bus (AEGPL 1998). There are currently over 4 million road vehicles using LPG in countries such as Italy, Holland, Japan, the USA, and Australia due to the vast advantages of LPG usage (Murray, et al., 2000). On the other hand, the popularity of LPG is increasing in our daily usage; it can also be used as a cooking and heating fuel, in flame weeding and other activities. This is the reason why LPG has being claimed to be the world’s most multi-purpose fuel (World LP Gas Association, undated).
Air Technologies Information Pool, 2005). Clean Air Technologies Information Pool (2005) showed that LPG storage and distribution location must meet a certain distance requirement to isolate it from residential properties and underground storage tanks. Maintenance facilities must include the detector to sense LPG leakage to prevent explosion due to leaks.
1.2
Objectives
The main aim of this research project is to analyze and prove the reduction of nitrogen oxides using liquefied petroleum gas in spark ignition engine. This research can be further divided into the sub-objectives listed below:
1. Conduct a detailed study on the history, properties and usage of LPG as an alternate fuel, and the factors and effects of NOx emission.
2. Measure the concentration of emission gases such as NOx, CO2, CO and
hydrocarbons from the two-stroke engine which using both the gasoline and LPG as the main fuel.
3. Evaluate the data collected from the experiment conducted for both gasoline and LPG in the two-stroke engine for different set of load conditions and engine speeds.
1.3
Methodology
First, a literature review of liquefied petroleum gas (LPG) and nitrogen oxide (NOx)
was performed to explain the background of LPG and NOx formation. The literature
survey was undertaken from various resources such as journals, conference articles, online sources, and reference books. All relevant information were analyzed to construct a precise summary of background information which included the history of LPG, advantages and limitations of LPG, physical and chemical properties of LPG, introduction of NOx and formation of NOx. At the same time, comparisons
between gasoline and LPG were also noted.
Next, a review will be given on crucial engine performances such as engine efficiency, brake power and specific fuel consumption. The emission from the tail-pipe of the engine such as hydrocarbon (HC), carbon dioxide (CO2), carbon
monoxide (CO) and particulate matter (PM) will also be explained.
Figure 1.1: Project Methodology
Project Allocation & Approval
Literature Survey & Research
Literature Review of LPG and NOx
Review of Engine Performance and emission from exhaust
engine
Engine Performance Review
Experimental Setup
Analysis of data collected from Experiments
CHAPTER 2
LITERATURE REVIEW
2.1
Introduction to Liquefied Petroleum Gas (LPG)
Liquefied Petroleum Gas (LPG) is a mixture of various hydrocarbons and its main components are either propane (C3H8) or butane (C4H10), or combination of the two.
LPG is produced as the by-product of natural gas processing or crude-oil refining. According to West Virginia University's Alternative Fuel Vehicle Training Program, approximately 30% of LPG is produced from oil refining and another 70% is generated from the natural gas processing in the United States. United States Department of Energy’s Alternative Fuels Data Center(2004) shows that LPG is the most widely used alternative fuel in the world, with about 5.7 million vehicles currently using it.
regulator is used to release any extreme pressure build-up (EduGreen, undated). EduGreen (undated) also revealed that latent heat of vaporization is consumed when transforming LPG from liquid to gas state. Therefore, the exterior surface of the container is cold when the liquid boils as it obtains energy from the surroundings.
The benefits of easy storage and utilization make LPG an ideal energy source suitable for a wide range of application. LPG is a multi-purposed fuel which can be used as the burning fuel in transportation, industrial application, agricultural, leisure industry, cooking and space heating (World LP Gas Association 2004).
Hofmann reported that there are three different grades of LPG available in the market, namely the HD-5 Propane, Commercial Propane and Commercial B/P Mixture. Their compositions are tabulated below:
Component HD-5 Propane Commercial Propane
Commercial B/P Mixture
Propane 90% liquid volume (min)
Propane and / or propylene
Butanes and / or butylenes with Propylene 5% liquid volume
(max)
- propane and / or propylene
Butane and heavier HC
2.5% liquid 2.5% liquid -
Moisture content Dryness test of NPGA
Dryness test of NPGA
-
Residual matter 0.05 ml 0.05 ml - Pentane and
heavier HC
- - 2 % liquid volume
(max) Total sulfur 123 PPMW* 185 PPMW* 140 PPMW*
Table 2.1: Types of LPG available in the market
2.1.1 History of Liquefied Petroleum Gas
According to National Propane Gas Association (2005), LPG began its history in the year of 1904 when it was discovered by a young chemist named Herman Blau in Germany. It was first given the name “Blaugas” and was mainly used for street lighting and home cooking closely surrounding the production plant. Blaugas was expensive to handle at that time as each pound of the gas is roughly 10 cents. EduGreen reported that in the year of 1912, an American scientist, Dr. Walter O. Snelling recognized that this gaseous fuel can be changed into the liquid state by applying moderate pressure, and this discovery eased the storage of LPG. American Gasol Co was the first company to bottle liquefied petroleum gas in steel cylinders and sell it commercially. The product was not widely used by the public due to the weight of the steel container. In the year of 1928, the weight of the steel cylinder tank had been improved through design and the two-stage regulator system was also upgraded to single regulator control. The usage of LPG was on the rise since then and was sold commercially (National Propane Gas Association, 2005).
2.1.2
Physical and Chemical Properties of LPG
LPG has been and continued to be the most widely used alternative burning fuel. Listed below are some characteristics of LPG:
i. LPG is a colorless gas regardless of its state. Chilled water vapor condensed from the surrounding air will appear as white cloud around the LPG leakage point (Shell Gas LPG UK, 2004).
ii. LPG is odorless or has no smell. Stench agent such as Mercaptan is added before delivery to detect leakage. Mercaptan additive has an unpleasant and foul smelling so that leak can be easily detected (Shell Gas LPG UK, 2004).
iii. LPG is chemically reactive and will cause natural rubber and some plastics to deteriorate. Hence, it is advisable to use equipment specifically designed for LPG (Shell Gas LPG UK, 2004).
iv. LPG is highly volatile and flammable. Thus, it must be stored in a high ventilation rate area and kept away from any sources of ignition (EduGreen, undated).
v. LPG is a high performance fuel. LPG will only burn when the fuel to air ratio is between 1:10 and 1:50 range. (Shell Gas LPG UK, 2004).
vii. Although LPG is non-toxic, it has an anesthetics effect when present in high concentrations. Therefore, LPG should always be kept away from children whenever possible (EduGreen).
Table 2.2 illustrates the comparison of the properties of gasoline and LPG:
Property Gasoline Propane (LPG)
Chemical formula C4 to C12 C3H8
Molecular weight 100-105 44.1
Composition, Weight %
Carbon 85-88 82
Hydrogen 12-15 18
Oxygen 0 -
Specific gravity, 60°F/60°F 0.72-0.78 0.508 Density, lb/gal @ 60°F 6.0-6.5 4.22 Boiling temperature, °F 80-437 -44 Reid vapor pressure, psi 8-15 208 Octane no.
Research octane no. 90-100 112
Motor octane no. 81-90 97
(R+M)/2 84-96 104
Cetane no. 5-20 --
Water solubility, @ 70°F
Fuel in water, volume % Negligible - Water in fuel, volume % Negligible -
Freezing point, °F -40 -305.8
Viscosity
Centipoise, @ 60oF 0.37-0.44 -
Flammability limits, volume %
Lower 1.4 2.2
Higher 7.6 9.5
Latent heat of vaporization
Btu/gal @ 60°F 950 775
Btu/lb @ 60°F 150 193.5
Btu/lb air for stoichiometric mixture @ 60°F
10 -
Heating value
Higher (liquid fuel-liquid water) Btu/lb
18,800-20,400 21,600
Lower (liquid fuel-water vapor) Btu/lb
18,000-19,000 19,800
Higher (liquid fuel-liquid water) Btu/gal
124,800 91,300
Lower (liquid fuel-water vapor) Btu/gal @ 60°F
115,000 84,500
Heating value, stoichiometric mixture
Mixture in vapor state, Btu/cubic foot @ 68°F
95.2 -
Fuel in liquid state, Btu/lb or air 1,290 - Specific heat, Btu/lb °F 0.48 - Stoichiometric air/fuel, weight 14.7 15.7 Volume % fuel in vaporized
Stoichiometric mixture
2 -
2.1.3
Advantages of LPG
LPG is the most commonly used alternative fuel in the United States (Hofmann, undated) and it is increasingly chosen as the preferred fuel due to its great number of benefits towards the society as follows:
i. The amount of readily available LPG is aplenty in the market and its supply is estimated to last for at least another 75 years. There are over 700 retail stores in Texas to fulfill the demand of LPG (World LP Gas Association, 2004).
ii. The price of LPG is cheaper than other conventional fuels. Table 2.3 shows that LPG prices increase slower than gasoline in the past and in the near future (Hofmann, undated).
Gasoline $ gallon equivalent LPG $ gallon equivalent
Wholesale 0.93 0.52
Retail 1.39 0.98
Table 2.3: Projected 2000 Fuel Prices of LPG and Gasoline (Hofmann, undated)
iii. LPG has a comparable performance if compared to the conventional fuels with lower pollutant emission (Autogas, 2000).
iv. LPG is friendly to the environment. It produces less pollutant to the atmosphere with virtually no particulate matters (PM), low level of carbon monoxide (CO), hydrocarbons (HC), and oxides of nitrogen (NOx). LPG emits less greenhouse gases (GHG) compared to any other
v. For LPG that is used in commercial and domestic heating, it is portable because it is stored in steel tanks which are easily transferred to other places. LPG is sometimes referred to as the “pipeline on wheel” due to its portability (World LP Gas Association, 2004).
vi. LPG has a very good safety record over the years. The conversion kits readily available in the market enable LPG to continue being a widely used road fuel (Autogas, 2000).
vii. Researches have shown that engine maintenance is reduced significantly because LPG does not wash the lubricant oil from the cylinder walls or dilute the oil. Hence, engines using LPG as the burning fuel always enjoy a longer service life and reduced maintenance costs (Autogas, 2000).
2.1.4
Limitations of LPG
Although LPG has a great deal of advantages, it has some limitations too as listed below:
i. LPG is a non-renewable fossil fuel. If we use LPG faster than the rate of its generation, it will begin to deplete (Autogas, 2000).
ii. LPG is denser than air, and may pose a risk when leakage occurs as it will accumulate in low-lying areas (Autogas, 2000).
iv. Murray (2000) revealed that there exist a number of countries with under-developed technologies for LPG distribution system and therefore, limits its usage. For example, Malaysia does not have any LPG operating vehicle yet. LPGs are only used in residential homes as heating and cooking gas.
v. The contents of propane in LPG are different for most countries. For instance, LPG contains more than 90 % propane in UK, whereas in Italy the level can be as low as 20%. This fluctuation proves to be a barrier to standardization of LPG vehicles around Europe and the rest of the world (Murray et al., 2000).
2.1.5
Comparisons between Gasoline and LPG
West Virginia University's Alternative Fuel Vehicle Training Program published that the performance and drivability of LPG operating vehicles is essentially the same as gasoline operating vehicles. The displacement of air by LPG causes reduction in power of 4% if compared to an equivalent gasoline counterpart. Moreover, the evaporative cooling rate and increase in air density when gasoline fuel is used provides the added power (West Virginia University's Alternative Fuel Vehicle Training Program).
vehicle power than that of a gasoline engine (West Virginia University's Alternative Fuel Vehicle Training Program).
According to the research done by West Virginia University's Alternative Fuel Vehicle Training Program, LPG fueled vehicle owners need to install a slightly bigger tank in order to achieve the same driving range as gasoline vehicles. This might pose a problem for bi-fueled vehicles where two tanks have to be accommodated as the tanks are normally heavier than conventional fuel tanks for the same range (Murray et al., 2000).
2.1.6
Safety Issue of LPG
The studies of AEGPL (1998) have shown that LPG has a safe record if compared to other conventional fuel vehicles. LPG had been proven to be the safest fuel with the lowest accident rate throughout Europe. However, LPG does pose a different type of risk due to its natural properties when a leak occurs. LPG is a highly volatile fuel and pressure gradients will cause the leaking LPG to discharge fast enough to result the liquid LPG to evaporate before reaching the ground. Higher quantities of LPG spill will produce a boiling pool on the ground and LPG will continue to evaporate until there is no more left. Hence, LPG has the highest pool burning rate due to its active vaporization. The potential of LPG to cause an accidental explosion is almost twice compared to gasoline since LPG vapor has a higher tendency to be in contact with an ignition source due to its high volatile properties (National Transportation Library, 2004).
temperature. As a result, the tanker trucks possess a higher capability to resist the mechanical forces associated with an accident if compared to other conventional fuel transportations. The possibility of LPG leaks at joints and fittings is also higher as LPG fuel is transported at a higher pressure (National Transportation Library, 2004).
According to National Transportation Library (2004), there is a great safety risk associated with the transfer of LPG from tanker trucks to the fleet storage as LPG vapor will be released on disconnection when there is any human error. Luckily, LPG is odorized with the foul-smelling agent such as Mercaptan for easy detection of any leakage. However, LPG is denser than air and it will accumulate in the low-lying area if there is inadequate ventilation. Under this condition, leakage of LPG may go undetected. Thus, as a safety precaution to avoid gas build-up, LPG vehicles are not allowed to enter underground car parks and to use EuroTunnel in certain European countries (Murray et al., 2000).
For safety issues associated with fire hazard during storage, LPG is stored in above-ground tanks with thick gauge steel in the storage station. Natural circulation of air and the odious agent Mercaptan help to reduce the dangers of leakage in the weaker point of the LPG storage system such as joints, connection, and fittings. The major safety concern in the fleet storage is the external heating from fire plus the failure of the pressure relief system which will lead to pressure build-up in the tank. This will cause a fatal explosion and therefore, regular checks should be performed on the pressure relief devices to reduce the tendency of pressure build-up in the tank (National Transportation Library, 2004).
2.2
Introduction to Nitrogen Oxide (NO
x)
emission and play a major role in the formation of acid rain, greenhouse effect and the global warming issue and hence accelerates the process of icecap melting in north and south poles. In the 1950s, incidents of photochemical smog occurred in Los Angeles and were primarily due to the emission of unburned hydrocarbons and NOx from vehicles (Haagen-Smit ,1952).
NOx is the collective term for nitric oxide (NO) and nitrogen dioxide (NO2) which
are extremely toxic gases for humans. Accumulation of NOx in a confined area can
lead to fatality and may also cause harm to other materials. For instance, the color of plain paper will change from white to yellow, and thus degrade its quality causing losses, with the existence of just a few ppm (particle per million) of NOx in the
ambient air (Nett Technologies Inc., 2004). All fuel burning engines produce NOxas
a by-product of combustion. The compositions of NOx include the nitrogen oxide
(NO), nitrogen dioxide (NO2) and small amount of other nitrogen-oxygen
compounds. The nitric oxide (NO) comprises 90-95% of the composition of NOx
whereas nitrogen dioxide (NO2) makes up the other 5% (U.S. Army Corps of
Engineers).
2.2.1 Formation of NO
xBasically, NOx, as the name implies, are generated from reaction between nitrogen
and oxygen under high temperature and pressure conditions during the combustion process in an engine cylinder. Normally it takes place at the pre-combustion, combustion and post-flame regions where sufficient concentrations of oxygen and nitrogen are present. The formation of NOx depends enormously on the temperature
as the rate of dissociation of nitrogen is directly proportional to the temperature increase. Therefore, the higher the combustion reaction temperature, the more NOx
NO + N O + N2 (2.1)
N + O2 NO + O (2.2)
N + OH NO + H (2.3)
There are three different mechanisms of formation of NOx:
i. Thermal NOx
It is formed bythe stabilization of atmospheric nitrogen in oxidizing atmospheres at a high flame temperature exceeding 1573K or 1300 °C. Thermal NOx is generally
produced during the combustion of both gases and fuel oils. The following chemical reactions were classified as an atom shuttle reaction (Zeldovich et al., 1947; Szczepanski. D 1998)
N2 + O NO + N (2.4)
N + O2 NO + O (2.5)
When the combustion is under fuel-lean conditions (with less air) and there is a rise in temperature, this will lead to an increase of NOx emissions due to increased
oxygen radicals forming in the combustion process. However, when the combustion is under fuel-rich condition (with excess air) the oxidation reaction will involve the OH and H radicals (Szczepanski. D 1998):
.
N + OH NO + H (2.6)
N2H + O NO + NH (2.8)
High activation energies are required for the dissociation of oxygen molecules and the disengagement of the triple bond of nitrogen. This phenomenon causes the formation of thermal NOx to be largely dependent on the temperature, the degree of
air to fuel mixing, the concentration of oxygen and nitrogen in the flame and duration of reaction occurred (Bacherach Institute of Technical Training).
ii. Fuel NOx
It is formed by the reaction of coal-bound nitrogen compounds with oxygen at temperature exceeding 1123K or 850 °C. The formation of fuel NOx is mainly
dependent on the availability of oxygen and the combustion method. Under low oxygen conditions, hydrogen cyanide (HCN) reacts with oxygen atoms to form oxycyanogen and amine intermediates and NO is formed as the oxidization product (Bacherach Institute of Technical Training).
On the other hand, under excess oxygen conditions, the formation of N2 is more
favorable as the result of additional hydrogenated amine species and NO. The chemical reactions between amine intermediates, hydrocarbon radicals and NO are as follows (Szczepanski. D 1998):
NH2 + NO N2 + H2O (2.9)
CH + NO HCN + O (2.10)
iii. Prompt NOx
significance under the condition of very fuel-rich flames and nonessential to be compared with the influence of thermal and fuel NOx (Bacherach Institute of Technical Training).
2.2.2
Concentration of NO
xThe concentration of NOx found in the emission of engines is dependent on the
combustion temperature, the length of combustion time and the concentration of the nitrogen and oxygen in the engine. The measurement unit of NOx is generally in
parts per million (PPM) due to the dilution of NOx percentage with the excess air
level in the flue gases. NOx value tends to peak at an air-fuel ratio of approximately
1.1 times stoichiometric with the condition of excess oxygen present (U.S. Army Corps of Engineers).
2.2.3
Effects of NO
xtowards the Environment
The environmental problems caused by NOx are now worldwide issues due to the
seriousness of ozone reactivity and the amount of formation of smog. NOx combines
with water vapor in clouds to produce acid rain which pollutes clean water sources and corrodes metals used in our daily life. Acid rain also harms the growth of organisms in the lake and disturbs the balance of the ecosystem both on land and at sea. Apart from that, acidified soil is the also the result of acid rain and it causes damage to the root system of trees, disabling the nutrient absorption process and disrupting the natural process of photosynthesis. (Turns, 1996)
When NOx react chemically with other atmospheric gaseous compounds such as
and poses a health hazard to humans which includes irritation of eyes, respiratory and cardiovascular problems such as asthma and headaches (Southern Technologies).
Greenhouse effect is a global-warming phenomenon when heat energy from the sunlight is trapped by gases such as NOx. This increases the average temperature of
our planet and acts as a great threat to the life of crops, humans and the environment. The increased temperature will speed up the melting rate of the icebergs in north-south poles and there will be an increased risk of flooding in lower-terrain countries.
Next, ozone depletion is also related to the excessive emission of NOx. Nitrogen
oxides formed will allow more penetration of harmful ultraviolet solar radiation to the earth and lead to skin irritation for humans (Turns, 1996). The reaction mechanisms are listed below (Turns, 1996):
NO + O3 NO2 + O2 (2.11)
NO2 + O NO + O2 (2.12)
Ozone (O3)is destroyed in the first reaction to form nitrogen dioxide (NO2), and then
the nitric oxide (NO) is regenerated in the second reaction to repeat the ozone depletion step. These processes will continue and will only stop when the whole ozone layer is consumed (Turns, 1996).
2.2.4
Factors Affecting NO
xEmissions
There are several factors which affect the formation of NOx in the engine and they
i. The air-fuel ratio (λ) plays a major role in determining the amount of emission of NOx as oxides of nitrogen are formed by the reaction of
nitrogen in the fuel with oxygen in the combustion air. When the air to fuel ratio is greater than one which indicates that the combustion is in the lean condition, the fuel mixture has considerably less amount of fuel and excess amount of air. Engines designed for lean burning can achieve higher compression ratios and hence produce better performance. However, it will generate high amount of NOx due to the excess oxygen
present in the air.
ii. Combustion temperature is also one of the primary factors that influence the formation of NOx. The formation of NOx is directly proportional to the
peak combustion temperature, with higher temperatures producing higher NOx emissions from the exhaust.
iii. The amount of nitrogen in the fuel determines the level of NOx emissions
as fuels containing more nitrogen compounds result in higher levels of NOx emissions. Choices of fuel type alter the formation of both the
theoretical flame temperature reached and rate of radioactive heat transfer.
iv. The firing and quenching rates also influence the rate of NOx formation
where a high firing rate is associated with the higher peak temperatures and thus increases the NOx emission. On the other hand, a high rate of
thermal quenching results in lower peak temperatures and contributes to the reduction of NOx emission.
v. Engine parameters such as load and speed of engine also influence the NOx emissions from the exhaust. When the engine is running under lean
conditions, it emits less NOx. However the nitric oxide (NO) emissions
becomes less significant when the engine is running close to stoichiometric air to fuel ratio. On the other hand, engine speed may increase or decrease the NO emissions as higher engine speed increases the burned gas mass fraction and thus offsets the peak temperature, depending on the exact engine conditions (Bauza, and Caserta, 1997).
2.2.5
NO
xReduction Techniques
According to Turns (1996), the rate coefficient for the O+N2 →NO+N reaction has a very large range of activation temperature and hence the formation of NOx
increases at a fast rate at temperatures above 1800K. One of the effective methods to reduce the production of NOx significantly is to decrease the peak temperature. Any
modifications that lower the peak temperature will lower NOx emission from the
exhaust. Mixing the flue or exhaust gases with fresh air or fuel has demonstrated to be a great way of lowering the combustion temperature in spark-ignition engines. Figure 2.2 shows the correlation of NOx reduction with diluents heat capacity for a
spark-ignition engine.
Since the amount of nitrogen in the fuel determines the level of NOx emissions,
therefore reduction of NOx emissions may be accomplished by replacing the fuel
Figure 2.2: Correlation of NO reduction with diluent heat capacity for a spark-ignition engine (Turns, 1996)
Another engine parameter which results in high levels of NOx emission is the spark
timing. Retarding the spark timing shifts the combustion event closer to top-dead-center resulting in lower peak cylinder pressures, and thus produces lower temperature and reduces the NOx emission. However, retarding the spark timing has
significant fuel economy penalties as a side effect (Turns, 1996).
Turns (1996) also mentioned that the amount of NOx emission from an engine is
strongly linked to the time the combustion products spend at high temperature. In other words, the NOx yield is directly proportional to the amount of time the
combustion is held at high temperature. Unfortunately, adjustments of the time-temperature relationship will sacrifice some useful operations of the engine. Therefore, it is not a practical approach to reduce the formation of NOx by reducing
Apart from that, staged combustion is an effective method in reducing NOx
emissions. It is refers to a rich-lean and lean-rich combustion sequence taking place in the combustion chamber. According to Turns (1996), the concept of staged combustion is mainly about rapid mixing of the fuel and air, and making use of the good stability and low NOx emissions associated with the rich combustion together
with the complete combustion of unburned CO and H2 in the lean stage where the
production of extra NOx is low. The control of the mixing process in practice is the
key factor of this staging process to reduce the emission of NOx from the engine
exhaust. Reductions of NOx emissions are attainable from the range of 10 to 40% with the staged combustion technique.
With the modifications of the automotive applications alone, it is insufficient to reduce the emissions of NOx to the level below the legislated standard. Therefore,
catalytic converters such as three-way catalysts are very helpful to aid the reduction of NOx emissions. In a three-way catalyst, the concentrations of CO, HC, and NOx in
the exhaust must be in stoichiometric proportion in order to result in a simultaneous removal of all three major exhaust pollutants as mentioned above.
2.3
Other Emissions of LPG
Other than nitrogen oxide (NOx), the internal combustion process of spark ignition
(SI) engines using liquefied petroleum gas also produces undesirable emissions such as carbon monoxide (CO), carbon dioxide (CO2), sulphur dioxide (SO2) and
hydrocarbons (HC). These emissions pollute the environment and contribute to global warming, acid rain, smog, odors, and respiratory and other health problems (Southern Technologies).
combustion process. Emission index has the unit of emissions flow per fuel flow (Turns, 1996).
EIi = mi,emitted / mF,burned (2.13)
Therefore, emissions indices for carbon monoxide (CO), carbon dioxide (CO2),
sulphur dioxide (SO2) and hydrocarbons (HC) are as follows:
(EI)co = mco,emitted [g/sec] / mF,burned[kg/sec] (2.14)
(EI)co2 = mco2,emitted [g/sec] / mF,burned[kg/sec] (2.15)
(EI)so2 = mso2,emitted [g/sec] / mF,burned[kg/sec] (2.16)
(EI)HC = mHC,emitted [g/sec] / mF,burned[kg/sec] (2.17)
2.3.1
Carbon Monoxide (CO)
Carbon monoxide (CO) is a colorless, odorless, poisonous gas that is less dense than air under ordinary conditions (U. S. Consumer Product Safety Commission, 2005). It is produced by the incomplete burning of solid, liquid, and gaseous fuels and is the main product formed in rich combustion processes (Turns, 1996). CO is formed when there is insufficient oxygen to convert all the carbon in the fuel to carbon monoxide (Turns, 1996). CO also can be combusted to supply additional thermal energy (Pulkrabek, 1997):
CO + ½ O2 CO2 + heat (2.17)
Normally, the CO emission of a spark ignition engine will be about 0.2% to 5%. CO is found in a rich amount in stoichiometric and slightly lean mixtures due to the dissociation of carbon dioxide at typical combustion temperatures (Turns 1996). Fuel-air equivalent ratio is the most important engine parameter that affects the level of carbon monoxide emission. All other variables only cause second-order effect which is less substantial (Turns, 1996).
2.3.2
Carbon Dioxide (CO
2)
Carbon dioxide is considered as the major greenhouse gas, and it can cause death by suffocation if inhaled in large amounts (Southern Technologies, undated). CO2 has
the tendency to absorb heat radiation of the sun, thus creating a thermal radiation shield which reduces the amount of thermal radiation energy allowed to escape from the Earth. As a result of this, the temperature of Earth rises and accelerates the melting rate of polar ice caps and expansion of oceans into low lying areas (Southern Technologies, undated). To reduce the emission of CO2 efficiently, engines with
higher thermal efficiency that are able to operate at the lowest level of excess air are used (Southern Technologies, undated).
2.3.3
Sulphur Dioxide (SO
2)
Sulfur dioxide (SO2) belongs to the family of sulfur oxide gases (SOx). These gases
dissolve easily in water and are produced when sulfur or fuels containing sulfur are oxidized (Southern Technologies, undated):
S + O2 = SO2 (2.18)
SO2 dissolves in water vapors to form acid, and interacts with other gases and
people and environment. Moreover, oxidation of SO2 will further produce SO3 in the
atmosphere under the influence of sunlight (Southern Technologies, undated):
2SO2 + O2 = 2SO3 (2.19)
Some of the SO3 will also be introduced directly from the combustion processes
alongside SO2. SO3 will react rapidly with moisture from the atmosphere to form
sulfuric acid, which is the main element in acid rain (Southern Technologies, undated):
SO3 + H2O = H2SO4 (2.20)
It had been proven that even with sophisticated combustion techniques; there had been no significant improvement of reduction in the emission of sulphur dioxide. Therefore the best way to solve this problem is the selection of low sulfur content fuels such as LPG (Southern Technologies, undated).
2.3.4 Hydrocarbons (HC)
According to Ferguson (1986), exhaust gases leaving the combustion chamber of a spark ignition engine contains a lot of hydrocarbon components depending on the type of engine used. Some of the exhaust hydrocarbons are not found in the parent fuel and are attributed to other sources. Similar to carbon monoxide (CO), hydrocarbons are also a product of incomplete combustion of fuel (Nett Technologies, undated).
i. Flame quenching at the combustion chamber walls, leaving a layer of unburned fuel mixture adjacent to the wall.
ii. The filling of crevice volumes with unburned mixture which, since the flame quenches at the crevice entrance, escapes the primary combustion process.
iii. Absorption of fuel vapor into oil layers on the cylinder wall during intake and compression strokes, followed by desorption of fuel vapor into the cylinder during expansion and exhaust strokes.
CHAPTER 3
ENGINE
[image:46.612.232.410.352.547.2]3.1
Two-stroke Engine
Figure 3.1: Basic components of a two-stroke engine (HowStuffWorks Inc., 2005)
Figure 3.2: Cross-scavenged two-stroke engine (Colin, 1986)
3.1.1
Advantages of Two-stroke Engine
Two-stroke engines have three significant advantages over four-stroke engines as listed below:
i. Construction of two-stroke engines is simplified since they do not contain valves, thus reducing cost and possessing a higher power per unit weight (HowStuffWorks Inc., 2005).
ii. Two-stroke engines have significant power boost per weight and per volume compared to four-stroke engines because two-stroke engines has a power stroke twice as frequent as the four-stroke engine of the same cylinder displacement (HowStuffWorks Inc., 2005).
iii. Devices such as camshaft and mechanical timing devices which are required in a four-stroke engine are not needed in a two-stroke engine due to the high power density (HowStuffWorks Inc., 2005).
3.1.2 Disadvantages of Two-stroke Engine
However, two-stroke engines are used where efficiency is not of primary concern due to the limitations described below:
i. Generally, the parts of two-stroke engines wear at a much faster rate due to the lack of proper lubrication system, and thus two-stroke engines normally have lower durability than four-stroke engines (HowStuffWorks Inc., 2005).
economy. Short-circuiting permits as much as 20-40% of the air/fuel to flow directly out of the cylinder when the intake and exhaust valves are opened at some point during the two-stroke cycle (U.S. Army Corps of Engineers, undated).
iii. Two-stroke engines produce pollution problems since badly worn two-stroke engines emit huge amounts of oily smoke to the environment (HowStuffWorks Inc., 2005).
3.2 Four-stroke Engine
Figure 3.3: The movement of four-stroke engine, from (a) intake stroke to (b) compression stroke (c) ignition and combustion (d) power stroke (e) exhaust valve opens (f) exhaust stroke (Pulkrabek, 1997)
due of the piston's motion, the pressure and temperature of the gases are decreased. At the end of the power stroke, the pressure of gases approaches atmospheric pressure. The exhaust stroke starts when the exhaust valve is opened by the cam or lifter mechanism and pushes out the residual gases. The exhaust valve closes at the end of the exhaust stroke and the engine begins another cycle. The exhaust stroke completes the combustion process and fuel is converted into forward motion with each motion of the piston as it rises and falls to turn the crankshaft that is responsible for turning the wheels (U.S. Army Corps of Engineers, undated).
3.3 Engine Performance
Engine performance is another major concern in this research project alongside the main aim of analyzing the reduction in the emission of nitrogen oxides using liquefied petroleum gas in spark ignition engine. Some indicators of engine performance such as input power, brake power, specific fuel consumption and engine efficiency are calculated to compare the engine performance between gasoline and LPG.
3.3.1 Input Power
The input power of an engine refers to the maximum energy that can be put into the engine, and is given by:
f
HV m
Q
IP= × (3.1)
HV
Q = Lower calorific value of fuel (MJ/kg)
f m
= Mass flow rate of fuel (kg/s)
Gasoline
HV
Q = 42.1 MJ/kg
LPG
HV
Q = 46.37 MJ/kg
3.3.2
Brake Power
Brake power refers to the power delivered by the engine. During internal combustion, chemical energy from the fuel is converted to generate heat to do work. However, the heat generated cannot be fully converted to work, and some of that are lost to the exhaust flow and to the surroundings by heat transfer. Indicated power (IP), which is used to push the piston to do the work, is used to subtract the friction power to obtain the brake power of an engine. Greater power can be generated by increasing displacement and speed. Brake power is given by:
BP = IP – FP (3.2)
3
10 60
2 ×
= πNτ
BP (3.3)
where BP = Brake power (kW)
N = Engine speed (rpm)
τ
= Torque (N.m)Torque is usually used as a measure of an engine’s ability to do useful work, and it has the unit of Nm or lbf-ft. Apart from that, torque also refers to the measure of the work done per unit rotation (radians) of crank. The magnitude of the torque acting on a body is equal to the product of the force acting on the body and the distance from its point of application to the axis around which the body is free to rotate. It should be noted that only the force component that lies on the rotation plane and perpendicular to the radius from the axis of rotation to the point of application contributes to the value of torque (Answers.com). Torque is given by:
N P
π τ
2 60
= (3.4)
Where
τ
= Torque (Nm)P = Power developed by engine (W)
π
= 3.142N = Engine speed (rpm)
In this research project, the brake power generated is converted to electrical power (EP), which is used to supply electricity to light the electric bulbs. Therefore, the brake power is measured as follows:
I V EP
where BP = Brake power (kW)
EP = Electric power (kW)
V = Voltage (V)
I = Current (A)
3.3.3 Specific Fuel Consumption (sfc)
Specific fuel consumption measures the amount of fuel needed to provide a given power to an engine for a given period. It is an important parameter to compare gasoline and LPG in terms of economic aspect. Sfc is largely dependent on engine design, for example, a typical gasoline engine has a sfc of about 0.3 kg/kWh. However, sfc is inversely related with engine efficiency – a lower value of sfc shows better engine performance. The sfc is defined as:
P m
sfc= f (3.6)
where sfc = Specific fuel consumption (kg/kWh)
f
m = Mass flow rate of fuel (kg/h)
P = Power output (kW)
and
BP m
bsfc= f
(3.7)
where bsfc = Brake specific fuel consumption (kg/kWh)
f
m = Mass flow rate of fuel (kg/h)
BP = Brake power (kW)
There are several factors which affect the value of bsfc. For instance, higher compression ratio delivers a greater bsfc as it extracts more power from the fuel. On the other hand, the value of bsfc will decrease if the combustion occurs with a fuel with equivalence ratio near to unity (Ø = 1). Bsfc will be of greater value at high speed as the friction losses are increased.
3.3.4 Engine Efficiency
Engine efficiency is defined as the ratio of the effective or useful output to the total input in an engine. It also accounts for the fraction of fuel that burns during combustion. For any engine:
Power generated = Wshaft + Wacc + Qexhaust + Qloss (3.8)
where Wshaft = Brake output power of the crankshaft
Wacc = Power to run engine accessories
Qloss = Other energy lost to the surroundings by
Heat transfer
For one engine cycle in a single cylinder, the fuel conversion efficiency ηf is given by:
HV f f
c
f m Q
P Q
m
W =
=
HV
η
(3.9)
and it can be presented the form of:
( )
HVf sfcQ
6 . 3 =
η
(3.10)
Where ηf = Engine efficiency
P = Output power produced per cycle (kW)
f
m = Mass flow rate of fuel per cycle (kg/s)
HV
Q = Lower calorific value of fuel (MJ/kg)
CHAPTER 4
EXPERIMENTAL SETUP
4.1
Introduction
The main objective of the experiment is to investigate the effects of replacing gasoline with liquefied petroleum gas (LPG) and to prove the reduction of nitrogen oxides in a spark ignition engine. All the experimental setups were provided by UNITEN. A Yamaha ET950 engine and Honda GX160 were employed as the test engine in the analysis. Some modifications of the engine are made so that it is possible to switch between LPG and gasoline as the burning fuel and to ease the experiment process. For instance, a mixer is introduced in the generator set so that it is compatible to both LPG and gasoline fuel. The mixer allows air and LPG to mix together to obtain the correct ratio before entering the combustion chamber. It is a cross flow type mixer which is connected to the LPG steel tank via a flexible hose. Besides that, due to fact that LPG has lower velocity flame and hence burns slower compared to gasoline, the spark timing was advanced by shortening the gap between the electrode and insulator nose. According to Toyota Inc. (2005), spark advance control timing gives the maximum engine efficiency by continuously adjusting the spark timings to deliver peak combustion pressure. However by doing so, it results in an increase in the emission of NOx.
loads were used in the experiment to evaluate the performance and pollutant emissions of the engine to compare between gasoline and LPG fuels.
4.2
Engine Specifications
The compression ratio of LPG and gasoline are almost the same - 10.7:1 and 11:1 to 15:1 for LPG and gasoline fuel systems respectively. Therefore, very little modifications are required on the original gasoline engine. Tables 4.1 and 4.2 show the specifications of the two-stroke engine and four-stroke engine used in the experiment respectively.
Model Yamaha ET950 Two-stroke
Gasoline Engine Rated Voltage 240 V
Frequency 50 Hz
Rated output 0.65 kVA Maximum output 0.78 kVA
DC output None
Cooling system Forced air cooled Displacement 63.1 cc
Maximum engine power 2.0HP/3600RPM Starting system Recoil
Dimensions (LxWxH) 366x308x376 mm
Dry weight 20.2kg
Fuel tank capacity (full) 4.2 L Operating hours 6.3 hrs
Bore x stroke 45 x 39.7 mm
Noise level 57 dBA
Model Honda GX160 K1 Four-stroke Gasoline Engine
Type 4-stroke, overhead valve single cylinder , inclined by 25° Total Displacement 163 cm³ (9.6 cu in) Bore & Strike 68 x 65 mm (2.7 x 1.8 in) Max Horsepower (Gross) 4.0 kw / 4,000 min–¹(5.5hp /
4,000rpm ) Compression Ratio 8.5: 1
Fuel Consumption 310 g/kWh (230 g/HPh, 0.51 lb/HPh)
Cooling System Forced-air
Ignition System Transistorized magneto ignition Ignition Timing 25° B.T.D.C (fixed)
Spark Plug BPR6ES (NGK), W20EPR-U
(DENSO)
Carburetor Horizontal type, butterfly valve Lubricating System Splash
Oil Capacity 0.6 lt (0.63 US qt, 0.53 Imp qt) Starting System Recoil or electric start
Stopping System Ignition primary circuit ground Fuel Used Automotive unleaded gasoline
(minimum 86 pump octane) Fuel tank capacity 3.6 lt (0.95 US gal, 0.79 imp
gal)
4.3
Description of Experiment Equipments
The apparatus used in the experiment involve a load bank, digital power meter, pressure sensor, crank angle encoder, flow meter, venture air meter, gas analyzer, digital thermocouple and data acquisition system.
4.3.1
Control Panel
A control panel as shown in Figure 4.1 acts as a digital readout system which consists of the following components:
i. Direct current ammeter
ii. Electric bulbs which act as load bank iii. Digital flow meter
iv. Direct voltmeter
4.3.2
Load Bank
4.3.3
Digital Power Meter
The present test system is able to investigate the engine performance using different values of engine loads by switching the desired number of electric bulbs. The value of electric power, which was consumed by the electric bulbs, is measured by a digital power meter.
4.3.4
LPG Storage Cylinder
LPG is stored under pressure at 800 kPa in a steel tank. Due to the fact that LPG is highly volatile and flammable, it is stored in a high ventilation rate area and kept away from any sources of ignition in the experiment lab. Moreover, the LPG steel tank is equipped with pressure relief valves to prevent the release of LPG vapors to the atmosphere.
4.3.5
Pressure Regulator
4.3.6
Pressure Sensor and Crank Angle Encoder
Engine pressure sensor and crank angle encoder are used to evaluate the indicated power of the engine.
4.3.7
Flow Meter and Venturi Air Meter
LPG flow meter and venturi air meter are operated to measure the specific fuel consumption and the air to fuel ratio. The data collected are then displayed on a Pressure versus Volume diagram, specific fuel consumption versus load diagram and equivalent air-fuel ratio versus load diagram using data acquisition system.
4.3.8
Digital Thermocouple
A digital thermocouple is used to measure the body temperature and the exhaust temperature of the engine accurately during the experiment when running the engine using LPG and gasoline.
4.3.9
Gas Analyzer
For the purpose of data collection of pollutant emissions from the engine using both LPG and gasoline, a commercial portable exhaust gas analyzer (AutoLogic, undated) was employed to measure the content of exhaust gas emissions such as NOx, CO2,
The gas analyzer has a protective design which is mounted in a durable high strength aluminum case that keeps all the connections safe from any accidental shocks. The gas analyzer also features automatic water removal to remove any water from the exhaust of the engine. Water is removed continuously as the system is operated to eliminate frequent purging. Besides that, the gas analyzer also has zero air port which helps to measure pollutant emissions accurately. Figure 4.2 shows the automatic filtering and water removing device that contains in the gas analyzer.
Figure 4.2: Automatic filtering and water removing
4.3.10
Air Fuel Mixer and Air Filter
The air fuel mixer was used to ensure the mixing of LPG and air at the precise air to fuel control ratio for combustion while the air filter was used to deliver high airflow and dirt protection to the engine.
4.3.11
Data Acquisition System
4.4
Experiment Procedures
The analysis was first performed on the gasoline fuel system and then switched to LPG. A control valve was used to change the operation from gasoline to LPG fuel system. The engine was warmed up for around five minutes to reach a steady condition using the original gasoline fuel from the fuel tank of the engine. As the engine was ready to run, the throttle of the engine was adjusted to be in a fully open position to allow more gasoline fuel be supplied into the test engine, thus ensuring the maximum speed. The engine running at maximum speed had been selected as the reference point to compare the performance between gasoline and LPG.
Next, loads were applied to the system by operating the electric bulbs. Different light arrangements were made to investigate various loading conditions. In this experiment, the loads were fixed at 0, 200, 400, and 600 Watts for two-stroke engine as the main application of two-stroke engine are for small personal use and usually loads for 200 to 400 Watts are connected to them while the loads varied from 0 to 1000 Watts for four-stroke engine so that a more extensive coverage of experimental condition can be analyzed. All the data collected which included the engine speed, body temperature, exhaust temperature, voltage, current and concentration of emissions were recorded when steady-state is reached for each set of load values.
two-stroke and four-stroke engine followed the same experimental procedures except pressure sensor and crank encoder were not in used when running the four-stroke engine since the sensors were not available. Therefore, there was no graph showing pressure versus theta for four-stroke engine under the section of discussions and results. Figure 4.3 shows the schematic diagram of the experimental set up used for both two-stroke and four-stroke engine.
CHAPTER 5
RESULTS AND DISCUSSIONS
5.1
Analysis
Results obtained from experimental investigations for both two-stroke and four-stroke engine using gasoline and LPG fuel system were inserted into Excel spreadsheets. Equations regarding the engine performance were derived and entered into the respective spreadsheets in order to obtain the statistical differences between gasoline and LPG system to analyze the emission and engine efficiency. Most of the discussions emphasize on the comparison of emissions and engine performance between gasoline and LPG fuel system at normal load and maximum load. The journal published by Talal et al. (2004) also produced similar results which showed that the data collected are accurate. The data shown in the journal mentioned above are also used to compare to the data collected for this research project.
5.2
Emissions of Two-stroke Engine
The data of emission gases such as NOx, CO2, CO, O2 and HC were analyzed by the
AutoLogic Gas Analyzer. These pollutant emissions were compared for both the gasoline and LPG fuel system. The content of NOx and HC are measured in parts per
million (ppm) while the emission of CO2, CO and O2 are in terms of percentage (%).
“LPG is the Best Solution for Improvement of Air Quality in Malays