1
SCHOOL MAPPING IN GHANA
TRAINING MANUAL
(An MOE/GES/UCC(IEPA)/UNICEF Collaboration)
<-OJ
~unicef
Prepared by Emmanuel Acquaye Charles Y. Aheto-Tsegah
S.O. Owolabi S.K, Atakpa Augustine O. Agu Madeez Adamu-Issah
December 2001
GHANA EDUCATION SERVICE
•
• ••••••I
FOREWORD
The recognition of education as a key factor to the socio-economic development of the nation also imposes the responsibility of ensuring that the focus of education is geared towards the achievement of the broad national goals.
The translation and adaptation of the national objectives into concrete tenns and In accordance with the characteristics of the district and community level management of education is of prime importance and in line with government's decentralisation policy.
This School Mapping Manual is intended to provide the necessary strategies and procedures to administrators of education for the identification of the future needs In education in view of the ever increasing population and in fulfilment of the policy of increasing access and participation in schooling, enhancing management efficiency and improving teaching and learning.
A school mapping process also enables a more accurate assessment of the actual as against the requisite resources in a bid to adopt strategies for the efficient use of available resources while planning for measures to meet the identified needs.
Furthennore, the manual presents infonnation based on a systematic and step-wise approach appropriate for running training programmes for Headteachers/teachers, education managers, NOO's and decentralised staff and for conducting studies into specific areas of education. It provides definitions of key education concepts and indicators useful for a greater understanding of educational issues.
ACKNOWLEDGMENTS
The development of education in Ghana has encountered numerous challenges. Consequently. the search for ways to restore quality in the delivery of this service has become an endless venture. Yet, indications are that there are still gaps in the implementation process.
The decision to undertake School Mapping surveys as a means of going back to the basics of planning was driven by the realisation that a deeper search had to be conducted to enable the acquisition of empirical information that will guide the subsequent decisions needed to revamp the system.
By accepting to go this way. the Ghana Education Service benefited from the immense knowledge and experience of Unicef Ghana. The organisation demonstrated its concern for the welfare of children by accepting to support the development of the conceptual framework and the process that will lead to collation of data that will inform the planning process
The preparation of this Training Manual as a guide to the conduct of the School Mapping in Ghana has become possible because of the assistance of the Institute of Educational Planning and Administration (IEPA). The Institute readily granted Prof. S. O. Owolabi and Mr. S. K. Atakpa, both senior lecturers, permission to help construct the ideas and the framework for the training manual and the instruments. Together with Mr. Emmanuel Acquaye. Mr. Charles Y. Aheto-Tsegah (both from the GES), Dr. Augustine Agu and Madeez Adamu-Issah (both from the Education Programme of Unicef Ghana). the team worked tirelessly to produce this document.
Special appreciation also goes to Mrs. Hilda Eghan, who spent precious time editing the work as well as providing the secretarial services. Mr. Alex Tettey-Enyo. a past Deputy Director-General (Administration & Planning) and Ag. Director-General of the GES. during whose tenure of office this process started deserves to be mentioned for the moral support and institutional memory he provided to guide the preparation. To all the members of the School Mapping Team. who were the first to use this material we are grateful to.
To all others who contributed to making this document a reality we acknowledge your support. It is the hope of the Team that this document will serve as a starting point in the process of helping to ensure the effective planning of education in Ghana.
ABBREVIA TIONS
BECE
DCE
DOE DEOC FCUBE GES INSET JSS NGO PTA SMAG SMC SSSBasic Education Cel1ificate Examination District Chief Executive
District Director of Education
District Education Oversight Committee Free Compulsory Universal Basic Educat~on Ghana Education Service
In-Service Training Junior Secondary School
TABLE OF CONTENTS
Module
1
CONCEPT OF SCHOOL MAPPING
1.0
Objectives1
1.1 Definition of School Mapping ..
1
1.2
Relationship Between School Mapping and SectoralPlanning of Education ..
2
1.3
Application of School Mapping2
1.4
Factors to be Considered in School Mapping ..3
1.5
Phases in School Mapping3
Module
2
METHODOLOGY AND PROCESS OF SCHOOL
MAPPING
2.0
Introduction5
2.1
Objectives5
2.2
Initiation of key Officers5
2.3
Community Awareness Creation6
2.4
Selection of Respondents6
2.5
Data Collection Instruments ..6
2.6
Data Collection and Consolidation8
Module
3
DIAGNOSIS OF THE EDUCATIONAL
SYSTEM AT THE LOCAL LEVEL
3.0
Introducti on 93.1
Objectives 93.2
Access and Participation 93.3.
Quality of Teaching and Learning12
3.4
Management Efficiency and Effectiveness18
Module
4
PROJECTIONS
4.0
Introduction20
4.1
Objectives20
4.2
Population Projection20
Module
4.4 ··L)
5
).0 ).1 ).2
) .3 ).4 ).)
) .6
Projection of Teacher Demand ..
Projectioll of School raci lit ies
OUTPUT OF SCHOOL MAPPING
Introduction
Objectives Coverage
Quality of Teaching and Icaming
Management Efficiency and EfTectiveness
Non-Educational Factors
2) 27
28 28 28 28 29 29 Programming and monitoring of Implementation Process 29
Module 1 CONCEPT OF SCHOOL MAPPING 1.0 Introduction
School mapping, although a globally accepted concept, is yet to make the necessary impact in educational planning. Module 1 offers an in-depth understanding of the concept of school mapping while defining the underlying terms associated with it.
1.1 Objectives
The first module will enable you to:
• Improve your understanding of the concept of scho<?1 mapping and micro-planning;
• Understand the relationship between school mapping and sectoral planning of education;
• Be informed about the stages involved in school mapping;
• Appreciate how different countlies have been applying school mappmg techniques.
1.2 Definition of School Mapping, Educational Mapping and Micro-planning.
(a) School Mapping
This is a set of techniques and procedures used to identify future needs and problems in education at the local level and to plan for measures to be taken to meet them. Preparation of a school map involves:
• An in-depth diagnosis of the situation in the base year;
• Projections of the numbers to be enrolled in the light of national objectives; • Proposals for re-organization of the educational services in the light of the
projections.
(b) Educational Mapping
(c) Micro-Planning
This covers all planning activities at levels other than the national level. These include regional, district, community, village and institutional levels. It is planning at the local level using macro-planning concepts, but allowing participation of local actors who take into consideration the idiosyncrasies of the locality.
1 .3
Relationship Between School Mapping and Sectoral Planning of
Education
The national plan for education in any country defines the quantitative and qualitative objectives and sets the general goals of the education sector for a given period. School mapping is the means by which these objectives will be translated into concrete action. Thus, school mapping ensures that national objectives are adapted to the particular characteristics of each locality. It also allows for a more affective utilisation and accurate assessment of the resources to be used at the local level by the very people who will effect implementation.
1.4
Applications of School Mapping
School mapping is often introduced when a country is embarking on a large-scale education reform. Here are some examples of situations necessitating its use: • To extend the period of compulsory schooling to the age of 16 (France); • To achieve a broader application of the principle of democratisation by
setting up more schools and institutionalising school transport system (Poland);
• To attain Universal Primary Education through the establishment of new schools based on population distribution (Morocco, Burundi and Sudan); • To provide structural reforms and increase access to secondary education
(Thailand, Tunisia, Tanzania and Nigeria);
• To develop a master plan for education (Zanzibar);
• To establish a nine-year basic education system (Costa Rica);
• To achieve qualitative improvement and quantitative expansIOn 10 the provision of education (Swaziland);
• To carry out administrative reforms at the local level by regrouping institutions into clusters (Thailand).
• Increasing access and participation;
• Promoting community participation in the provision of educational facilities; • Improving management efficiency and effectiveness.
1 .5 Factors to be considered in School Mapping The factors to be considered include:
• Purpose of the mapping exercise; • Level of education;
•
Demographic factors (population distribution, population school age population etc.);growth
• Educational factors (courses offered, class size, room size etc.);
rate,
• Geographic factors (road network, means of transport, topography etc.); • Economic factors (parental occupations, average income etc);
• Political factors (community power structure, interest groups etc.);
• Social factors (social resistance to schooling, value attached to girls education etc).
1 .6 Phases in School Mapping
The adoption and use of school mappmg as a method of micro planning of education entails four major phases:
• Government approval (introducing the programme, pilot testing the programme);
• Administrative Organization (in Ghana, the Basic Education Division of GES is, by nature of its functions, responsible for school mapping at the Basic level of Education);
• Awareness Creation (sensitising and mobi lizing stakeholders); • Detailed Planning at the District level.
The Detailed Planning comprises three important stages:
(a) Diagnosis
A thorough analysis of the situation in the base year to highlight:
• Coverage of the education system including inequalities in access; • Quality of teaching and learning;
• Management efficiency and effectiveness; Five questions should guide the diagnosis:
• • •
•
•Are the objectives of education reforms being achieved in the locality? Is educational provision equitable?
Is it of sutliciently good quality?
Are educational services efficiently provided? Are there untapped resources'?
(b) Projection of the potential demand for education
This must take into account the number of children reaching school-going age etc. (c) Preparation of proposals
This must cover the re-organization of the network of educational institutions.
1 . 7 Structure of the Training Manual This training manual complises five modules:
• The first module defines school mapping as a process of identifying and estimating school requirements and identifying the communities and sites where new sehools are to be located and where additional educational facilities arc required:
• The second module describes the methodology and process of school mapping; • In the third module you willleall1 how to analyse educational system at the local
level to reflect the CUITent situation of access and pal1icipation. quality of teaching and leall1ing and management efliciency and effectiveness:
• Module four provides practical guidelines for making projections:
Module 2
2.0
Introduction
METHODOLOGY AND PROCESS OF SCHOOL OF
MAPPING
There is no one methodology that can be applied globally in can'ying out a school mapping exercise. As such, it is important that the characteristics of a given locality be taken into account when deciding on the modalities for this exercise. However, the most pertinent considerations to make in determining the method include the following:
• Initiation of key officers at the district and community levels to accept and participate in the activity;
• Community awareness creation to enable members of the community to be willing to supply data and give suggestions;
• Selection of Respondents;
• Design of data collection instrument; • Consolidation of data collected.
2.1
Objectives
By the end of this module you should be able to:
• Identify the relevant officers to initiate the mapping process at the district and community levels;
• Identify the people to supply required information for school mapping; • Analyse the data collection instrument in the context of the locality.
(a) Initiation of Key Officers at the District and Local levels
In this regard, the office of the DDE, the DEOC members and selected District
Managers of Education should attend methodology seminars on school mappmg.
The main purpose is to make them accept, own and facilitate the activity.
(b) Community Awareness Creation
School mapping involves soliciting information from different social groups in the
community such as Chiefs, Imams and Queen Mothers, Parent Teacher
Associations (PTAs) School Maoagement Committee (SMCs) members, Unit
Committee members, Church pastors as well as the School Head teachers and
Circuit Supervisors. When these opinion, religious and traditional leaders are
sensitised they will be willing to volunteer the required information and thereby
enhance the acceptability of the exercise.
(c) Selection of Respondents
After the district leadership and village opinion leaders have been sensitised about
school mapping, preparations are then made for data collection. At this juncture, it
is important to be clear about the data required, the sources of the data and the best way of collecting them. Usually the districts, circuits, villages, households and schools constitute the sources of data collection. Thus, district officers, circuit
supervisors, village opinion leaders, teachers, sampled parents, and sampled pupils
are expected to give infonnation. Information can also be collected from Non
Governmental Organizations (NGOs) and Development Partners operating in the
locality. Those who play the leading role are often the SMC members who get the
support of the PTA members, the Assemblymen and the Unit Committee members.
In this country, the headteachers are suitably placed in a position to collect
information from the grassroot. These headteachers will require about two days of
orientation, particularly in data collection in order to be well prepared for the
assignment. This team of participants will facilitate the data collection process.
(d) Data Collection Instruments
There are various instruments for collecting data. However, the most commonly
used is the questionnaire, which can be completed eitoer by the respondents or by
the researchers themselves. The questionnaire may consist of closed or open-ended
The nature of the instruments and their respective content should address the three main issues in the FCUBE programme mentioned under the subheading, Diagnosis in Module 1. These are: access and participation, quality of teaching and learning, management efficiency and effectiveness. For each of the three issues there should be a set of relevant instruments for the various groups of respondents.
Thus, in this context, the emerging sets of instruments can conveniently be classified at the levels of the household, village and school. At the household level the instruments should address the status of the children of school-going age outside the school environment. The school level instrument should focus on various rates of performance. These will include transition, promotion, dropping-out, repetition rates, etc. The school-level questionnaire also seeJ<s information on the use and quality of resources and services. The village level instrument seeks to capture the various environmental and non-educational factors that can affect efficient provision of education.
In addition there are focused group issues which are addressed to homogenous community groups.
In Ghana, focused groups will include School Management Committees (SMCs), Unit Committees and District Education Oversight Committees (DEOes).
In focused group discussions, members discuss and give their opinions about the situation of education in their respective areas. The researcher writes down the main points arising from the discussions. This allows both the investigator and the group members to clarify issues that cannot be clarified through questionnaires. Data can also be obtained from secondary sources including census figures from the Statistical Service and from official documents and minutes of meetings. The circuit supervisors' reports, which are available at the district offices also contain valuable information on the situation in the schools that could be referenced.
It is also important to go through the files in the offices of the District Director of Education and extract necessary information. The regional offices of the Ghana Education Service (GES) as well as the headquarters have educational statistics, policy documents and guidelines that will be useful. Where many respondents are involved, it will be sufficient to have a representative sample so that it includes all
strata or the population, In school mappln!2 rcsL'~lrch culture. ~tli villd!2cs and their
respective schools!2ct involved in the survcy,
(e) Data ColleL'tion and Consolidation
Alter revie\\ln!2 thc instrumcnts and conccptLl~tllslng thcm. thcre IS a need to
producc el1ou!2h copies 1'01' thc projected IlLlmhcr oj respondcnts In cach category,
It IS 1111]1()]1ant that thc rL'spondents arL' 11ll'ormcd ahout the dates and prohablc time
to mect thcm, This IS pal1icularly importdnt \\hl'rl' rocuscd !2roup diSCUSSion arc
Involvcd, It IS also Impurtant to hc fricndly a III I patlcnt whcn solicitln!2 informatIOn frum respondcnts, \1akl' surc th~lt allthc llL'ms arL' rcspo11lkd to,
Arter data havc hccn c'ollel'tcd. thl') ~lIl' tl~l1lSll'ITl'd Irom thl'll rl'Spcl'tl\C duly filled
Module 3
DIAGNOSIS OF THE EDUCATIONAL SYSTEM AT THE
LOCAL LEVEL
3.0
Introduction
In order to attain the three fundamental objectives of school mapping outlined in module 1, one has to diagnose the educational system at the local level by considering four factors. These are access and participation; quality of teaching and learning; management efficiency and effectiveness and non-educational factors.
3.1
Objectives
•
•
•
This module is to help you to be able to:
Identify the data needed for analysis;
Study educational coverage at the school, village, circuit an.d district levels;
Identify, calculate and interpret indicators for analysing the . quality of teaching and learning;
• Assess the efficiency and effecti veness of educational services.
3.2
Access and Participation
Under this sub-heading, the trainer should adequately explain the terms access and participation and learn how to compute the key indicators.
(a) Access
Access is a way of getting to someplace or someone. We need to study the availability of the school network to school-going age children in a district to be able to know if the network of schools, as presently organized and territorially distributed, is serving the school age population efficiently. There are physical, economic as well as socio-cultural dimensions to access.
1. Physical access denotes the extent to which a school is close to pupils' homes and how easily they can move from one to the other. In this respect the trainer should take into account, distance, means of transport and the time taken to travel between school and home. Specifically, four issues are addressed; distance travelled, travel means used, time of journey and location of pupils' homes.
II. Economic access addresses the issue of schools that may be inaccessible to some
children because of financial scarcity. Schooling is tuition-free in Ghana, but there
are other elements of finance that may affect schooling. These are school levies, school uniform, transport costs, food and other school related items etc. and the opportunity cost of staying in school (the earnings one is foregoing by being in school).
Ill. Socio-cultural access deals for example with a community which rejects schooling because its culture does not allow it to be perceived as important. Modifying the culture to integrate the practice of schooling may be a necessary step to take (e.g. children entangled in the trokosi, fiasidi and bragoro systems). Transforming the context and methods of teaching or modifying the timetable may make schooling accessible to more children.
(b) Participation
This refers to the proportion of children who take effective advantage of educational supply. Key indicators are admission rate, enrolment rate, literacy rate etc.
I. Admission Rate - Right from the first entry level, pupils' ages do not often correspond to the official admission age, since both early and late entry occur. For this reason three types of admission rates exist:
• Apparent Admission Rate (AAR) - This rate is the simplest to calculate. It is called "apparent" because it is not exact. It is therefore of little use. The rate is obtained by dividing the total number of all children entering a level no matter what their ages may be, by the official entry-age and expressing it as a percentage. In Ghana where the primary entry age is 6 years, the AAR calculated as:
AAR
=
Number of New entries 6 years (official entry age)x
100 1ASAR
=
New 6-year old entries 6-year age groupx
100 1ASAR clearly clarifies entry behaviour at any given age but it does not enable us to know the real proportion of children born in a given year who ultimately enter school, before, after or at the official age. This however can be given by the Cohort Admission Rate.
• Cohort Admission Rate (CAR) - The term "cohort" is given to a group of children born in the same year. To calculate the CAR, one can choose a given demographic cohort e.g. children born in 1990 and follow it for several consecutive years whilst studying their entry age to school.
II. Enrolment Rate - Three types of enrolment rates are brought into focus. They are
Gross Enrolment Rate (GER), Net Enrolment Rate (NER), and Age-specific Enrolment Rate (ASER).
• Gross Enrolment Rate (GER)
This is calculated by dividing total enrolment in a given educational level (whatever may be their ages) by the age group corresponding to the official age for the level, and converting the result into a percentage. For example if primary education lasts 6 years and if the official entry age is 6 years as in Ghana, the official age group corresponding to primary education is therefore 6 to 11 years.
GER in Ghana is therefore expressed as follows:
GER
=
Total primary enrolment 6-11 year age group• Net Enrolment Rate (NER)
x 100 1
This rate relates the enrolment of children of the official age for a level to the population of the same group. For pupils in primary school in Ghana the Net Enrolment Rate is
NER = Pupils enrolled aged 6-11 6 - 11 age group
II
NER is a measure for a homogeneous group as it shows the proportion of children
aged 6 - 11 who are actually in school. This is the popular rate for making
international comparisons of educational performance. However the rate excludes
pupils who have not yet reached the official age because they entered early, and also
those who are above the official age because they entered late or are repeating.
• Age-Specific Enrolment Rate (ASER)
This is calculated by taking the enrolment rate specifically for each annual age
group. For example the enrolment rate for 6-year olds is obtained by making the
following calculation:
6-year old enrolment rate = Pupils aged 6 years 6-year age group
x 100 I
(iii) Out-of-School Children and Adult illiterates - The trainer should point out to the
trainees that this sub-heading has a direct link with participation in education. In
this sub-section focus is on school-age children out of school and also on the
illiterate population (Adults between 18 and 55 years). Thus illiteracy rate (IR) is
the percentage of the adult population that is illiterate.
What is sought regarding out-of-school children is their distribution by age and sex,
their respective villages, their home situations, what they are doing. why they are
not in school and their aspirations. Because this group is of special interest to
educational managers information is collected from the out-of-school child, hislher
parents and the village opinion leaders. With the illiterate population the objective is
to find out the percentage of those currently attending adult literacy classes, those
who do not, why they are not doing so and what kind of assistance they would
need in order for them to become literate.
3 .3 Quality of T-eaching and Learning
The quality of teaching and learning can be inferred from both documentary and
perceptual data. The documentary data on flow of pupils. staffing conditions and
availability of facilities and resources can provide information on the conditions of
teaching and learning in a school. Other things being equal. a school that has
adequate resources for teaching and learning provides motivation for better
performance more than a school that lacks essential requirements. But whether a
to by using perceptual data which is data based on the perceptions of key stakeholders of Education e.g: Teachers, Parents, Circuit Supervisor etc.
(i) Flow of Pupils - To judge the quality of teaching and learning one can calculate the rates at which pupils move from grade to grade and from level to level. The
indicators generally used in this regard are: promotion, repetition and dropout rates; transition rates; retention/progression/completion rates and rates of performance in external examination.
These are the rates used to assess the Internal Efficiency of the education system. Internal Efficiency is defined as the ability of the education system to educate the greatest number of pupils who have entered the system in the shortest time and with the least use of financial and human resources.
The trainer needs to point out to the trainees the limitations of some of these rates in assessing quality of education. Pupils are often promoted by the system's own standards. The class teacher determines the quality of promotion examinations. Since there are no standard examination questions for all schools there is a limit to which one can rely on the results of promotion examinations as a measure of educational quality. At best they can show where a child stands relative to other children in the class.
• Promotion Rate (p)
This is the percentage ratio between the number of pupils who enter grade g, in the year t and the number of pupils in grade g-I in the year t-I. That is:
p P(g.t)
x
100E(g-I, t-I) 1
Where p P E g-I t-l =
=
=• Repetition Rate (r)
promotion rate number promoted enrolment
previous year previous grade
This is the percentage ratio for a grade g, between the number of repeaters for the year t and the enrolment in year t-1. That is:
r R(gJ} E(g,t-I)
x 100
1
Where r
=
repetition rate R=
Number of repeaters• Drop-out Rate (d)
This is the percentage ratio for a grade g, between the number of pupils who drop out in year t and the enrolment in the same year. That is:
d
=
IXW
x
100 E(g,t)Where d
=
dropout rateD
=
number of drop-outs•
Transition Rate (tr)The transition rate (tr) from primary to JSS is the percentage of pupils in the final class of primary education who are selected to continue their studies in JSS during the following year.
• Retention Rate (rr)
This shows the proportions of pupils who entered at the same time in grade I, who reach grades 2, 3,4, until the final grade.
rrg
=
LEiUl
x
100 EU, I)Where IT
=
retention rateP
=
Number promoted g=
grade (1,2,3, ... )=
years (1,2,3, ... )EU, I)
=
Enrolment in grade j, year 1• Progression Rate (pr)
This.is the percentage ratio between the number of pupils enrolled in grade g in the year t and the number of pupils enrolled in grade g-I in the year t-l.
• Completion Rate (cr)
This indicates the percentage of pupils who complete the final grade. It is computed by dividing the number of those who complete the cycle by the original number of pupils who were in the first grade times 100.
cr = ~
x
100 SgWhere C
=
Number completed S=
Number who started g=
First grade(ii) Rates of Performance In External Examination - At the basic level, the BECE examination which is an external and common examination for all pupils is considered a better measure of academic performance.
(iii) Staffing Conditions - A number of factors related to the teaching staff of a school are taken into account when determining a school's perfonnance. These are the teacher qualification, teacher distribution by sex and pupil-teacher ratio.
• Teacher Qualification
When teachers in schools are analysed according to their academic and professional backgrounds one can easily note which schools have better or less qualified staff. This ultimately can lead to a staff rationalisation which will favour less endowed schools in tenns of staff.
• Teacher Distribution by Sex
It is essential to know the distribution of the teachers by sex. As such the percentage of women among teachers is calculated. In districts where the girl-child schooling is still meeting with some resistance on the part of the parents, adequate representation of women teachers on the staff will enhance the role model effect for girls education.
• Pupil-teacher Ratio
This is obtained by dividing the total number of pupils by the total number of teachers. It gives an idea of the workload of teachers and shows if they are being efficiently utilised. Average teaching periods per teacher provides similar infonnation. The essence of diagnosing staffing conditions is to provide basis for a
re-organization and re-distribution of supply and move closer towards equitable
educational opportunitie~.
(iv) Diagnosis of the School Plant - A common inventory of basic educational
resources, facilities and services that a trainer has to bring to the attention of the
trainees include building materials, furniture, textbooks and teaching materials. The
others are appropriate facilities, supervision/inspection and services.
The trainer is expected to point out the adequacy or otherwise of each item In respect of expected and actual supply. This process of comparing expected and
actual supply calls for awareness of the official norms/criteria prescribed by GES.
Besides, the trainer has to comment on the quality and utilization of the items and
services in question in order to determine other possible sources of inefficiency and
inadequacy.
• Buildings
These cover classrooms, toilets, staff quarters, staff rooms, offices libraries,
workshops, etc. In respect to these what should be observed would include
availability, adequacy, condition (repairs required) and utilization ratios in terms of
the pupils or staff so that comparison is made with the officially approved ratios.
Find out what these ratios should be: Classroom-pupils ratio, house-teacher ratio,
staff room-teacher ratio, toilet-pupil ratio, library-school ratio, desk-pupil ratio,
table and chair teacher-ratio etc.).
The trainer has to comment on space and time utilization of rooms. Space
Utilization Rate (SUR) compares the average size of the groups using a room with
the capacity of the room. Time Utilization Rate (TUR) compares the periods for
which the premises are actually used to the theoretical duration of use.
By comparing· required with actual ratios one can derive absolute shortages and
surpluses for various buildings and indicate how efficiently they are being utilized.
Over and above this, one has to observe the quality of these buildings by paying
attention to permanent against temporary ones, the materials used for constructing
• Furniture
Furniture ordinarily covers desks, tables, chairs, cupboards, etc. The Desk-Pupil
Ratio (DPR) varies from locality to locality. In some schools, it is 1: 2. In others,
it is 1: 3. Table and Chair Teacher Ratios are based on the number of available
classrooms since each of these would require at least one teacher's table and chair.
For cupboards, one is needed for each classroom and for each available office.
• Textbooks
The number of textbooks that would be required in any school is based on the
Textbook-Pupil Ratio (BPR) of 1: 1 or 1:3 where there are shortfalls. The number
of textbooks depends on the number of subjects offered in a school. The trainer is
expected to comment on shortages/surpluses in the various subjects and grades
expressed in absolute and percentage terms. The condition
of.
the existing textbooks must also be commented on.• Teaching Materials
The main point here is for the trainer to point out the need for having inexpensive
but durable materials and for ensuring the regular supply of stationery. These
include teaching guides (l per subject per class) dusters, chalkboard, ruler. The
absence of these simple but basic items not only makes teaching difficult but also
de-motivates both the teacher and the pupil.
• Other Facilities
Other teaching and learning facilities such as computers, resource centres make
teaching and learning more convenient. Researches have consistently shown that
availability of school resources positively influence the quality of teaching and
learning. It can be observed that some well endowed schools have these facilities.
(v) Supervision and Inspection
Supervision and inspection are important factors which influence the quality of
teaching and learning. Well-kept records on circuit supervisors for instance serve as
a monitoring tool and a means of assessing the level of their effectiveness.
(vi) Perceptual Data
The quality of teaching and leaming can also be inferred from the level of
satisfaction of teachers, parents and circuit supervisors. The perceptions of
teachers and circuit supervisors about the level of instructional interaction in the
classroom can reveal to some extent, what is going on in respect of teaching and
learning in a school.
Questions are asked to reveal the following: levels of teacher participation In
decision-making, quality of teaching method. level of use of audio-visual
equipment, quality of preparation for teaching, quality of method of evaluation,
classroom and school climates. The same questions are posed to head teachers and
circuit supervisors for cross validation. Causes for low or poor ratings arc sought
for and respondents are asked to suggest what should be done to improve the
situation. Responses here are very impol1ant in that they can be inputs into the draft
of school maps.
The pupils are to answer similar questions from their own perspective. The
quotient is the average response that can be interpreted by refening to a determined
key of quotients. For example, 3.5 compared to a maximum quotient of 5.0 will
mean the tight thing is done quite often or the respondent is quite satisfied. This
constitutes the external efficiency of the education system. The results provide a
feedback on how satisfied or otherwise clients are with the educational services
provided.
3.4 Management Efficiency and Effectiveness
In a well-managed educational system teachers should have adequate opportunities
to enhance their professional development. To obtain information on this aspect,
head teachers arc asked to rate the frequency of in-service training programmes in
their school~. The analysis is useful for informing the educatronal administrator
about the statLis of professional development of teachers in his/her district or region.
Both the head teacher and the SMC members who are responsible for the
day-to-day management of their school give their perceptions on the effectiveness and
efficiency of the School Management Committees. Since a major goal of school
mapping is 10 enable local-level people to manage theIr schools better: the
Similarly, In order to know the situation on the ground, the total number of
responses to individual questions become the basis for recommendations. There will be the need to prohe further or an'ange focus group discussion if head teachers and SMC members are having significantly divergent views on issues raised. When suggestions are congruent what to recommend becomes clear.
The District Director on his part throws a search light unto him/herself to see the level of his involvement in the management of schools in his district. Questions related to hislhcr role are answered in order to allow for an evaluation of the level of his/her own management efficiency and effectiveness. Candid responses can be a useful basis for the drafting of the school map.
The last part under management efficiency and effectiveness seeks for inputs from NGOs and Development Partners that operate in the district. It seeks to know what these organisations are doing and can do to improve management efficiency and effectiveness of schools.
3.5 Non-Educational Factors
These factors include the environment of the community In which the school is
situated, size of the community, economic activities, average income, general education, village amenities and infrastructure. Others relate to cultural practices and the expectations of the villagers in respect to returns on investment in education.
Module 4 PROJECTIONS
4.0 Introduction
To facilitate educational planning, there is the need for projecting into the future school enrolments and resources. This is in fulfilment of the essence of planning, which is to estimate the basic education requirements over the planned period and to devise strategies to meet them.
4.1 Objectives
This module will enable you to understand:
• How to make projections of population figures such as school- age population of a district using the Growth Rate Model;
• How to project the number of children going to school for the first time using the Admission Rate;
• How to make grade-wise projection of school enrolments using the Grade Ratio and Flow Rate Models;
• How to make projections of teachers and facilities.
4.2 Population Projections:
In school mapping tradition we are interested in projecting the total and school-age populations. In projecting total populations. we arc able to make future estimates of the number of people in an area.
To make projections one must have the base year data. For example, a projection of population figures for 2001-2005 should consider the population figure for 2000 or previous years in order to be able to do the estimation.
Populations'can be projected using the geometric fonTIula: Pt
= Po
(l +r) I wherePo
=
Population of base yearr
=
Rate of growth of the population=
Time of projectionThis constitutes the Growth Rate Model of Projection. For example if the popUlation for 2000 (P2000) and its rale of growth (r) are known, the population for the year 2010 can be obtained from the formula. P2010
= P 2000
(l +r)10 sinceIf the population of district X for year 2000
=
340,000 and its rate of growth r=
2.8% then 2.8 = 0.028100
The projected population for year 20 I 0 wi II therefore be:
P2010
=
P2000 (1 +0.028) III = 340,000 x (1.028) 10=
340,000 x 1.318947758=
448,136If 1.02810 cannot be obtained from a calculator one can use logarithms to carry out the calculations. This is how it is done:
P2010
=
Log P2010
=
=
=
340,000 X 1.02810 Log 340,000 X 1.02810 Log 340,000 + 10 log 1.028 5.5314789 + 0.119931
=
5.6514099 Antilog=
448,136Similarly, pnmary school age population (6-11 years) or basic school age population (6-14 years) could be projected in the same way. Its rate of growth could be assumed to be the same as that of the total population. For example, if in the above case the population aged 6 - 14 years in year 2000 was 61,200; then the school age population in year 20 I 0 could be obtained from the formula:
School Population SP20 10 = 61,200 X 1.02810 = 80,664
If the propol1ion of the school-age group to the total population is known, then it can be calcubted straight from the projected total population. For example, if in the above case it is known that the 6-14 year age group constitutes 2Y'/o of the total population, we can calculate it from the total projected population as follows:
Total population in year 2010
Population aged 6-14 years
=
=
21
448,136
25(!c of 448,136 25 x 448.136
4.3 Enrolment Projection
Future enrolment depends basically on three factors: the growth of the school-age
population, the policy regarding expansion access and participation and the social
demand for education.
Usually, there are four stages in projecting enrolments: determination of admission
rate; calculation of new admissions; estimation of rates of promotion and repetition;
calculation of enrolment.
(a) Admission Rate
Admission rates are determined either by past trends or by policy guidelines. When
programmes are launched to accelerate the pace of educational development, the use
of past trends will not be satisfactory. For example, the target date for attaining
100% admission rate in the FCUBE document was not derived on the basis of past
trends. It is a desired target.
Factors that often influence the setting of rates of admission include
• Need to democratise basic education (accessibility to all)
• Need to reduce gender disparity
• Need to reduce urban/rural disparity in access to education.
General objectives are set at the national level and admission rate for the whole
nation for the planned period is determined. For example, the government of
Ghana may set 90% admission rate for the year 2005 if it is currently 85%. This
would mean the admission rate would have to increase by 1 % every year over the
five-year period. But a local setting may reveal a current admission rate of 80%.
Adaptation of the overall objective to each local setting is required. This is
considered the role of school mapping that is, a process of "successive reduction"
(little-by-little) of the difference between the national target and the local target. This
will suggest that the admission rate will have to increase in the locality by 2 points
every year, for the planned period.
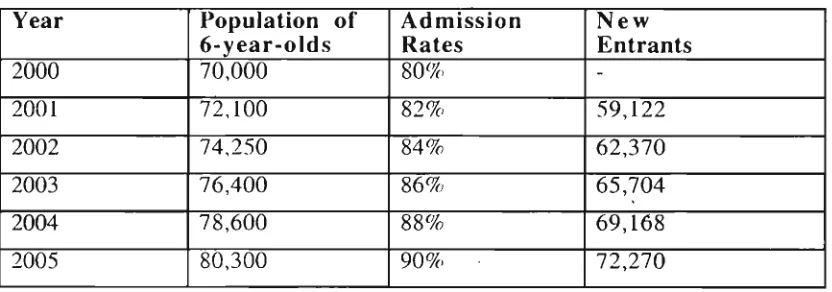
(b) Projecting New Admissions
Once the admission rate (intake rate) is determined and the population of 6-year olds
Primary 1 can be calculated. Suppose the population of 6-year-olds in the Central
Region in the year 2000 was 70, 000 and the admission rate was 80%. Let us
assume that the regional target is as given above. To project new entrants we
merely multiply the 6-year-old population of a year with the admission rate for that
year. This is shown in Table 1
Table 1 : Projection of New Entrants
Year Population of Admission New
6-year-olds Rates Entrants
2000 70,000 80(ff,
-2001 72,100 82% 59,122
2002 74,250 84% 62,370
2003 76,400 86% 65,704
2004 78,600 88% 69,168
2005 80,300 90% 72,270
(c) Estimation of Rates of Promotion and Repetition:
Once the forecast of the number of prospective new entrants is made the next step is
to detennine their movements through the level during the plan period. For this we
shall have to detennine rates of promotion from grade to grade, and also the
repetition rates. (Refer to Module 3).
It is better to collect these rates for a number of years, say 5, and then to find the
average. These average rates are assumed to remain constant throughout the
planned period. Therefore the promotion and repetition rates to use for projection
are the computed average rates.
(d) Projection of Enrolment by Year of Study
Two different models can be used to project enrolment for subsequent grades.
They are called Grade Ratio Model and Flow Rate Model.
• Grade Ratio Model
Here, enrolment in a grade is projected by simple extrapolation of enrolment in the
grade below ie the year hefore. Enrolmcnt in the first grade is composed of new
entrants (policy detem1ined) and of repcaters. Suppose Circuit X of a rural district
[image:29.612.83.499.183.329.2]Table 2 Enrolments in Basic School (BS) 1 - 6 in Circuit X
Year of BS BS BS BS BS BS Total
Enrolment 1 2 3 4 5 6
2000
161
152
149
140
165
209
976
2001
156
153
148
144
142
243
986
The apparent promotion rate or Grade Ratio is obtained by dividing the number of
pupils in one year by the enrolment in the grade below ie the year before. The
grade ratio from Primary 1 to Primary 2.
Enrolment in
BS 2, 2001
=
153
=
0.95
Enrolment in
BS 1,2000
161
The grade ratios for the other classes can thus be calculated. As noted before, the
rates for several consecutive years are calculated and the averages are adopted for
making short-term projections.
Projected enrolments for the next three years are shown in the model below.
Grade Ratios Model
1st 2nd 3rd 4th 5th
Year t
t
+
1'----~
t
+
2 '---_~t+31191
6th
[image:30.614.101.501.386.594.2]The grade ratios are marked on the an·ows. The merit of this model is the simplicity of its calculations. It can be used when there is a system of wholesale promotion. The promotion rates arc no longcr apparent but real and are each equal to 100%. It leads to a quick projection of enrolments.
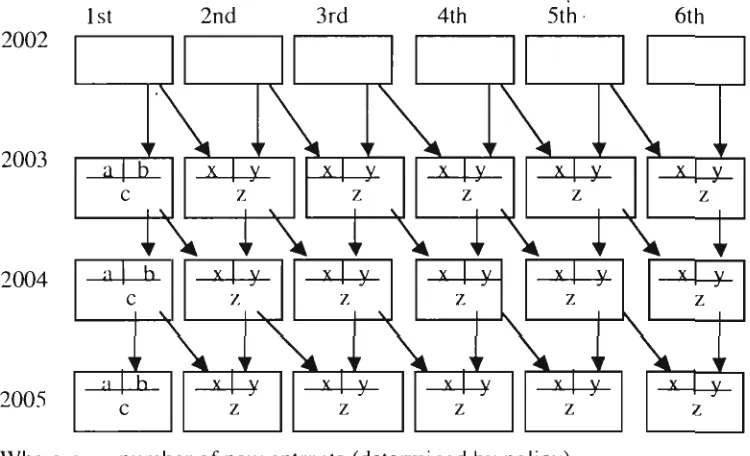
• Flow Rate Model
The flow rate model keeps much closer to reality. Enrolment in a given grade and year is divided into thosc promoted from the grade below and those repeating the same grade. The projection table is constructed on the lines of the Grade Ratios model.
Table 4 : Flow Rate Model
1 st 2nd 3rd 4th 5th· 6th
2002
2003
2004
2005
c z z zz
Where a
=
number of new entrants (detctmined by policy) b repeaters in Primary 1c
=
total of new entrants and repeaters (Enrolment in Primary I) x=
promotees from the lower classy
=
repeaters in the same classz
=
total of x and y (enrolment in the new class)z
[image:31.611.115.490.282.510.2]repetition rate indicated by the vel1ical arrows to the enrolment of the same grade the previous year. Underneath (z) will be the total of promotees plus repeaters. This .can be summarised as:
Promotees
This projection can continue into .ISS and SSS. But in the first columns of .ISS and SSS sections we \vill be using transition rates instead of promotion rates.
Note: A third <lITOW could have been placed from each hox showing the numbers who drop out at each stage. But dropout _.d npt usually feature in projections.
4.4 Projection of T('acher Demand
There arc two ways of pn)jecting teacher demand in this country: (a) By using number of cL,sses (in the primary section) (b) By lIsing pupillteacher ratio (in the J.S.S. section)
The official P'·'K·tice is to assi~'n onc teacher per class per stream the primary school. Where one head teacher is in charge
or
both primary and JSS section he/she becomes a detached head teacher. In Junior Secondary Schools the pupil teacher ratio of 25: I is often used tu determine the required number of teachers for a ~,chool.The procedllre for prl)ll~Ltlng !Lacher demand cunsists of:
(a) Calcul:..iting the number of teachers reqUIred by the above methods (b) Calculating present year (base year) shortage/surplus of teachers.
(c) Projecting additional enrolment of pupils in the planned period and additi(lIlal numher of classes/sti·eams.
(d) Calculating the additional numbe:' of teachers due to enrolment and stream expansIons
-t.5 Projection of SdlOOI Facilities
Projectioll
or
school facilities can also be made. The first stage is to take stock of the existing facilities and calculate the shortfall or surplus using the existing GES norms for thc supply of those facilitics. Then a projection of pupil cnrolmcnt and strcam cxpansion is madc. For some of the facilitics the quantity to supply arc hascd cithcr on thc numbcr of pupils or on the number of streams/classrooms.After the standard norms are cstahl ished. calculations can be made to dctelmine requiremcnts in the base year and in the subsequent years of projection. The cUlTent (base year) shortages will be calculated in the normal way by subtracting the available number from the number required. This sholtage together with the projected additional requirements due to expansion will give the total requirements of all th~ items at the end of the projection period or in each year of projection, as the need may be. Of course, some facilities will not change in number as the school expands. Examples arc the school library, stores, sickbay and SpOtts/play field.
Module 5
OUTPUT OF SCHOOL MAPPING
5.0
Introduction
This last module discusses the output of school mapping. The focus is on how to work out proposals to extend, rationalize or restructure the school network or in more general terms, the educational services so as to solve some of the problems identified in the diagnostic analysis of the educational system at the distlict level. The output is essentially a "frame" for a plan. This frame is expected to comprise the major actions to be taken to resolve identified constraints. To prepare proposals the officers in charge need to be aware of the already laid down norms and standards and understand the basic plinciples to apply in delineating catchment areas of schools. The plan frame is expected to address the three main areas diagnosed that is, educational coverage, quality of teaching and learning, management efficiency and effectiveness. Non-educational factors affecting provision of education are also expected to be looked into.
5.1
Objectives
This module focuses attention on the outputs expected from the diagnostic analysis of:
• Access and Participation
• Quality of Teaching and Learning
• Management Efficiency and Effectiveness • Non-Educational Factors
5.2
Coverage
The following are some of the expected programmes to be addressed under this plan:
• Enrolment expaAsion in the various villages/localities;
• Requirements for classroom expansions and siting of new schools; • Launching of appropriate action for out-of-school children;
5.3
Quality of Teaching and Learning
improving the perfonnance of pupils in BECE examinations need to be explored. This may require re-organization of supply, as well as in service training programmes for both teachers and head teachers.
5.4 Management Efficiency and Effectiveness Emphasis should be placed on:
• Inter and intra-circuit re-distrihution/re-organization of available resources and services in order to restore equity.
• Forl11ulation of strategies hy which the local community will share more cost (e.g. providing suitahle accommodation to attract teachers) and accept more responsi bi Ii tics.
• Drawing of educational maps by circuits. These maps are to guide inter and intra circuit re-distribution and re-organization of resources/services.
• Identification of strategies hy which the state of the physical resources can be improved.
5.5 Non-Educational Factors
This sub-item addresses the strategies by which non-educational constraints in the school catchment areas can be resolved so that they pennit future efficient provision of education.
5.6 Programming and Monitoring of Implementation Process
Once the major programmes to be embarked upon have been identified, their implementation has to be classified into short, long and medium-tenns. Even within each phase, implementation has to be indicated in tenns of circuit (and their respective schools) that are to be covered. Further more, each programme has to be accompanied with relevant monitoring and evaluation indicators, which will clearly reveal the extent to which implementation may have taken place.
<3
MI F
I
SCHOOL MAPPING FOR GHANA
1.
Access and Participation
(Part 1.1 : Enrolment Numbers in the School)
The Headteacher Gender ... . Age ... . Respondent
Level of School Name of School Circuit
Pre-school
c=J
Primaryc=J
JS~ ... Type of School:(Please tick (~) applicable option) Private
c=J
Public
c=J
District and Region : Partnership
c=J
Region
1.1.1 Indicate by grade and gender the total number of pupils enrolled in your school in the school year 200112002
KGl KG2 II S-1 BS-2 llS-3 BS-4 BS-S BS-6 BS7 llS8 llS9 TOTAL
M
I F
MI F
MI F
MI F
MI F
MIF
MIF
MIF
MIF
MIF
MIF
M
rV-I
I
I
I
I
I
I
I
I
I
I
I
1.1.2 Indicate by age and gender the total number of pupils enrolled in your school in the school yeill' 199912000.
4
5 6 78
9 10 11 12 13 14 TOTALMI
F
MI
F MIF
MIF
MIF
MIF
MIF
MIF
MIF
M IF
MIF
M IF
1.1.3 Information about boy pupils Enrolment
Year
1'1
P2 P3 P-J P5 1'6 Suh Total1987/88
I
1988/89
1989/90
1990/91
1991/92
1992193
1993/9-J
1994/95
1995/96
1996/97
1997/98
1998/99
1999/2000
2000/2001
1.1.4 Information about girl pupils Enrolment
Indicate by grade, girl pupils' enrolment in your school from 1987/88 to 2000/2001
Year
PI
P2
P3
P4
P5
P6
Sub Total1987/88
1988/89
1989/90
1990/91
1991192
1992/93
1993/94
1994/95
1995/96
1996/97
1997/98
1998/99
1999/2000
l.l.5 Information about boy pupils Enrolment by year of bil1h (YOB)
Indicate by year of birth, boy pupils' enrolment in your school in the year 200012001
BOY'S
PI
P2
P3
P4
P5
P6
SubYOB Total
1982
1983
1984
1985
1986
1987
1988
1989
1990
1991
1992
1993
1994
1995
TOTAL
1.1.6 Information about girl pupils' Enrolment by year of birth (YOB)
Indicate by year of birth, girl pupils' enrolment in your school in the year 2000/2001
GIRL'S
PI
P2
P3
P4
P5
P6
Sub TotalYOB
1982
1983
1984
1985
1986
1987
1988
1989
1990
1991
1992
1993
1994
1995
1.1.7 Provide the following information for
boys
in your school during the year 199912000.BS - 1 B - 2 BS - 3 B - 4 BS - 5 BS - 6
No. Promoted
No. Repeated
No. Drop-out
1.1.8 Provide the following infonnation for girls in your school during the year 1999/2000.
BS - 1 BS - 2 BS - 3 BS - 4 BS - 5 BS - 6
No. Promoted
No. Repeated
No.
Drop-out
1.1.9 Provide the following information for
all pupils
in your school during the year 1999/2000.BS - 1 BS - 2 - 4 BS - 5 B
6
No. Promoted
No. Repeated
No. Drop-out
1.1.10 What do you think were the main causes for their dropping out?
They dropped out because: ... .
(a) Their parents could not pay levies
(b) They had to work to help their parents
(c) They were sick
(d) They were forced to leave school by their school teachers
(e) They were in initiation (e.g. puberty rites trokosi, fiasidi, bragoro)
(0
They were receiving Quoranic education(g) Their parents did not care for them
(h) Their parents have divorced/separated
(i) Their parents have cd
U>
They got manied (k) They got pregnant(I) Any other specify)
1.1.11. Do you have a Junior Secondary School section in your school?
7
Yes No
b
1.1.12. If yes, how many pupi Is were promoted to JSS 1 in 2000?
Boys Girls Total
I
No. Promoted1.1.13. How many pupils of your school had the following grades in English and Mathematics:
Grade 1 2 3 4 5 6 7 8 9
Boys
English Girls
Total
Boys
Mathematics Girls
Total
1.
Access and Participation
(Part 1.2 : Enrolment Numbers in the VillageiLocality)
Respondent
Village/ Locality
Circuit
District
Headteacher
.
Information about school-age children in the village/ Locality.
Region:
1.2.1 School pupils enrolled in your school travel an average distance of ... kms. to school.
1.2.2 Estimate the percentage of pupils who travel more than 3km. to your school
1.2.7 By what means do pupils travel? Estimate the number of pupils of your village who travel to school by each means below:
On foot
By
donke1.2.8 The journey to school takes approximately ... minutes.
1.2.9 In the year 2000 the number of pupils not admitted nor enrolled in school because of lack of either
uniforms or levies were ... and ... respectively
1.2.10 In the year 2000 the number of pupils who were not sent to commence fOlmal schooling because the community does
1.2.11 In the year 2000 the number of pupils who were not enrolled in BS -1 to BS-6 in school because the community does not perceive schooling important was ... ..
1.
Access
and Participation
(Part
1.
3 : Non - Schooling in the village)
Respondent
Village
Circuit District
Assembly/SMC/Unit committee member.
Region
1.3.1 Total of all ollt-or-school children in your village/ Locality in the year 2000 were ... males and ... females
1.3.2 Indicate by gender and age in the Table below all out-of-school children in your village/locality in the year 2000:
Vi II age/ 6 7 8 9 10 11 12
Locality
M
I
F
M
I
F
M
I
FM
I
fM
I
F
M
I
FM
I
I
I
I
I
I
I
I
Village 13 14 15 16 17 TOTAL
Locality
M
I
F
M
I
FM
I
F
M
I
F
M
I
FM
I
FI
1
I
I
I
I
I
1
1.
Access and Participation
(Part 1. 4 : Non - Schooling in the village)
RespondentVillage/ Locality
Out-or-School Child. Age of Respondent ... Gender
Circuit
Distrid Region
Family En\ironment
1.-1-.1. Which IS the hIghest level of education achieved by your Illother and father .j
Father Ne\er been to Primary Middle/Junior Sec. Secondary
TTC
Diploma SchoolSchool School School
Mother :\e\er been to Plimary Middle/Junior Sec. Secondary
TTC
Diploma School:-,chool School ScholJl
1A.2 110\\ many brothers do you have? 1.-I-.l 110\\ Illany sistl'l's do you have?
1.-1-.-1- Arc VOL! all fmr1l the same mother? Yes
C=:J
NoC=:J
1.-1-.5 How many people live in the same home as you'?lA.6 Do you have a radio in your horne? Yes
c=J
N0c=J12
University