R E S E A R C H A R T I C L E
Open Access
Meta-analysis to compare the accuracy of
GeneXpert, MODS and the WHO 2007 algorithm
for diagnosis of smear-negative pulmonary
tuberculosis
Simon Walusimbi
1,2, Freddie Bwanga
1, Ayesha De Costa
2, Melles Haile
2,3*, Moses Joloba
1and Sven Hoffner
3Abstract
Background:Smear-negative pulmonary tuberculosis (SN-PTB), which is common in HIV-infected patients, is difficult to diagnose using smear microscopy alone. In 2007, the WHO developed an algorithm to improve the diagnosis and management of smear-negative tuberculosis in HIV prevalent and resource constrained settings. Implementation of the algorithm required individuals with presumptive TB to be initially evaluated using two sputum microscopy examinations followed by clinical diagnosis that may include chest X-ray and antibiotic treatment in smear-negative individuals. Since that time, the WHO has endorsed several new tests for diagnosis of tuberculosis. However, it is unclear how the new tests perform when compared to the WHO 2007 algorithm in diagnosis of SN-PTB. Using meta-analysis study design, we summarized and compared the accuracy of Xpert® MTB/Rif assay (GeneXpert) and Microscopic Observation Drug Susceptibility assay (MODS), with the WHO 2007 algorithm in the diagnosis of SN-PTB.
Methods:A systematic review and meta-analysis of publications on GeneXpert, or MODS, or the WHO 2007
algorithm for diagnosis of SN-PTB, using culture as reference test was performed. Meta-Disc software was used to obtain pooled sensitivity and specificity of the diagnostic methods. Heterogeneity in the accuracy estimates was tested by reviewing the generated forest plots, sROC curves and the Spearman correlation coefficient of the logit of true positive rate versus the logit of false positive rate.
Results:Twenty-four publications on all three diagnostic methods were meta-analyzed. The pooled sensitivity and specificity for detection of smear-negative pulmonary tuberculosis were 67% and 98% for GeneXpert, 73% and 91% for MODS, and 61% and 69% for WHO 2007 algorithm, respectively. The sensitivity of GeneXpert reduced from 67%
to 54% when sub-group analysis of studies with patient HIV prevalence≥30% was performed.
Conclusion:The GeneXpert, MODS, and the WHO algorithm have moderate to high accuracy for the diagnosis of
SN-PTB. However, the accuracy of the tests is extremely variable. The setting and context under which the tests are conducted in addition to several other factors could explain this variability. There is therefore need to investigate these factors further. The information from these studies would inform the adoption and placement of these new tests.
Keywords:Smear negative, Pulmonary TB, GeneXpert, MODS, WHO TB algorithm
* Correspondence:[email protected] 2
Department of Public Health Sciences, Karolinska Institute, Stockholm, Sweden
3
Department of Diagnostics and Vaccinology, Swedish Institute for communicable Disease Control, Solna, Sweden
Full list of author information is available at the end of the article
Background
The global burden of tuberculosis (TB) remains high with 8.7 million new TB cases estimated to have occurred in 2012 [1]. The majority of the new TB cases (80%) occurred in 22 countries and a substantial proportion (35%) were smear-negative pulmonary TB (SN-PTB). In these coun-tries, TB diagnosis relies mainly on smear microscopy which has a highly variable sensitivity ranging from 20% to 60% [2,3]. In sub Saharan Africa, where the preva-lence of 44 HIV is relatively high and TB is a common opportunistic 45 infection, TB/HIV co-infected patients frequently present with SN-PTB. This is because HIV patients usually form poor lung granulomas/cavities when infected with TB, resulting in lower concentra-tions of Mycobacterium tuberculosis (Mtb) in the lesions [4], which can pose diagnostic difficulties [5].
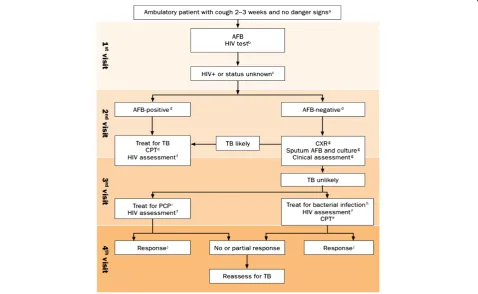
In 2007, the WHO issued an algorithm for the diagnosis of SN-PTB for use in resource-limited settings with high HIV infection rates [6]. Adoption of this algo-rithm (Figure 1), was expected to improve diagnosis and
[image:2.595.59.538.342.636.2]management of smear-negative tuberculosis. However, the diagnostic methods used when the algorithm was made, have since then been improved upon or entirely new tests have been developed. The WHO has also endorsed several of these new tests [7]. Further, the WHO 2007 algorithm outlines a lengthy diagnostic pathway which requires a pa-tient to visit the clinic four times before a clinician decides whether to treat a patient as a case of smear-negative tuber-culosis. In practice, few patients complete all the elements of the algorithm (see Figure 1) before a decision to treat or not is taken [8]. In addition, although the algorithm encour-ages sputum culture during the second clinic visit to assist the confirmation of diagnosis of smear-negative TB, this is often not practically possible. Reasons for this include firstly that the commonly available TB culture method in many of the focus settings is the Lowenstein-Jensen (LJ) method, a solid based medium that takes several weeks to detect bac-terial growth. Secondly, in many of the countries for which the algorithm was developed, culture facilities are often limited to reference laboratories with insufficient capacity
to meet the national demand for culture confirmation [1]. Because of the reasons mentioned above among others, there has been limited success in improving diagnosis of smear-negative TB using the algorithm.
More recently, the WHO endorsed the Xpert® MTB/Rif assay (GeneXpert) for the diagnosis of TB [9]. The GeneXpert relies on DNA-PCR technique for detection of TB and Rifampicin resistance related mutations simultan-eously. It is the first molecular assay for TB detection to be fully automated and to integrate all the steps required for PCR-based DNA test. It gives results within 3 hours. The test has also been reported to be highly accurate for diagno-sis of pulmonary TB [10]. Patients with presumptive HIV-associated TB who are negative on smear examination are the most likely to benefit from GeneXpert [11].
Another new test is the Microscopic Observation Drug Susceptibility assay (MODS). The WHO recently endorsed the test for rapid screening of multidrug-resistant TB [12]. The MODS relies on two well-known properties of M.tb i.e. (i) the rate of growth of M.tb in liquid medium is considerably quicker than on solid medium(ii) the morphology of M.tb in liquid culture is characteristic and recognizable, consisting of so called “cord” like structures [13]. Thus by using an inverted light micro-scope to examine tissue culture plates inoculated with sputum, M.tb growth can be detected within 7–10 days, compared to conventional solid culture that takes several weeks [14]. In settings where conventional culture services for diagnosis of TB are not readily available, the MODS could be an alternative for early diagnosis of SN-PTB since it is simple, rapid and cheap.
However, evidence on the performance of the GeneXpert, MODS assay, and the WHO 2007 algorithm for diagnosis of SN-PTB is scanty. In this study, we did a meta-analysis to summarize and compare the accuracy (sensitivity and specificity) of the GeneXpert (a molecular based assay), the MODS (a rapid culture method) and the WHO 2007 algorithm (an algorithm based method) for the diagnosis of SN-PTB. We considered all the elements of the WHO 2007 algorithm (its entirety) as one test.
Methods
Study design
A systematic review of publications on GeneXpert, MODS and the WHO 2007 algorithm for the diagnosis of SN-PTB was performed, followed by a meta-analysis.
Search strategy
Initially, we performed an electronic search in Pubmed without year restriction for articles in English for each test individually. The search terms used were‘GeneXpert’,
‘Microscopic observation drug susceptibility’, and ‘WHO TB algorithm’. We then reviewed the retrieved abstracts and selected publications for full text review. After fully
reading the selected publications, their bibliographies were also reviewed and relevant additional publications were also retrieved for full text review. To ensure that no relevant publications were missed, we also performed a search in Google Scholar, but no additional publications were found.
Inclusion
We selected peer-reviewed articles published until 30th May 2012. The publications should have used the GeneXpert, or MODS, or WHO 2007 algorithm, for diagnosis of pulmonary TB. The inclusion criteria were: i) use of culture as the reference method (LJ, or 7H10 agar, or BACTEC 460, or BACTEC MGIT 960). ii) Pub-lications should have reported data to allow first hand computation of sensitivity and specificity of the test for SN-PTB. In papers where this was not reported, we con-tacted the corresponding authors to request provision of the required data.
Data extraction
We created an excel spreadsheet and collected data on 20 variables per article, including: index test, author and year of publication, culture method, country of study, study HIV prevalence, sample size, specimen type, culture method, and numbers of true positive, true negative, false positive, and false negative. Numbers of the positive and negative values were extracted either directly or through calculation based on reported measures of accuracy. The obtained data were verified by a second investigator.
Assessment of quality of study publications
Publications included in the meta-analysis were assessed for quality using the QUADAS-2 tool [15]. The tool con-sists of four key domains that judge bias and applicability of the reviewed studies by reviewing how patients were se-lected, the index test, the reference standard, and the flow of patients through the study. These variables were also included in the main data excel spreadsheet.
Data analysis
algorithm [8], we analyzed and reported the results sep-arately. This is because the authors aimed to evaluate the effect of various patient and provider factors on the performance of the algorithm in a rural versus urban setting. They therefore reported the diagnostic perform-ance of the algorithm at the two sites separately but in one publication.
Analysis for heterogeneity
As study results can be variable (heterogeneous), it is critical to explore this heterogeneity to understand the possible factors that influence the obtained accuracy estimates and whether it is appropriate to pool them. Heterogeneity can either be due to chance or due to differences in the threshold that is used to define positive and negative results of a test.
We explored for heterogeneity due to chance (other than threshold effect) for each diagnostic method by; i) visual inspection of the forest plots for deviation of sensitivity and specificity of each study from the vertical line correspond-ing to the pooled estimates. Large deviations from this line would indicate possibility of heterogeneity, (ii) Chi-square
p-values, which are automatically computed by Meta-disc during analysis. A low Chi-square p-value would suggest presence of heterogeneity beyond what could be expected by chance alone and, (iii) the inconsistence index (I-square), which is also automatically computed by Meta-disc soft-ware. The inconsistence index is a quantitative measure of the amount of heterogeneity [17]. We interpreted the inconsistence index as follows: 0% to 40%: not important; 50% to 70%: represented moderate heterogeneity; > 70% represented substantial heterogeneity [18].
Heterogeneity due to threshold effect was explored by plotting summary receiver operating curves (sROC) for each diagnostic method to assess if the points in the plots had a curvilinear (shoulder arm) pattern or not. A typical
“shoulder arm”pattern would suggest presence of thresh-old effect [16,19,20]. The Meta-disc software automatically computes and shows the statistical analysis of the area under the sROC curve and the Cochrane indices (Q*). As a further assessment of threshold effect, we also calculated the Spearman correlation coefficient between sensitivity (logit of the true positive rate) and specificity (logit of the false positive rate) for each test. If threshold effect exists, an inverse correlation appears. We considered a positive Spearman correlation coefficient of > 0.6 to be strong, and suggestive of threshold effect [21]. If the value was less than 0.6, the accuracy of the tests could be based on pooled esti-mates of sensitivity and specificity.
Results
Publications retrieved
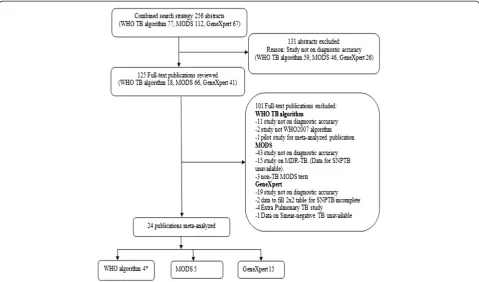
The systematic review based on all the stated strategies retrieved a total of 256 abstracts. After reviewing the
abstracts, 125 publications (WHO algorithm 18, MODS 66 and GeneXpert 41) were fully reviewed. Due to various reasons such as; a test not being evaluated for diagnostic accuracy or data to allow computation of sensitivity and specificity not reported (see Figure 2), 101 publica-tions were excluded leaving twenty-four publicapublica-tions for final meta-analysis (GeneXpert-15, MODS-5, and WHO 2007 algorithm-4).
Description of meta-analyzed publications
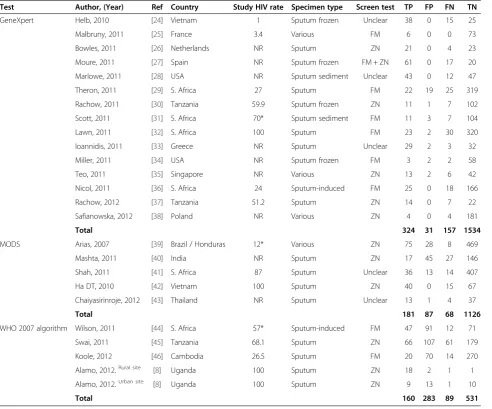
Of the 24 publications that fulfilled the inclusion criteria for meta-analysis, the study HIV prevalence in 9 of them was≥50% (GeneXpert-4, MODS-2, WHO 2007 algorithm-3). In addition, 10 of the 24 publications were conducted in countries from sub-Saharan Africa (GeneXpert-6, MODS-1, and WHO 2007 algorithm-3). Further, 6 out of 15 publications on GeneXpert used fluorescent mi-croscopy (FM) as the screening test, while 3 out of 5 publications on MODS used Ziehl-Nielsen microscopy (ZN) as the screening test, and 2 out of 4 publications on the WHO 2007 algorithm used either FM or ZN. A summary of the description of the studies meta-analyzed is presented in Table 1.
Results on diagnostic accuracy
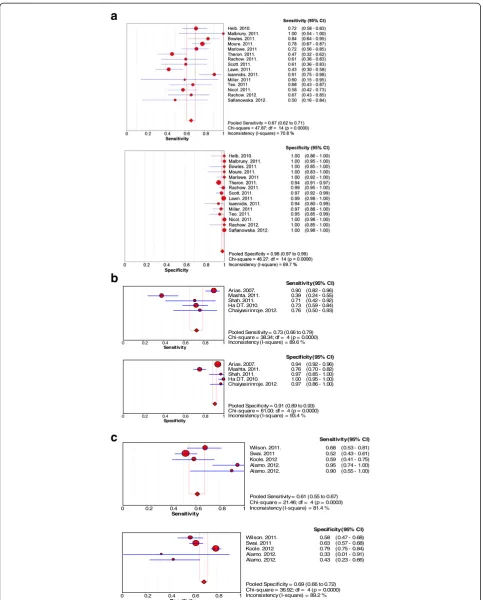
The results of the sensitivity and specificity of each test are shown in Figure 3. Overall, there was large deviation from the pooled estimates in the forest plots for all the three tests indicating the possibility of heterogeneity. However, the deviation was seen more with forest plots for sensitivity than specificity. The Chi-square p-values for heterogeneity for all three tests were low.
GeneXpert
The pooled sensitivity and the 95% confidence interval for GeneXpert was 67% (62% to 71%) while the pooled specificity was 98% (97% to 99%). On visualization of the forest plots, there was large deviation from the pooled estimate for sensitivity by several studies. For specificity, deviation from the pooled estimate was small. However, the I-square values for both sensitivity and specificity were above 40%.
MODS
WHO 2007 algorithm
The pooled sensitivity and the 95% confidence interval for the WHO 2007 algorithm was 61% (55% to 67%) while the pooled specificity was 69% (66% to 72%). On visualization of the forest plots, there was large deviation from the pooled estimate for both sensitivity and specificity by two studies. The I-square values for both sensitivity and specificity were also above 70%.
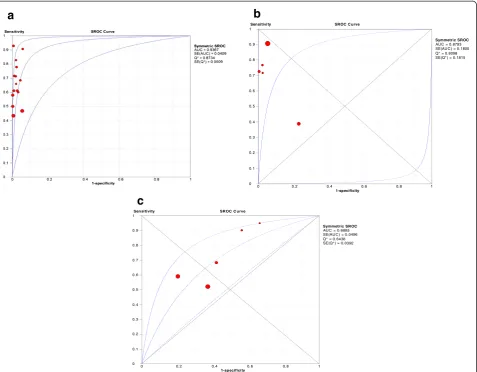
Analysis for threshold effect by summary receiver operating curves (sROC)
The patterns of the sROC curves are shown in Figure 4. The curves were consistent with each of the included reports of accuracy, with one outlier point (study) clearly detected in the sROC curve for MODS. The areas under the sROC curves and Cochrane (Q*) indices were 0.94 and 0.87 for GeneXpert, 0.87and 0.81 for MODS, 0.69 and 0.64 for WHO 2007 algorithm, respectively.
Spearman rank correlation for analysis of threshold effect
The Spearman rank correlations between the logistic transformations (logit) of the true positive rate (TPR) plotted against the logit of the false positive rate (FPR) for each method is presented in Table 2. Only the WHO 2007
algorithm had a significant and strong positive correlation coefficient of threshold effect.
Sub-group analysis
Having found indication of possible heterogeneity, we performed the following sub-group analyses.
Based on HIV prevalence
[image:5.595.58.538.89.371.2]For the GeneXpert, we focused on publications of studies in settings with HIV prevalence≥30%, a typical value for TB patients from sub-Saharan Africa, where the GeneXpert is expected to be of much benefit due to the high levels of HIV-associated TB [9]. There were four publications, from such high HIV prevalence settings; two from South Africa and two from Tanzania, which we sub- analyzed. The pooled sensitivity of the GeneXpert from these settings was reduced from 67% to 54%, while the specificity remained 99%. These results are presented in Figure 5. For the WHO algorithm, a similar sub-group analysis gave a sensitivity of 65% and a specificity of 55%. We did not perform a similar sub-analysis for the MODS because the publications were inadequate for the analysis. Instead, we performed a sub-group analysis, excluding the outlier study which had reported what the authors
decsribed as“ unexplained observed disturbing incon-sistencies in results”, when they used the MODS for diagnosis of smear-negative TB [40]. Pooled sensitivity of MODS increased from 73% to 82%, and specificity increased from 91% to 95%.
Based on screening tests used
Since FM microscopy is increasingly becoming an alter-native to ZN microscopy for diagnosis of TB in several settings [48], we also performed subgroup analysis for
[image:6.595.57.550.100.509.2]studies that used FM versus ZN as screening tests. The sensitivity for GeneXpert for studies that used FM as screening test was 52% and specificity was 98%. For studies that used ZN the sensitivity for GeneXpert was 69% and specificity was 99%. None of the studies evaluating MODS used FM as a screening test, thus a similar sub-analysis was not possible. However, the sensitivity for studies that evaluated MODS using ZN as screening test was 73%, while the specificity was 90%. There were an inadequate number of studies that evaluated WHO 2007 algorithm Table 1 Key characteristics of the meta-analyzed reports (n = 24)
Test Author, (Year) Ref Country Study HIV rate Specimen type Screen test TP FP FN TN
GeneXpert Helb, 2010 [24] Vietnam 1 Sputum frozen Unclear 38 0 15 25
Malbruny, 2011 [25] France 3.4 Various FM 6 0 0 73
Bowles, 2011 [26] Netherlands NR Sputum ZN 21 0 4 23
Moure, 2011 [27] Spain NR Sputum frozen FM + ZN 61 0 17 20
Marlowe, 2011 [28] USA NR Sputum sediment Unclear 43 0 12 47
Theron, 2011 [29] S. Africa 27 Sputum FM 22 19 25 319
Rachow, 2011 [30] Tanzania 59.9 Sputum frozen ZN 11 1 7 102
Scott, 2011 [31] S. Africa 70* Sputum sediment FM 11 3 7 104
Lawn, 2011 [32] S. Africa 100 Sputum FM 23 2 30 320
Ioannidis, 2011 [33] Greece NR Sputum Unclear 29 2 3 32
Miller, 2011 [34] USA NR Sputum frozen FM 3 2 2 58
Teo, 2011 [35] Singapore NR Various ZN 13 2 6 42
Nicol, 2011 [36] S. Africa 24 Sputum-induced FM 25 0 18 166
Rachow, 2012 [37] Tanzania 51.2 Sputum ZN 14 0 7 22
Safianowska, 2012 [38] Poland NR Various ZN 4 0 4 181
Total 324 31 157 1534
MODS Arias, 2007 [39] Brazil / Honduras 12* Various ZN 75 28 8 469
Mashta, 2011 [40] India NR Sputum ZN 17 45 27 146
Shah, 2011 [41] S. Africa 87 Sputum Unclear 36 13 14 407
Ha DT, 2010 [42] Vietnam 100 Sputum ZN 40 0 15 67
Chaiyasirinroje, 2012 [43] Thailand NR Sputum Unclear 13 1 4 37
Total 181 87 68 1126
WHO 2007 algorithm Wilson, 2011 [44] S. Africa 57* Sputum-induced FM 47 91 12 71
Swai, 2011 [45] Tanzania 68.1 Sputum ZN 66 107 61 179
Koole, 2012 [46] Cambodia 26.5 Sputum FM 20 70 14 270
Alamo, 2012.Rural site [8] Uganda 100 Sputum ZN 18 2 1 1
Alamo, 2012.Urban site [8] Uganda 100 Sputum ZN 9 13 1 10
Total 160 283 89 531
Specimen type various included = bronchial aspirate, bronchial alveolar lavage. ZN = Ziehl-Nielsen microscopy stain method.
FM = Fluorescent microscopy stain method.
TP = True positive (Individuals have disease and have positive test). FP = False positive (Individuals do not have disease, but have positive test). FN = False negative (Individuals have disease, but have negative test). TN = True negative (Individuals do not have disease and have negative test). NR = Not reported.
a
b
c
Sensitivity
0 0.2 0.4 0.6 0.8 1
Arias. 2007. 0.90 (0.82 - 0.96) Mashta. 2011. 0.39 (0.24 - 0.55) Shah. 2011. 0.71 (0.42 - 0.92) Ha DT. 2010. 0.73 (0.59 - 0.84) Chaiyasirinroje. 2012. 0.76 (0.50 - 0.93)
Sensitivity (95% CI)
Pooled Sensitivity = 0.73 (0.66 to 0.79) Chi-square = 38.34; df = 4 (p = 0.0000) Inconsistency (I-square) = 89.6 %
Specificity
0 0.2 0.4 0.6 0.8 1
Arias. 2007. 0.94 (0.92 - 0.96) Mashta. 2011. 0.76 (0.70 - 0.82) Shah. 2011. 0.97 (0.85 - 1.00) Ha DT. 2010. 1.00 (0.95 - 1.00) Chaiyasirinroje. 2012. 0.97 (0.86 - 1.00)
Specificity (95% CI)
Pooled Specificity = 0.91 (0.89 to 0.93) Chi-square = 61.00; df = 4 (p = 0.0000) Inconsistency (I-square) = 93.4 %
Sensitivity
0 0.2 0.4 0.6 0.8 1
Wilson. 2011. 0.68 (0.53 - 0.81) Swai. 2011 0.52 (0.43 - 0.61) Koole. 2012 0.59 (0.41 - 0.75) Alamo. 2012. 0.95 (0.74 - 1.00) Alamo. 2012. 0.90 (0.55 - 1.00)
Sensitivity (95% CI)
Pooled Sensitivity = 0.61 (0.55 to 0.67) Chi-square = 21.46; df = 4 (p = 0.0003) Inconsistency (I-square) = 81.4 %
Specificity
0 0.2 0.4 0.6 0.8 1
Wilson. 2011. 0.58 (0.47 - 0.68) Swai. 2011 0.63 (0.57 - 0.68) Koole. 2012 0.79 (0.75 - 0.84) Alamo. 2012. 0.33 (0.01 - 0.91) Alamo. 2012. 0.43 (0.23 - 0.66)
Specificity (95% CI)
[image:7.595.57.541.87.688.2]Pooled Specificity = 0.69 (0.66 to 0.72) Chi-square = 36.92; df = 4 (p = 0.0000) Inconsistency (I-square) = 89.2 %
using FM as a screening test. However, for those studies that used ZN as the screen test, the sensitivity was 60% and the specificity was 61%.
Based on patients not completing all elements of the WHO 2007 algorithm
Lastly, since the WHO 2007 algorithm is widely used for diagnosis of smear-negative TB, but in practice few patients complete all the elements of the algorithm before clinicians exclude or initiate treatment for smear-negative TB, we performed a sub-group analysis of the WHO algorithm, excluding the publication that reported performance
Sensitivity SROC C urve
1-specificity
0 0.2 0.4 0.6 0.8 1
0 0.1 0.2 0.3 0.4 0.5 0.6 0.7 0.8 0.9 1
Symmetric SROC AUC = 0.8793 SE(AUC ) = 0.1800 Q* = 0.8098 SE(Q*) = 0.1815
a
b
c
Sen si ti vi ty SROC C u rve
1-sp ecificity
0 0. 2 0. 4 0. 6 0. 8 1
0 0. 1 0. 2 0. 3 0. 4 0. 5 0. 6 0. 7 0. 8 0. 9 1
[image:8.595.61.539.89.461.2]Symmetric SROC AUC = 0. 6885 SE(AUC ) = 0.0496 Q* = 0.6438 SE(Q*) = 0. 0392
Figure 4Summary receiver characteristics (sROC) (a) curve- GeneXpert, (b) curve- MODS and (c) curve- WHO 2007 algorithm.
Note:sROC = summary receiver operating characteristic curve, which is a plot of the true positive rate (sensitivity) against the false positive rate (1-specificity) of a diagnostic test at different thresholds [47]. This generates a composite statistic (AUC or the Index Q*) that provides an overall evaluation of the accuracy of a test (perfect discriminating ability of true positivity from false positivity). The three curves of the sROC represent the estimate and the 95% upper and lower bounds of the estimate. AUC = Area under the curve of a constructed sROC curve. An AUC close to 1.0 signifies that the test has almost perfect discrimination while an AUC close to 0.5 suggests poor discrimination. An AUC significantly less than 0.5 would indicate that the criteria for“normal”and“abnormal”should be reversed. SE (AUC) = standard error of the area under curve Q* = An index which corresponds to the upper most point on the sROC curve at which sensitivity equals specificity. The closer this value is to 1, the closer the test to perfect accuracy (perfect discriminating ability of true positivity from false positivity). When the value of the Q* index is close to 0.5, it signifies that the test has poor discrimination. SE (Q*) = the standard error of the index Q*.
Table 2 Spearman correlation coefficient of the logit of TPR versus logit of FPR
Test Spearman correlation coefficient p- value
GeneXpert 0.232 0.405
MODS 0.4 0.600
WHO 2007 algorithm 0.9 0.037
[image:8.595.57.290.653.707.2]of the algorithm based on data of those patients that completed all the elements of the algorithm before cli-nicians decided if to treat or not [8]. The pooled sensi-tivity of the WHO algorithm reduced from 61% to 57%, while specificity increased marginally from 69% to 70% (data not shown).
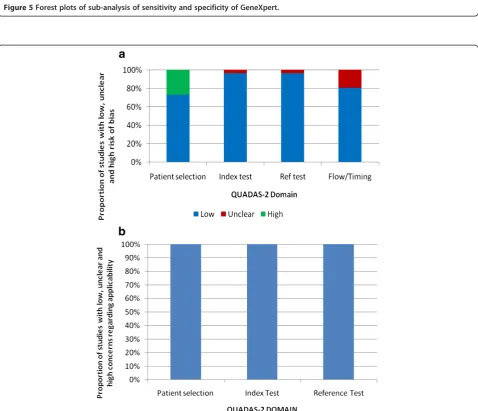
QUADAS results of meta-analyzed publications
Seventeen out of the 24 meta-analyzed publications (70%) had a low risk of bias. Of the publications at risk of bias, six were on GeneXpert, while one was on WHO 2007 algorithm. The source of risk in these publications arose principally from unclear and flow of patients. However, all the publications matched the review ques-tions, and therefore had low concern for applicability. The overall quality of the 24 publications is shown in Figure 6, while the quality of for the individual studies are shown in Table 1.
Discussion
We set out to compare the accuracy of GeneXpert, MODS and the WHO 2007 algorithm, for diagnosis of SN-PTB by doing a meta-analysis of the published lit-erature. To our knowledge, this is the first study done to compare the accuracy of the three methods for the diagnosis of SN-PTB.
Overall, the MODS had the highest pooled sensitivity of 73%, followed by the GeneXpert with sensitivity of 67% and the WHO 2007 algorithm with sensitivity of 61%. GeneXpert had the highest pooled specificity of 98%, followed by MODS with 91% and the WHO 2007 algo-rithm with 69%.
There was substantial heterogeneity in the accuracy estimates for all the three tests that we evaluated, with the inconsistence indices (I2) ranging from 71% to 90% for sensitivity, and 70% to 93% for specificity. Considering the sROC curves in view of the substantial heterogeneity, the GeneXpert had the highest accuracy for detection of SN-PTB with an area under the curve of a constructed sROC curve (AUC) value of 0.94, followed by MODS with 0.88 and the WHO algorithm with 0.69.
Several reasons can explain the heterogeneity that we observed. These include; variations in the HIV preva-lence among study patients and the corresponding vari-ation in the severity of TB disease. Additionally use of either FM or ZN as the screening test including operator/ technician performance, type of specimen tested, and differences in the culture methods used as reference test can explain the variability.
Thus, the observed heterogeneity for the GeneXpert could be due to differences in the severity of HIV and the co-morbidities among the patients evaluated, since the test is fully automated after sample processing, re-quiring no technician involvement. On the other hand,
technician performance could be a major factor in the heterogeneity observed for MODS, since inexperienced technicians could confuse artefacts for M.tb cords.
With regard to heterogeneity observed for the WHO 2007 algorithm, few clinicians fully adhere to the algorithm in practice, due to operational difficulties. Therefore, the decision by clinicians if to treat or not for SN-PTB is made variably. For example, of the 4 studies on the WHO 2007 algorithm in our review, only 1 reported results based on full adherence to all the elements of the algorithm [8]. However, full adherence to the algorithm in this study was quite low, ranging from 13% for the rural site to 19% for the urban site. Based on this report, in a best case scenario, the sensitivity of the algorithm is 95% (95% CI; 74%-100%) while specificity is 33% (95% CI; 23%-68%). On the other hand, based on the 3 other reports on the WHO 2007 algorithm, the sensitivity of the algorithm in a real world scenario is 57% (95% CI; 50%- 64%,) while specificity is 70% (95% CI; 66%-73%). The variable ac-cess to some of the tests in the algorithm such as chest X-ray could explain the heterogeneity observed for the WHO 2007 algorithm.
Our results of the GeneXpert for diagnosis of SN-PTB are similar to those recently reported by the Cochrane Collaboration® [49]. Both our findings and those by the Cochrane group are however lower than what was re-ported in another publication, where the authors found sensitivity of GeneXpert for smear-negative PTB to be 75% and specificity 98% [50]. However, it was not clear whether they used the random-effects model for this subgroup analysis in their report. The random-effects model is the recommended analytical approach for meta-analysis since it incorporates heterogeneity among studies as opposed to the fixed-effects model which ignores heterogeneity [51].
Unlike in the report by the Cochrane group, where meta-analysis for the effect of HIV on the diagnostic ac-curacy of GeneXpert for SN-PTB could not be done, due to the small numbers of publications, in our study we found that the sensitivity of GeneXpert reduced from 67% to 54% while specificity remained unchanged. This finding was based on four studies with HIV prevalence≥30%, an HIV rate which is commonly seen in six of the nine TB high burden countries from sub-Sahara Africa [1].
Figure 5Forest plots of sub-analysis of sensitivity and specificity of GeneXpert.
[image:10.595.59.538.301.712.2]Limitations
Our study had the following limitations: There were few publications on MODS and the WHO2007 algorithm on diagnosis of SN-PTB. Moreover a substantial number of the publications on these two tests had to be excluded due to lack of reported data to compute sensitivity and specificity of the tests for diagnosis of SN-PTB. This included 2 large landmark studies on GeneXpert for the same reason [22,23]. The negative or positive influence of these studies on the pooled accuracy of the tests could therefore not be established. Further, although there was substantial heterogeneity across all studies for the three diagnostic methods, we did not perform a meta-regression analysis to investigate the effects of the various charac-teristics associated with the observed heterogeneity. However, our primary aim was not to explore the fac-tors that may be accountable for the differences among studies. Besides, to achieve reliable conclusions from
such an investigation, one would need to pre-specify the protocol of the review since explorations of heterogeneity that are devised after heterogeneity is identified cannot be conclusive. We did not also assess publication bias of the studies which we meta-analyzed. This was because there were few studies on MODS and the WHO algorithm for such analysis [53]. In addition, despite its cited advantages (such as being free and user friendly), the meta-disc soft-ware which we used in our analysis is limited in some stat-istical tests including the Egger’s test and Begg’s tests that are recommended for assessing publication bias.
Conclusions
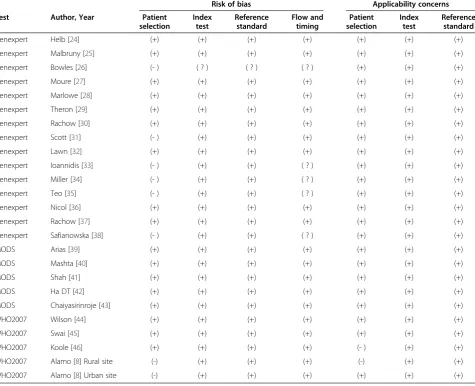
[image:11.595.62.538.103.489.2]The GeneXpert, MODS, and the WHO algorithm have moderate to high accuracy for the diagnosis of SN-PTB. However, the accuracy of the tests is extremely variable. The setting and context under which the tests are con-ducted in addition to several other factors could explain Table 3 QUADAS-2 results of risk of bias and concerns on applicability for each study included in the meta-analysis (n = 24)
Risk of bias Applicability concerns
Test Author, Year Patient
selection
Index test
Reference standard
Flow and timing
Patient selection
Index test
Reference standard
Genexpert Helb [24] (+) (+) (+) (+) (+) (+) (+)
Genexpert Malbruny [25] (+) (+) (+) (+) (+) (+) (+)
Genexpert Bowles [26] (- ) ( ? ) ( ? ) ( ? ) (+) (+) (+)
Genexpert Moure [27] (+) (+) (+) (+) (+) (+) (+)
Genexpert Marlowe [28] (+) (+) (+) (+) (+) (+) (+)
Genexpert Theron [29] (+) (+) (+) (+) (+) (+) (+)
Genexpert Rachow [30] (+) (+) (+) (+) (+) (+) (+)
Genexpert Scott [31] (- ) (+) (+) (+) (+) (+) (+)
Genexpert Lawn [32] (+) (+) (+) (+) (+) (+) (+)
Genexpert Ioannidis [33] (- ) (+) (+) ( ? ) (+) (+) (+)
Genexpert Miller [34] (- ) (+) (+) ( ? ) (+) (+) (+)
Genexpert Teo [35] (- ) (+) (+) ( ? ) (+) (+) (+)
Genexpert Nicol [36] (+) (+) (+) (+) (+) (+) (+)
Genexpert Rachow [37] (+) (+) (+) (+) (+) (+) (+)
Genexpert Safianowska [38] (- ) (+) (+) ( ? ) (+) (+) (+)
MODS Arias [39] (+) (+) (+) (+) (+) (+) (+)
MODS Mashta [40] (+) (+) (+) (+) (+) (+) (+)
MODS Shah [41] (+) (+) (+) (+) (+) (+) (+)
MODS Ha DT [42] (+) (+) (+) (+) (+) (+) (+)
MODS Chaiyasirinroje [43] (+) (+) (+) (+) (+) (+) (+)
WHO2007 Wilson [44] (+) (+) (+) (+) (+) (+) (+)
WHO2007 Swai [45] (+) (+) (+) (+) (+) (+) (+)
WHO2007 Koole [46] (+) (+) (+) (+) (- ) (+) (+)
WHO2007 Alamo [8] Rural site (-) (+) (+) (+) (-) (+) (+)
WHO2007 Alamo [8] Urban site (-) (+) (+) (+) (+) (+) (+)
this variability. There is therefore need to investigate these factors further. The information from these studies would inform the adoption and placement of these new tests.
Competing interests
The authors declare that they have no competing interests.
Authors’contributions
All the authors planned and designed the study. SW and FB: retrieved and reviewed the study reports, summarized and analysed the data, and prepared the manuscript. MH and ADC: retrieved some of the study reports and critically revised the manuscript versions. MJ and SH: Critically revised the manuscript versions. All authors read and approved the final manuscript.
Acknowledgements
We thank the Swedish International Development Agency (Sida), for their support of the bilateral collaborative research between Makerere University and Karolinska Institute. SW also received a scholarship from the World Federation of Scientists (WFS). The funders had no role in study design, data collection and analysis, decision to publish, or preparation of the manuscript.
Author details
1Department of Medical Microbiology, Makerere University, Kampala,
Uganda.2Department of Public Health Sciences, Karolinska Institute, Stockholm, Sweden.3Department of Diagnostics and Vaccinology, Swedish Institute for communicable Disease Control, Solna, Sweden.
Received: 20 March 2013 Accepted: 17 October 2013 Published: 30 October 2013
References
1. World Health Organization:Global Tuberculosis Report.2012. Available from: http://apps.who.int/iris/bitstream/10665/75938/1/9789241564502_eng.pdf. Accessed on August 2013.
2. Steingart KR, Ng V, Henry M, Hopewell PC, Ramsay A, Cunningham J, Urbanczik R, Perkins MD, Aziz MA, Pai M:Sputum processing methods to improve the sensitivity of smear microscopy for tuberculosis: a systematic review.Lancet Infect Dis2006,6(10):664–674.
3. Steingart KR, Henry M, Ng V, Hopewell PC, Ramsay A, Cunningham J, Urbanczik R, Perkins M, Aziz MA, Pai M:Fluorescence versus conventional sputum smear microscopy for tuberculosis: a systematic review. Lancet Infect Dis2006,6(9):570–581.
4. Murray JF:Pulmonary complications of HIV-1 infection among adults living in Sub-Saharan Africa.Int J Tuberc Lung Dis2005,9(8):826–835. 5. Getahun H, Harrington M, O’Brien R, Nunn P:Diagnosis of smear-negative
pulmonary tuberculosis in people with HIV infection or AIDS in resource-constrained settings: informing urgent policy changes. Lancet2007,369(9578):2042–2049.
6. World Health Organization:Improving the diagnosis and treatment of smear-negative pulmonary and extrapulmonary tuberculosis among adults and adolescents. Recommendations for HIV-prevalent and resource-constrained settings.InStop TB.Geneva: Department of HIV/AIDS; 2007. Available from: http://whqlibdoc.who.int/hq/2007/
WHO_HTM_TB_2007.379_eng.pdf. Accessed August 2013.
7. Pai M, Minion J, Steingart K, Ramsay A:New and improved tuberculosis diagnostics: evidence, policy, practice, and impact.Curr Opin Pulm Med
2010,16(3):271–284.
8. Alamo ST, Kunutsor S, Walley J, Thoulass J, Evans M, Muchuro S, Matovu A, Katabira E:Performance of the new WHO diagnostic algorithm for smear-negative pulmonary tuberculosis in HIV prevalent settings: a multisite study in Uganda.Trop Med Int Health2012,17(7):884–895. 9. World Health Organization:Rapid implementation of the Xpert MTB/RIF
diagnostic test: technical and operational“How-to”; practical considerations. 2011. Available from: http://whqlibdoc.who.int/ publications/2011/9789241501569_eng.pdf. Accessed August 2013. 10. Blakemore R, Story E, Helb D, Kop J, Banada P, Owens MR, Chakravorty S,
Jones M, Alland D:Evaluation of the analytical performance of the Xpert MTB/RIF assay.J Clin Microbiol2010,48(7):2495–2501.
11. World Health Organization:Automated real-time nucleic acid amplification technology for rapid and simultaneous detection of tuberculosis and rifampicin resistance: Xpert mtb/rif system. Policy statement 2011.2011. Available from:
http://whqlibdoc.who.int/publications/2011/9789241501545_eng.pdf. Accessed August 2013.
12. World Health Organization:Noncommercial culture and drug-susceptibility testing methods for screening patients at risk for multidrug- resistant tuberculosis. Policy statement 2011.Available from: http://whqlibdoc.who.int/publications/ 2011/9789241501620_eng.pdf. Accessed August 2013.
13. Caviedes L, Lee TS, Gilman RH, Sheen P, Spellman E, Lee EH, Berg DE, Montenegro-James S:Rapid, efficient detection and drug susceptibility testing of Mycobacterium tuberculosis in sputum by microscopic observation of broth cultures. The Tuberculosis Working Group in Peru.J Clin Microbiol2000,
38(3):1203–1208.
14. Moore DA, Evans CA, Gilman RH, Caviedes L, Coronel J, Vivar A, Sanchez E, Pinedo Y, Saravia JC, Salazar C,et al:Microscopic-observation drug-susceptibility assay for the diagnosis of TB.N Engl J Med2006,355(15):1539–1550. 15. Whiting PF, Rutjes AW, Westwood ME, Mallett S, Deeks JJ, Reitsma JB,
Leeflang MM, Sterne JA, Bossuyt PM:QUADAS-2: a revised tool for the quality assessment of diagnostic accuracy studies.Ann Intern Med2011,
155(8):529–536.
16. Zamora J, Abraira V, Muriel A, Khan K, Coomarasamy A:Meta-DiSc: a software for meta-analysis of test accuracy data.BMC Med Res Methodol2006,6:31. 17. Higgins JP, Thompson SG:Quantifying heterogeneity in a meta-analysis.
Stat Med2002,21(11):1539–1558.
18. Identifying and measuring heterogeneity.Available at http://handbook. cochrane.org/chapter_9/9_5_2_identifying_and_measuring_heterogeneity. htm. Accessed August 12.
19. Littenberg B, Moses LE:Estimating diagnostic accuracy from multiple conflicting reports: a new meta-analytic method.Med Decis Making1993,
13(4):313–321.
20. Moses LE, Shapiro D, Littenberg B:Combining independent studies of a diagnostic test into a summary ROC curve: data-analytic approaches and some additional considerations.Stat Med1993,12(14):1293–1316. 21. Colton T:Statistics in Medicine.Little, Brown and Company: Boston; 1974. 22. Boehme CC, Nabeta P, Hillemann D, Nicol MP, Shenai S, Krapp F, Allen J, Tahirli
R, Blakemore R, Rustomjee R,et al:Rapid molecular detection of tuberculosis and rifampin resistance.N Engl J Med2010,363(11):1005–1015.
23. Boehme CC, Nicol MP, Nabeta P, Michael JS, Gotuzzo E, Tahirli R, Gler MT, Blakemore R, Worodria W, Gray C,et al:Feasibility, diagnostic accuracy, and effectiveness of decentralised use of the Xpert MTB/RIF test for diagnosis of tuberculosis and multidrug resistance: a multicentre implementation study.Lancet2011,377(9776):1495–1505.
24. Helb D, Jones M, Story E, Boehme C, Wallace E, Ho K, Kop J, Owens MR, Rodgers R, Banada P,et al:Rapid detection of Mycobacterium tuberculosis and rifampin resistance by use of on-demand, near-patient technology.J Clin Microbiol2010,48(1):229–237.
25. Malbruny B, Le Marrec G, Courageux K, Leclercq R, Cattoir V:Rapid and efficient detection of Mycobacterium tuberculosis in respiratory and non-respiratory samples.Int J Tuberc Lung Dis2011,15(4):553–555. 26. Bowles EC, Freyee B, van Ingen J, Mulder B, Boeree MJ, van Soolingen D:
Xpert MTB/RIF(R), a novel automated polymerase chain reaction-based tool for the diagnosis of tuberculosis.Int J Tuberc Lung Dis2011,
15(7):988–989.
27. Moure R, Munoz L, Torres M, Santin M, Martin R, Alcaide F:Rapid detection of Mycobacterium tuberculosis complex and rifampin resistance in smear-negative clinical samples by use of an integrated real-time PCR method.J Clin Microbiol2011,49(3):1137–1139.
28. Marlowe EM, Novak-Weekley SM, Cumpio J, Sharp SE, Momeny MA, Babst A, Carlson JS, Kawamura M, Pandori M:Evaluation of the Cepheid Xpert MTB/RIF assay for direct detection of Mycobacterium tuberculosis complex in respiratory specimens.J Clin Microbiol2011,49(4):1621–1623. 29. Theron G, Peter J, van Zyl-Smit R, Mishra H, Streicher E, Murray S, Dawson R,
Whitelaw A, Hoelscher M, Sharma S,et al:Evaluation of the Xpert MTB/RIF assay for the diagnosis of pulmonary tuberculosis in a high HIV prevalence setting.Am J Respir Crit Care Med2011,184(1):132–140.
30. Rachow A, Zumla A, Heinrich N, Rojas-Ponce G, Mtafya B, Reither K, Ntinginya EN, O’Grady J, Huggett J, Dheda K,et al:Rapid and accurate detection of Mycobacterium tuberculosis in sputum samples by Cepheid Xpert MTB/RIF assay–a clinical validation study.PLoS One2011,6(6):e20458.
32. Lawn SD, Brooks SV, Kranzer K, Nicol MP, Whitelaw A, Vogt M, Bekker LG, Wood R:Screening for HIV-associated tuberculosis and rifampicin resistance before antiretroviral therapy using the Xpert MTB/RIF assay: a prospective study.PLoS Med2011,8(7):e1001067.
33. Ioannidis P, Papaventsis D, Karabela S, Nikolaou S, Panagi M, Raftopoulou E, Konstantinidou E, Marinou I, Kanavaki S:Cepheid GeneXpert MTB/RIF assay for Mycobacterium tuberculosis detection and rifampin resistance identification in patients with substantial clinical indications of tuberculosis and smear-negative microscopy results.J Clin Microbiol2011,
49(8):3068–3070.
34. Miller MB, Popowitch EB, Backlund MG, Ager EP:Performance of Xpert MTB/RIF RUO assay and IS6110 real-time PCR for Mycobacterium tuberculosis detection in clinical samples.J Clin Microbiol2011,49(10):3458–3462. 35. Teo J, Jureen R, Chiang D, Chan D, Lin R:Comparison of two nucleic acid
amplification assays, the Xpert MTB/RIF assay and the amplified Mycobacterium Tuberculosis Direct assay, for detection of Mycobacterium tuberculosis in respiratory and nonrespiratory specimens.J Clin Microbiol2011,49(10):3659–3662.
36. Nicol MP, Workman L, Isaacs W, Munro J, Black F, Eley B, Boehme CC, Zemanay W, Zar HJ:Accuracy of the Xpert MTB/RIF test for the diagnosis of pulmonary tuberculosis in children admitted to hospital in Cape Town, South Africa: a descriptive study.Lancet Infect Dis2011,11(11):819–824. 37. Rachow A, Clowes P, Saathoff E, Mtafya B, Michael E, Ntinginya EN, Kowour
D, Rojas-Ponce G, Kroidl A, Maboko L,et al:Increased and expedited case detection by Xpert MTB/RIF assay in childhood tuberculosis: a prospective cohort study.Clin Infect Dis2012,54(10):1388–1396.
38. Safianowska A, Walkiewicz R, Nejman-Gryz P, Grubek-Jaworska H:Two selected commercially based nucleic acid amplification tests for the diagnosis of tuberculosis.Pneumonol Alergol Pol2012,80(1):6–12.
39. Arias M, Mello FC, Pavon A, Marsico AG, Alvarado-Galvez C, Rosales S, Pessoa CL, Perez M, Andrade MK, Kritski AL,et al:Clinical evaluation of the microscopic-observation drug-susceptibility assay for detection of tuberculosis.Clin Infect Dis2007,44(5):674–680.
40. Mashta A, Mishra P, Philipose S, Tamilzhalagan S, Mahmud H, Bhaskar S, Upadhyay P:Diagnosis of tuberculosis: the experience at a specialized diagnostic laboratory.J Negat Results Biomed2011,10:16.
41. Shah NS, Moodley P, Babaria P, Moodley S, Ramtahal M, Richardson J, Heysell S, Li X, Moll A, Friedland G,et al:Rapid diagnosis of tuberculosis and multidrug resistance by the microscopic-observation drug-susceptibility assay.Am J Respir Crit Care Med2011,183(10):1427–1433.
42. Ha DT, Lan NT, Kiet VS, Wolbers M, Hang HT, Day J, Hien NQ, Tien NA, An PT, Anh TT,et al:Diagnosis of pulmonary tuberculosis in HIV-positive patients by microscopic observation drug susceptibility assay.J Clin Microbiol2010,
48(12):4573–4579.
43. Chaiyasirinroje B, Aung MN, Moolphate S, Kasetjaroen Y, Rienthong S, Rienthong D, Nampaisan O, Nedsuwan S, Sangchun W, Suriyon N,et al:
Prospective evaluation of simply modified MODS assay: an effective tool for TB diagnosis and detection of MDR-TB.Infect Drug Resist2012,5:79–86. 44. Wilson D, Mbhele L, Badri M, Morroni C, Nachega J, Chaisson RE, Maartens
G:Evaluation of the World Health Organization algorithm for the diagnosis of HIV-associated sputum smear-negative tuberculosis. Int J Tuberc Lung Dis2011,15(7):919–924.
45. Swai HF, Mugusi FM, Mbwambo JK:Sputum smear negative pulmonary tuberculosis: sensitivity and specificity of diagnostic algorithm.BMC Res Notes2011,4:475.
46. Koole O, Thai S, Khun KE, Pe R, van Griensven J, Apers L, Van den Ende J, Mao TE, Lynen L:Evaluation of the 2007 WHO guideline to improve the diagnosis of tuberculosis in ambulatory HIV-positive adults.PLoS One
2011,6(4):e18502.
47. Rosman AS, Korsten MA:Application of summary receiver operating characteristics (sroc) analysis to diagnostic clinical testing.Adv Med Sci
2007,52:76–82.
48. WHO:Fluorescent light-emitting diode (LED) microscopy for diagnosis of tuberculosis, Policy statement. 2011. Available at http://www.ecdc.europa. eu/en/publications/Publications/1105_TER_Basics_TB_control.pdf. Accessed August 12. 2013.
49. Steingart KR, Sohn H, Schiller I, Kloda LA, Boehme CC, Pai M, Dendukuri N:
Xpert® MTB/RIF assay for pulmonary tuberculosis and rifampicin resistance in adults.Cochrane Database Syst Rev2013(1):CD009593. DOI:10.1002/ 14651858.CD009593.pub2. Available from: http://onlinelibrary.wiley.com/doi/ 10.1002/14651858.CD009593.pub2/pdf. Accessed August 2013.
50. Chang K, Lu W, Wang J, Zhang K, Jia S, Li F, Deng S, Chen M:Rapid and effective diagnosis of tuberculosis and rifampicin resistance with Xpert MTB/RIF assay: a meta-analysis.J Infect2012,64(6):580–588.
51. Macaskill P, Gatsonis C, Deeks JJ, Harbord RM, Takwoingi Y:Chapter 10: Analysing and Presenting Results.InCochrane Handbook for Systematic Reviews of Diagnostic Test Accuracy Version 1.0, The Cochrane Collaboration. Edited by Deeks JJ, Bossuyt PM, Gatsonis C. 2010. Available from: http://srdta. cochrane.org/. Accessed August 12–2013.
52. Bwanga F, Hoffner S, Haile M, Joloba ML:Direct susceptibility testing for multi drug resistant tuberculosis: a meta-analysis.BMC Infect Dis2009,9:67. 53. Recommendations on testing for funnel plot asymmetry.Available at http://
handbook.cochrane.org/chapter_10/10_4_3_1_recommendations_on_ testing_for_funnel_plot_asymmetry.htm. Accessed August 12. 2013.
doi:10.1186/1471-2334-13-507
Cite this article as:Walusimbiet al.:Meta-analysis to compare the accuracy of GeneXpert, MODS and the WHO 2007 algorithm for diagnosis of smear-negative pulmonary tuberculosis.BMC Infectious Dis-eases201313:507.
Submit your next manuscript to BioMed Central and take full advantage of:
• Convenient online submission
• Thorough peer review
• No space constraints or color figure charges
• Immediate publication on acceptance
• Inclusion in PubMed, CAS, Scopus and Google Scholar
• Research which is freely available for redistribution