R E S E A R C H
Open Access
Assessment of dead-space ventilation in
patients with acute respiratory distress
syndrome: a prospective observational
study
Jonne Doorduin
1, Joeke L. Nollet
1, Manon P. A. J. Vugts
1, Lisanne H. Roesthuis
1, Ferdi Akankan
2,
Johannes G. van der Hoeven
1, Hieronymus W. H. van Hees
2and Leo M. A. Heunks
1*Abstract
Background:Physiological dead space (VD/VT) represents the fraction of ventilation not participating in gas
exchange. In patients with acute respiratory distress syndrome (ARDS), VD/VThas prognostic value and can be used
to guide ventilator settings. However, VD/VTis rarely calculated in clinical practice, because its measurement is
perceived as challenging. Recently, a novel technique to calculate partial pressure of carbon dioxide in alveolar air (PACO2) using volumetric capnography (VCap) was validated. The purpose of the present study was to evaluate
how VCap and other available techniques to measure PACO2and partial pressure of carbon dioxide in mixed
expired air (PeCO2) affect calculated VD/VT.
Methods:In a prospective, observational study, 15 post-cardiac surgery patients and 15 patients with ARDS were included. PACO2was measured using VCap to calculate Bohr dead space or substituted with partial pressure of
carbon dioxide in arterial blood (PaCO2) to calculate the Enghoff modification. PeCO2was measured in expired air
using three techniques: Douglas bag (DBag), indirect calorimetry (InCal), and VCap. Subsequently, VD/VTwas
calculated using four methods: Enghoff-DBag, Enghoff-InCal, Enghoff-VCap, and Bohr-VCap.
Results:PaCO2was higher than PACO2, particularly in patients with ARDS (post-cardiac surgery PACO2= 4.3 ± 0.6 kPa
vs. PaCO2= 5.2 ± 0.5 kPa,P< 0.05; ARDS PACO2= 3.9 ± 0.8 kPa vs. PaCO2= 6.9 ± 1.7 kPa,P< 0.05). There was good
agreement in PeCO2calculated with DBag vs. VCap (post-cardiac surgery bias = 0.04 ± 0.19 kPa; ARDS bias = 0.03 ± 0.27
kPa) and relatively low agreement with DBag vs. InCal (post-cardiac surgery bias =−1.17 ± 0.50 kPa; ARDS mean bias =−0.15 ± 0.53 kPa). These differences strongly affected calculated VD/VT. For example, in patients with ARDS,
VD/VTcalculated with Enghoff-InCal was much higher than Bohr-VCap (VD/VTEnghoff-InCal= 66 ± 10 % vs. VD/VTBohr-VCap= 45 ±
7 %;P< 0.05).
Conclusions:Different techniques to measure PACO2 and PeCO2 result in clinically relevant mean and
individual differences in calculated VD/VT, particularly in patients with ARDS. Volumetric capnography is a
promising technique to calculate true Bohr dead space. Our results demonstrate the challenges clinicians face in interpreting an apparently simple measurement such as VD/VT.
Keywords: Acute respiratory distress syndrome, Dead space, Douglas bag, Indirect calorimetry, Volumetric capnography
* Correspondence:leo.heunks@radboudumc.nl
1Department of Critical Care Medicine, Radboud University Medical Center, Geert Grooteplein Zuid 10, 6525, GA, Nijmegen, The Netherlands Full list of author information is available at the end of the article
Background
Physiological dead space (VD,phys) represents the fraction of ventilation not participating in gas exchange, includ-ing the airway (or anatomical) dead space (VD,aw; i.e., ventilation of the conducting airways) and alveolar dead space (VD,alv; i.e., ventilation receiving no pulmonary artery perfusion). In patients with acute respiratory dis-tress syndrome (ARDS), dead space has prognostic value [1–4] and can be used to guide ventilator settings [5–8]. However, dead space is rarely calculated in clinical prac-tice, because assessment of dead space is perceived as challenging and misunderstanding exists on different methods of calculation.
The first method used to calculate dead-space fraction (VD/VT) was introduced in 1891 by Christian Bohr [9]:
VD
VT¼
PACO2‐PeCO2
PACO2 ð
1Þ
where VD is dead-space volume (i.e., volume not par-ticipating in gas exchange), VT is total exhaled volume, PACO2is the partial pressure of carbon dioxide in alveo-lar air, and PeCO2is the partial pressure of carbon diox-ide in mixed expired air. VD calculated using Bohr’s equation accurately measures VD,phys[10]. However, dif-ficulties with measurement of PACO2led to rejection of this method. In 1938, Enghoff proposed replacement of PACO2 by partial pressure of carbon dioxide in arterial blood (PaCO2), also known as the Enghoff modification [11]. This modification is in general use today, but it comes with limitations. By substituting PaCO2 for PACO2, intrapulmonary shunt and diffusion limitations are taken into the equation, resulting in a falsely elevated dead-space fraction [10, 12]. Therefore, the Enghoff modification of Bohr’s equation is not a measure of dead space as such but a global index of gas exchange impair-ment. Nevertheless, in clinical practice, the Enghoff modification is often falsely referred to as VD,phys. Another modification of the traditional Bohr formula uses the end-tidal partial pressure of carbon dioxide (PETCO2) instead of PACO2[13]. In healthy subjects at rest, PETCO2 almost equals PaCO2 (and PACO2), but during heavy exercise PETCO2overestimates PaCO2and in lung disease PETCO2underestimates PaCO2[14–16]. Recently, a novel technique for determining PACO2 based on volumetric capnography was developed and validated [17, 18]. With this technique, the eliminated concentration of CO2is plotted against the expired tidal volume, which allows breath-to-breath calculation of PACO2and Bohr dead space. However, in humans, volu-metric capnography-based PACO2has been applied only to healthy and anesthetized subjects [19].
In addition to the difficulties with measurement of PACO2in Bohr’s formula, there are different techniques
for measuring its second component, PeCO2. First, with a Douglas bag, expired air can be collected and analyzed for the fraction of CO2. However, this method is labor-intensive, and, in mechanically ventilated patients, gas compression and ventilator bias flow dilute expired air and should be corrected for [20]. Second, indirect calor-imetry measures CO2 production ð:VCO2Þ, which can be used to calculate PeCO2. Third, the most commonly used and easiest method to determine PeCO2 is volu-metric capnography.
The purpose of the present study was to evaluate how different techniques of measuring PACO2 and PeCO2 affect calculated dead-space ventilation in mechanically ventilated patients with ARDS and normal lung function. PACO2was calculated using volumetric capnography or replaced with PaCO2. PeCO2 was calculated using the Douglas bag, indirect calorimetry, and volumetric capnography.
Methods
Study subjects
We conducted a prospective, observational study in the intensive care unit of the Radboud University Medical Center in Nijmegen, The Netherlands. The protocol was approved by the institutional review board (CMO regio Arnhem-Nijmegen) and was in accordance with the eth-ical standards laid down in the 1964 Declaration of Helsinki and its later amendments. The institutional re-view board waived the need for informed consent.
Study design
Two patient groups were studied: 15 patients who underwent elective post-cardiac surgery and 15 patients fulfilling the Berlin Definition of ARDS [21]. Exclusion criteria were hemodynamic instability (mean arterial pressure <65 mmHg despite vasopressors) in both groups and past medical history of lung disease in the post-cardiac surgery patients. All patients were venti-lated with a SERVO-i ventilator (Maquet Critical Care, Sölna, Sweden) and disposable tubing (patients with ARDS, Evaqua breathing circuit, Fisher & Paykel Health-care, Auckland, New Zealand; post-cardiac surgery pa-tients, Limb-O breathing circuit, GE Healthcare, Little Chalfont, UK). Mechanical ventilator settings were not adjusted during the study. Fraction of inspired oxygen (FiO2) and positive end-expiratory pressure (PEEP) were set according to the lower PEEP/higher FiO2arm of the ARDSNet protocol.
Calculating dead-space ventilation
performed within the same 5 minutes to ensure that methods could be accurately compared.
Enghoff-DBag
Dead space with Enghoff-DBag was calculated using the Enghoff modification:
VD
VT¼
PaCO2‐PeCO2
PaCO2 ð
2Þ
PaCO2 was determined using an arterial blood gas sample derived from an arterial catheter. Expired air was collected during 2 to 3 minutes to obtain a representa-tive sample from the expiratory port of the ventilator in a 25-L Douglas bag. PeCO2 was determined using a sample taken from the bag with a 50-ml syringe (BD Plastipak; BD, Drogheda, Ireland), which was analyzed using the Siemens Rapidlab 865 (Diamond Diagnostics, Holliston, MA, USA). The coefficient of repeatability of the Rapidlab was 0.03 kPa.
PeCO2 in the expired air was corrected for dilution due to gas compression in the ventilator circuit [20], as well as for ventilator bias flow (2 L/min):
compression volume ¼ circuit compliance
Ppeak−PEEP
ð3Þ
bias flow volume ¼ expiratory time bias flow ð4Þ
corrected PeCO2 ¼ PeCO2
VT
VT‐ðcompression volume þ bias flow volumeÞ
ð5Þ
where Ppeakis inspiratory peak pressure. The compliance
of the ventilator circuit was determined during an in-ternal ventilator test in each patient.
Enghoff-InCal
Dead space with Enghoff-InCal was calculated using the Enghoff modification (Eq. 2). PeCO2 was derived from indirect calorimetry. Indirect calorimetry was performed with a metabolic analyzer (CARESCAPE Monitor B650; GE Healthcare, Helsinki, Finland) to measure :VCO2. Gas sampling was performed via side-stream sampling with a connection piece (dead space 9.5 ml) distal to the Y-piece. PeCO2was calculated as follows:
PeCO2 ¼ k
: VCO: 2
V ð
6Þ
where k is the gas constant (0.115 when expressing PeCO2in kilopascals),:VCO2is CO2production (in
mil-liliters per minute standard temperature dry pressure]
and :V: is minute ventilation (in liters per minute body temperature standard pressure). :VCO2 and :V: were
stored per minute on the monitor. An average of at least 5 minutes was used for calculations.
Bohr-VCap
For Bohr-VCap, dead space was calculated using the Bohr equation (Eq. 1). Flow and arterial carbon diox-ide tension (PCO2) were measured using the NICO capnograph (Philips Respironics, Murrysville, PA, USA). The capnograph consists of a mainstream CO2 sensor (CAPNOSTAT; Philips Respironics) using infrared ab-sorption technology and a flow sensor connected to the CAPNOSTAT attached distal to the Y-piece (dead space 8.5 ml). Flow and PCO2were acquired at a sampling rate of 200 Hz and stored for offline analysis.
Offline analysis was performed with an algorithm de-veloped for MATLAB (MathWorks, Natick, MA, USA). The volumetric capnogram was obtained per breath by plotting PCO2 against expired volume. The volumetric capnogram was averaged over a period of 2 minutes, se-lected by visual inspection to ensure no artifacts. The latter was necessary to correct for respiratory variability (particularly with pressure support ventilation) and thus obtain a representative breath (Additional file 1: Fig. S1). PACO2, PeCO2, and VD,aw were determined from the volumetric capnogram using model fitting (Additional file 1: Fig. S2) as described by Tusman and colleagues [17]. Briefly, mean PACO2 was calculated as the mid-point of phase III in the volumetric capnogram, and PeCO2was calculated as the area under the curve of the volumetric capnogram divided by expiratory volume. The position of the airway-alveolar interface (VD,aw) was calculated as the inflection point of phase II of the volumetric capnogram. Consequently, VD,alv could be calculated as follows:
VD;alv ¼ VD;phys−VD;aw ð7Þ
Enghoff-VCap
For Enghoff-VCap, dead space was calculated using the Enghoff modification (Eq. 2). PeCO2 was determined from the volumetric capnogram as described in the pre-ceding subsection.
Statistical analysis
were used for comparisons.P< 0.05 was considered sta-tistically significant.
Results
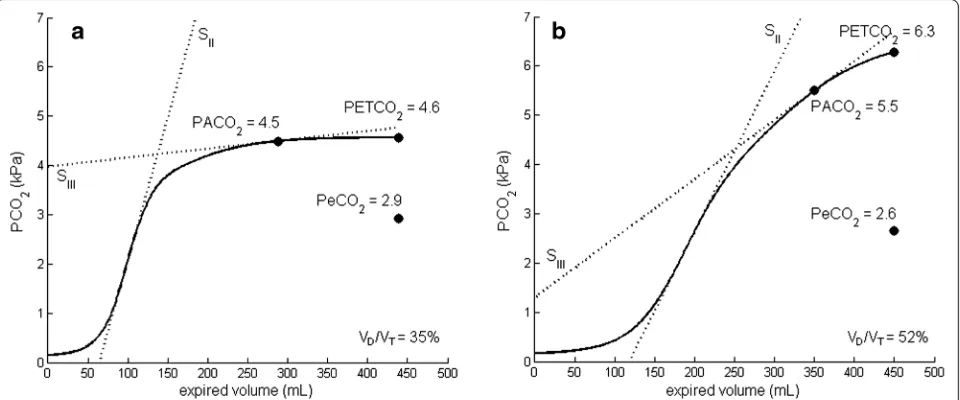
Table 1 reports patient characteristics and ventilator set-tings. Figure 1 shows representative examples of the volumetric capnogram of post-cardiac surgery patients and patients with ARDS. Average values of PACO2, PaCO2, PeCO2, and VD/VT for both groups, measured and calculated with the different methods, are given in Table 2.
PACO2, PETCO2, and PaCO2
For both patient groups, there was a significant differ-ence between PACO2, PETCO2, and PaCO2, confirming that these parameters are not interchangeable (Fig. 2). As expected, these differences were much more pro-nounced in patients with ARDS (Table 2 and Fig. 2). In post-cardiac surgery patients, PETCO2and PaCO2were, respectively, 7 ± 5 % and 23 ± 11 % higher than PACO2 vs. 16 ± 7 % and 81 ± 43 % in patients with ARDS.
PeCO2
PeCO2measured with InCal was higher than with DBag and VCap in post-cardiac surgery patients (Table 2). Figure 3 shows Bland-Altman plots of PeCO2measured
with DBag vs. InCal and VCap. In post-cardiac surgery patients, the agreement in PeCO2 between DBag and VCap was high (mean bias 0.04 ± 0.19 kPa), while the agreement between DBag and InCal was low (mean bias −1.17 ± 0.50 kPa). In patients with ARDS, the agreement in PeCO2 between DBag and VCap (mean bias 0.03 ± 0.27 kPa) was comparable to that of post-cardiac surgery patients, but between DBag and InCal (mean bias −0.15 ± 0.53 kPa) it was better than with post-cardiac surgery patients.
DBag vs. VCap had high agreement only if PeCO2-obtained with DBag was corrected for dilution due to ventilator bias flow and compressible volume (Additional file 1: Fig. S3). PeCO2 after correction for bias flow and compressible volume was 0.65 ± 0.11 kPa and 0.39 ± 0.16 kPa higher than when uncorrected for post-cardiac surgery and patients with ARDS, respectively (Additional file 1: Fig. S4).
Dead space
Large differences in calculated dead space were present between the four different methods (Table 2). Compared with Bohr-VCap, dead space calculated with Enghoff-VCap (PACO2replaced with PaCO2, but similar PeCO2) increased dead space by 31 ± 18 % and 52 ± 15 % for the post-cardiac surgery patients and patients with ARDS, respectively. Figure 4 shows Bland-Altman plots of dead space obtained with different methods. In post-cardiac surgery patients, the mean bias in VD/VT between Enghoff-DBag vs. Bohr-VCap was 10 ± 6 %, and between Enghoff-DBag vs. Enghoff-InCal it was 22 ± 10 %. In pa-tients with ARDS, the mean bias in VD/VT between Enghoff-DBag vs. Bohr-VCap was 23 ± 7 %, and between Enghoff-DBag vs. Enghoff-InCal it was 2 ± 8 %.
Changes in intrapulmonary shunt and diffusion have a greater effect on Enghoff-VCap than Bohr-VCap. Partial pressure of oxygen in arterial blood (PaO2)/FiO2 ratio (PF ratio) may be used as an indicator of these lung pa-rameters. Figure 5 shows the correlation between dead space (Bohr-VCap and Enghoff-VCap) and PF ratio.
Values of VD,aw and VD,alv calculated from the volu-metric capnogram are presented and discussed in Add-itional file 1: Fig. S5.
Discussion
[image:4.595.57.292.424.681.2]The present study demonstrates the consequences of ap-plying different techniques for measuring PACO2 and PeCO2 to calculate dead space in mechanically venti-lated patients with ARDS and normal lung function. To our knowledge, we are the first to evaluate a novel method to calculate PACO2using volumetric capnogra-phy in patients with ARDS. We show that the differ-ences introduced by replacing PACO2 with PaCO2 are more pronounced in patients with ARDS than in
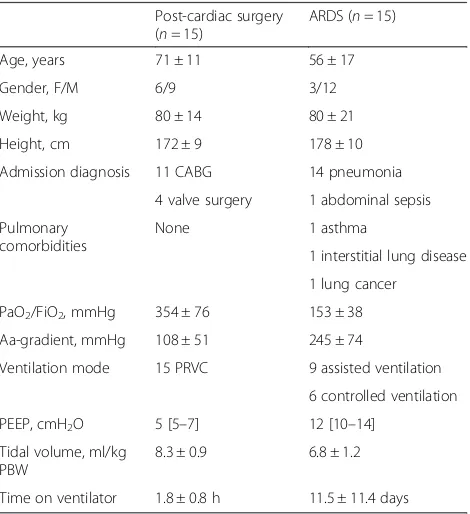
Table 1Patient characteristics and ventilator settings
Post-cardiac surgery (n= 15)
ARDS (n= 15)
Age, years 71 ± 11 56 ± 17
Gender, F/M 6/9 3/12
Weight, kg 80 ± 14 80 ± 21
Height, cm 172 ± 9 178 ± 10
Admission diagnosis 11 CABG 14 pneumonia
4 valve surgery 1 abdominal sepsis
Pulmonary comorbidities
None 1 asthma
1 interstitial lung disease
1 lung cancer
PaO2/FiO2, mmHg 354 ± 76 153 ± 38
Aa-gradient, mmHg 108 ± 51 245 ± 74
Ventilation mode 15 PRVC 9 assisted ventilation
6 controlled ventilation
PEEP, cmH2O 5 [5–7] 12 [10–14]
Tidal volume, ml/kg PBW
8.3 ± 0.9 6.8 ± 1.2
Time on ventilator 1.8 ± 0.8 h 11.5 ± 11.4 days
Aa-gradientalveolar-arterial oxygen concentration gradient,ARDSacute respiratory distress syndrome,CABGcoronary artery bypass graft,FiO2fraction of
inspired oxygen,PaO2partial pressure of oxygen in arterial blood,PBW
predicted body weight,PEEPpositive end expiratory pressure,PRVC
pressure-regulated volume control
mechanically ventilated patients with normal lung func-tion. Furthermore, the different techniques used to measure PeCO2 introduce potential and clinically rele-vant sources of error in calculating dead space. These findings have important implications for calculating dead space in daily clinical practice.
Alveolar and arterial PCO2
PACO2is the mean value of CO2in the alveolar compart-ment, which depends on the balance between perfusion and ventilation of the lung units [10]. The replacement of PACO2with PaCO2in the Bohr formula (Enghoff modifi-cation) was proposed to avoid the difficulties of identifying an appropriate PACO2. However, in contrast to PACO2, PaCO2is affected by intrapulmonary shunt and diffusion impairment [22, 23]. In a healthy lung, the difference be-tween PACO2and PaCO2is minimal but will increase for any gas exchange abnormality. Indeed, we found that the
gradient between PACO2 and PaCO2 is much higher in patients with ARDS than in patients without lung disease (Fig. 2). The former has a strong effect on the calculated dead space in patients with ARDS (52 % increase). Hence, the Enghoff modification of Bohr dead space is not a dead-space measurement as such, but a global index of gas exchange impairment. This is illustrated in Fig. 5, where dead space calculated with Enghoff-VCap shows a strong correlation (r2= 0.54) with PF ratio, whereas this correlation is weak (r2= 0.12) with Bohr-VCap. In other words, the use of true alveolar PCO2makes dead-space calculation less dependent on intrapulmonary shunt and diffusion impairment. Even with Bohr-VCap, we found that dead space in patients with ARDS was higher than in post-cardiac surgery patients. This may be explained by the difference in lung condition but also by the difference in tidal volume between the groups. A lower tidal volume relatively increases dead space.
[image:5.595.59.539.89.289.2]Fig. 1Representative examples of a volumetric capnogram for both patient groups. Volumetric capnogram of a post-cardiac surgery patient (a) and a patient with acute respiratory distress syndrome (b) with values of PACO2, PETCO2, PeCO2, and dead-space fraction (VD/VT). SIIand SIIIare the slopes of phases II and III, respectively, of the volumetric capnogram (see Additional file 1: Fig. S2).PaCO2partial pressure of carbon dioxide in arterial blood,PACO2partial pressure of carbon dioxide in alveolar air,PeCO2partial pressure of carbon dioxide in mixed expired air,PETCO2 end-tidal partial pressure of carbon dioxide
Table 2Dead space and its parameters in post-cardiac surgery patients and patients with acute respiratory distress syndrome calcu-lated with different methods
Post-cardiac surgery (n= 15) ARDS (n= 15)
Enghoff-DBag Enghoff-InCal Bohr-VCap Enghoff-VCap Enghoff-DBag Enghoff-InCal Bohr-VCap Enghoff-VCap
PACO2, kPa – – 4.3 ± 0.6 – – – 3.9 ± 0.8
PaCO2, kPa 5.2 ± 0.5 5.2 ± 0.5 – 5.2 ± 0.5 6.9 ± 1.7 6.9 ± 1.7 – 6.9 ± 1.7
PeCO2, kPa 2.7 ± 0.2 3.8 ± 0.5a 2.6 ± 0.4 2.6 ± 0.4 2.2 ± 0.4 2.3 ± 0.7 2.1 ± 0.5 2.1 ± 0.5
VD/VT, % 49 ± 4 26 ± 9b 38 ± 5c 50 ± 4 67 ± 9 66 ± 10 45 ± 7d 68 ± 9
PACO2mean alveolar carbon dioxide tension,PaCO2arterial carbon dioxide tension,PeCO2mixed expired carbon dioxide tension,VD/VTdead-space fraction,DBag
Douglas bag,InCalindirect calorimetry,VCapvolumetric capnography Within-group testing:P< 0.05 fora
Enghoff-InCal vs. Enghoff-DBag, Bohr-VCap, Enghoff-VCap;b
Bohr-VCap vs. Enghoff-DBag, Enghoff-InCal, Enghoff-VCap;c
[image:5.595.56.538.615.698.2]Fig. 2Values of PACO2, PETCO2, and PaCO2for both patient groups. Individual alveolar, end-tidal, and arterial carbon dioxide tensions in post-cardiac surgery patients (a) and patients with acute respiratory distress syndrome (ARDS) (b). Alveolar and end-tidal PCO2were obtained with volumetric capnography. Thedashed linesrepresent mean values of the parameters with the corresponding colors. *P< 0.05.PCO2arterial carbon dioxide tension,PaCO2partial pressure of carbon dioxide in arterial blood,PACO2partial pressure of carbon dioxide in alveolar air,PETCO2 end-tidal partial pressure of carbon dioxide
[image:6.595.60.539.88.310.2] [image:6.595.58.541.378.686.2]Techniques to measure mixed expired PCO2
In the present study, we used three techniques (DBag, VCap, and InCal) to measure PeCO2. In the last decade, researchers in several clinical studies compared these techniques as well [24–26]. None of the studies included comparisons of all three techniques, but a high agree-ment in PeCO2was found previously between VCap and DBag [25] and between VCap and InCal [24, 26]. In ac-cordance with these results, we found a high agreement between DBag and VCap in patients with ARDS and in post-cardiac surgery patients (Fig. 3). However, the accuracy of indirect calorimetry to measure PeCO2 ap-peared lower. First, the 95 % limits of agreement were larger with DBag vs. InCal compared with DBag vs. VCap in both patient groups. Second, the mean bias be-tween DBag and InCal showed large offset in post-cardiac surgery patients.
It is important to note that, with the Douglas bag, ex-pired air is collected at the expiratory limb of the venti-lator circuit and is consequently diluted by CO2-free air coming from compressed volume and bias flow volume. In the present study, dilution of expired air lowered PeCO2. The effect of dilution becomes larger as the ratio between bias flow volume and expired volume increases. This ratio is higher in post-cardiac surgery patients, who have, in general, a relatively long expiration time com-pared with patients with ARDS. The reliability of using a
correction factor to estimate the degree of dilution de-pends primarily upon the accuracy of the recorded peak pressure and expired tidal volume for compressed vol-ume [24] and the expiratory time for bias flow volvol-ume. Volumetric capnography measures expired CO2distal to the Y-piece of the ventilator circuit and is unaffected by compression volume and bias flow.
Clinical implications
The techniques used in the present study cause large dif-ferences in calculated dead space (Table 2 and Fig. 4) and demonstrate the difficulties encountered in clinical practice. These differences are dependent on the choice of dead-space formula (Bohr or Enghoff modification) and the technique used to measure PeCO2, as discussed above, and they have important clinical implications. First, one should never use different techniques to calcu-late dead space in follow-up of a patient. Second, several studies have demonstrated that elevated dead space in patients with ARDS is associated with an increased risk of mortality [1–4]. The researchers in these studies cal-culated the Enghoff modification of Bohr dead space and thus calculated an index of global gas exchange impair-ment and not true dead space. Therefore, it is unknown whether true Bohr dead space measured with VCap has similar prognostic value. Third, a question remains re-garding which method clinicians should use at the Fig. 4Agreement between different techniques to calculate the dead-space fraction. Bland-Altman plots comparing dead space fraction (VD/VT) calculated by measurements from Enghoff-Douglas bag (Enghoff-DBag) vs. Bohr volumetric capnography (Bohr-VCap) and Enghoff-indirect calorimetry (Enghoff-InCal) in post-cardiac surgery patients (aandb) and patients with acute respiratory distress syndrome (ARDS) (candd).
[image:7.595.60.536.88.346.2]bedside to determine dead space. The answer depends on the clinical problem to be addressed and the tech-niques available. Nowadays, there are several capno-graphs available that provide dead-space values at the bedside. These include stand-alone monitors (e.g., NICO capnograph) or modules incorporated into the mechan-ical ventilator (e.g., Evita Infinity V500, Dräger Medmechan-ical, Lübeck, Germany; HAMILTON-G5, Hamilton Medical, Bonaduz, Switzerland). However, these capnographs are not able to calculate alveolar PCO2(and thus Bohr dead space), as demonstrated in our study, and still require manual entry of PaCO2to determine dead space accord-ing Enghoff’s modification. If one’s goal is to improve or follow up overall gas exchange, it complies is appropriate to take an arterial blood gas samples and use the Enghoff modification. However, if one wants to evaluate the effect of different ventilator settings on alveolar dead space, one must calculate Bohr dead space (i.e., physio-logical dead space). For example, differences in end-expiratory lung volume and extrinsic PEEP levels greatly affect airway and alveolar dead space [27–29]. In case of high PEEP, vessels can be compressed by overdistention of alveoli, which causes alveolar perfusion to decrease and consequently increases alveolar dead space.
However, high PEEP may also overcome atelectasis and thereby increase alveolar recruitment and reduce pul-monary shunting. If dead space is measured using the Enghoff modification, it is not possible to discriminate between the effects of PEEP on pulmonary shunt and al-veolar dead space.
Study limitations
The gold standard for calculating Bohr dead space is the mathematical algorithm of the multiple inert gas elimin-ation technique (MIGET), an approach that allows quantification of all the pulmonary and extrapulmonary determinants of arterial oxygenation. Due to the com-plexity of the MIGET technique, it is never used in clin-ical practice and rarely in clinclin-ical studies. Nevertheless, it is reasonable to assume that Bohr dead space calcu-lated using volumetric capnography in our study provided an accurate estimate. First, the concept of obtaining PACO2from the midportion of phase III with volumetric capnography has recently been validated against the MIGET technique in lung-lavaged pigs [18]. Second, our values of dead space were comparable with the only clinical study in patients with ARDS in the current era of low tidal volumes in which researchers calculated dead space using both the MIGET tech-nique and the Enghoff modification [30]. In that study, VD/VT,Bohr was 40 % and VD/VT,Enghoff was 65 %, compared with 45 % and 68 %, respectively, in our present study.
Previously, using the similar volumetric capnography technique as used in the present study, VD/VT,Bohr was found to be 23 % in healthy subjects and 28 % in anes-thetized patients undergoing elective, noncomplex, and neither laparoscopic nor thoracic surgeries in supine position [19]. In our post-cardiac surgery patients, VD/ VT,Bohr was markedly higher at 38 %. This difference is most likely the result of a longer surgical procedure, open chest surgery, hypovolemia, and higher PEEP in our post-cardiac surgery patients.
With volumetric capnography, the calculation of PACO2 depends on the determination of the intersections of the tangents of phases II and III (Additional file 1: Fig. S2) [17]. In post-cardiac surgery patients and in most patients with ARDS, this intersection is present. However, in some patients with ARDS, phase III can be very steep due to se-vere heterogeneity of the lung. Consequently, there is no definite transition from phase II to phase III and hence no intersection of the tangent of phases II and III, which leads to false calculation of PACO2. The latter occurred in one of our patients, who was excluded from analysis.
Conclusions
Use of different techniques to measure PACO2 and PeCO2results in clinically relevant mean and individual Fig. 5Correlation between dead space and PaO2/FiO2ratio. Dead
space was calculated using volumetric capnography with PaCO2 (Enghoff-VCap) and PACO2(Bohr-VCap). Dead space calculated with Enghoff-VCap shows a strong correlation (r2= 0.54) with PaO
2/FiO2 ratio (PF ratio), whereas this correlation is weak (r2= 0.12) with Bohr-VCap. Thus, the use of PACO2makes dead-space calculation less dependent on intrapulmonary shunts and diffusion impairment.
[image:8.595.57.292.87.316.2]differences in calculated VD/VT, particularly in patients with ARDS. Volumetric capnography is a novel and promising technique for calculating true Bohr dead space. Our results demonstrate the complexity of gas exchange in patients with ARDS and the challenges cli-nicians face in interpreting an apparently simple meas-urement such as dead space. Awareness of the chosen technique, as well as interpretation and consistent use, is highly important when calculating dead-space ventila-tion as a prognostic marker or guidance for treatment.
Key messages
Different available techniques to measure partial pressure of CO2in alveolar and mixed expired air result in clinically relevant differences in calculated VD/VT, particularly in patients with ARDS. Volumetric capnography is a novel and promising
technique for calculating true Bohr dead space. Awareness of the chosen technique, as well as
interpretation and consistent use, are highly important when calculating dead-space ventilation as a prognostic marker or guidance for ventilator settings.
Additional file
Additional file 1:Figures depicting volumetric capnography, corrections for dead space analysis with the Douglas bag, and the different components of dead space. (DOCX 1371 kb)
Abbreviations
Aa-gradient:alveolar-arterial oxygen concentration gradient; ARDS: acute respiratory distress syndrome; CABG: coronary artery bypass graft; DBag: Douglas bag; FiO2: fraction of inspired oxygen; InCal: indirect calorimetry; MIGET: multiple inert gas elimination technique; PaCO2: partial pressure of carbon dioxide in arterial blood; PACO2: partial pressure of carbon dioxide in alveolar air; PaO2: partial pressure of oxygen in arterial blood; PBW: predicted body weight; PCO2: arterial carbon dioxide tension; PeCO2: partial pressure of carbon dioxide in mixed expired air; PEEP: positive end-expiratory pressure; PETCO2: end-tidal partial pressure of carbon dioxide; PF: PaO2/FiO2ratio; Ppeak: inspiratory peak pressure; PRVC: pressure-regulated volume control; VCap: volumetric capnography; VD,alv: alveolar dead space; VD,aw: airway dead space; VD,phys: physiological dead space; VD/VT: dead-space fraction;:V:: minute ventilation;:VCO2: carbon dioxide production per minute.
Competing interests
LMAH has received travel grants and speaker’s fees from Orion Pharma, Maquet Critical Care, and Biomarin. LMAH has also received an ongoing research grant from Orion Pharma. JD, JlN, MPAJV, LHR, FA, JGvdH, and HWHvH declare that they have competing interests.
Authors’contributions
JD participated in study conception and design, performed dead-space measurements, performed data and statistical analysis, and drafted the manuscript. JLN participated in study conception and design, performed dead-space measurements, performed data analysis, and helped to draft the manuscript. MPAJV performed dead-space measurements and helped to revise the manuscript. LHR performed dead-space measurements and helped to revise the manuscript. FA performed dead-space measurements. HWHvH performed data analysis and helped to revise the manuscript. JGvdH
participated in study conception and design and helped to revise the manuscript. LMAH participated in study conception and design and helped to revise the manuscript. All authors read and approved the final manuscript.
Author details
1Department of Critical Care Medicine, Radboud University Medical Center, Geert Grooteplein Zuid 10, 6525, GA, Nijmegen, The Netherlands. 2
Department of Pulmonary Diseases, Radboud University Medical Center, Geert Grooteplein Zuid 10, 6525, GA, Nijmegen, The Netherlands.
Received: 25 January 2016 Accepted: 20 April 2016
References
1. Nuckton TJ, Alonso JA, Kallet RH, Daniel BM, Pittet JF, Eisner MD, et al. Pulmonary dead-space fraction as a risk factor for death in the acute respiratory distress syndrome. N Engl J Med. 2002;346(17):1281–6. 2. Cepkova M, Kapur V, Ren X, Quinn T, Zhuo H, Foster E, et al. Pulmonary
dead space fraction and pulmonary artery systolic pressure as early predictors of clinical outcome in acute lung injury. Chest. 2007;132(3):836–42.
3. Lucangelo U, Bernabe F, Vatua S, Degrassi G, Villagra A, Fernandez R, et al. Prognostic value of different dead space indices in mechanically ventilated patients with acute lung injury and ARDS. Chest. 2008;133(1):62–71. 4. Raurich JM, Vilar M, Colomar A, Ibáñez J, Ayestarán I, Pérez-Bárcena J, et al.
Prognostic value of the pulmonary dead-space fraction during the early and intermediate phases of acute respiratory distress syndrome. Respir Care. 2010;55(3):282–7.
5. Mercat A, Diehl JL, Michard F, Anguel N, Teboul JL, Labrousse J, et al. Extending inspiratory time in acute respiratory distress syndrome. Crit Care Med. 2001;29(1):40–4.
6. Maisch S, Reissmann H, Fuellekrug B, Weismann D, Rutkowski T, Tusman G, et al. Compliance and dead space fraction indicate an optimal level of positive end-expiratory pressure after recruitment in anesthetized patients. Anesth Analg. 2008;106(1):175–81.
7. Devaquet J, Jonson B, Niklason L, Si Larbi AG, Uttman L, Aboab J, et al. Effects of inspiratory pause on CO2elimination and arterial PCO2in acute lung injury. J Appl Physiol. 2008;105(6):1944–9.
8. Fengmei G, Jin C, Songqiao L, Congshan Y, Yi Y. Dead space fraction changes during PEEP titration following lung recruitment in patients with ARDS. Respir Care. 2012;57(10):1578–85.
9. Bohr C. Ueber die Lungenathmung. Skand Arch Physiol. 1891;2:236–68. 10. Tusman G, Sipmann FS, Bohm SH. Rationale of dead space measurement by
volumetric capnography. Anesth Analg. 2012;114(4):866–74. 11. Enghoff H. Volumen inefficax. Bermekungen zur Frage des shadlichen
Raumes. Upsala Lakareforen Forh. 1938;44:191–218.
12. Kuwabara S, Duncalf D. Effect of anatomic shunt on physiologic deadspace-to-tidal volume ratio–a new equation. Anesthesiology. 1969;31(6):575–7. 13. Blanch L, Lucangelo U, Lopez-Aguilar J, Fernandez R, Romero PV. Volumetric
capnography in patients with acute lung injury: effects of positive end-expiratory pressure. Eur Respir J. 1999;13(5):1048–54.
14. Jones NL, Robertson DG, Kane JW. Difference between end-tidal and arterial PCO2in exercise. J Appl Physiol. 1979;47(5):954–60.
15. Shimada Y, Yoshiya I, Tanaka K, Sone S, Sakurai M. Evaluation of the progress and prognosis of adult respiratory distress syndrome: simple respiratory physiologic measurement. Chest. 1979;76(2):180–6. 16. Liu Z, Vargas F, Stansbury D, Sasse SA, Light RW. Comparison of the
end-tidal arterial PCO2gradient during exercise in normal subjects and in patients with severe COPD. Chest. 1995;107(5):1218–24.
17. Tusman G, Scandurra A, Böhm SH, Suarez-Sipmann F, Clara F. Model fitting of volumetric capnograms improves calculations of airway dead space and slope of phase III. J Clin Monit Comput. 2009;23(4):197–206.
18. Tusman G, Sipmann FS, Borges JB, Hedenstierna G, Bohm SH. Validation of Bohr dead space measured by volumetric capnography. Intensive Care Med. 2011;37(5):870–4.
19. Tusman G, Gogniat E, Bohm SH, Scandurra A, Suarez-Sipmann F, Torroba A, et al. Reference values for volumetric capnography-derived non-invasive parameters in healthy individuals. J Clin Monit Comput. 2013;27(3):281–8. 20. Forbat AF, Her C. Correction for gas compression in mechanical ventilators.
21. The ARDS Definition Task Force. Acute respiratory distress syndrome: the Berlin Definition. JAMA. 2012;307(23):2526–33.
22. Robertson HT, Swenson ER. What do dead-space measurements tell us about the lung with acute respiratory distress syndrome? Respir Care. 2004;49(9):1006–7.
23. Robertson HT. Dead space: the physiology of wasted ventilation. Eur Respir J. 2015;45(6):1704–16.
24. Kallet RH, Daniel BM, Garcia O, Matthay MA. Accuracy of physiologic dead space measurements in patients with acute respiratory distress syndrome using volumetric capnography: comparison with the metabolic monitor method. Respir Care. 2005;50(4):462–7.
25. Sinha P, Soni N. Comparison of volumetric capnography and mixed expired gas methods to calculate physiological dead space in mechanically ventilated ICU patients. Intensive Care Med. 2012;38(10):1712–7. 26. Siobal MS, Ong H, Valdes J, Tang J. Calculation of physiologic dead space:
comparison of ventilator volumetric capnography to measurements by metabolic analyzer and volumetric CO2monitor. Respir Care. 2013;58(7):1143–51.
27. Schulz A, Schulz H, Heilmann P, Brand P, Heyder J. Pulmonary dead space and airway dimensions in dogs at different levels of lung inflation. J Appl Physiol. 1994;76(5):1896–902.
28. Beydon L, Uttman L, Rawal R, Jonson B. Effects of positive end-expiratory pressure on dead space and its partitions in acute lung injury. Intensive Care Med. 2002;28(9):1239–45.
29. Tusman G, Böhm SH, Suarez-Sipmann F, Turchetto E. Alveolar recruitment improves ventilatory efficiency of the lungs during anesthesia. Can J Anaesth. 2004;51(7):723–7.
30. Feihl F, Eckert P, Brimioulle S, Jacobs O, Schaller MD, Mélot C, et al. Permissive hypercapnia impairs pulmonary gas exchange in the acute respiratory distress syndrome. Am J Respir Crit Care Med. 2000;162(1):209–15.
• We accept pre-submission inquiries
• Our selector tool helps you to find the most relevant journal • We provide round the clock customer support
• Convenient online submission • Thorough peer review
• Inclusion in PubMed and all major indexing services • Maximum visibility for your research
Submit your manuscript at www.biomedcentral.com/submit