Applying bifocal displays to data visualisation : a dissertation presented in partial fulfilment of the requirements for the degree of Doctor of Philosophy in Computer Science at Massey University, New Zealand
198
0
0
Full text
(2) A p p lying B i focal Displays to Data Visualisation. A dissertation presented in partial fulfilment of the requirements for the degree of Doctor of Philosophy in Computer Science at Massey University, New Zealand.. Ying Keung Leung BSc(Hons), BA, MSc, MBA. 1 99 5.
(3)
(4) Abstract. Rapid advances in communications and computer technologies in recent years have provided users with greater access to large volumes of data from computer-based information systems.. The issue of the relatively small window through which an. information space can be viewed brings with it two associated problems: presentation and navigation.. This research is based on an approach called the Bifocal Display. proposed by Spence and Apperley to address these inherent difficulties common in large information spaces in modem computing environments. The essence of this presentation technique is to provide the user with detailed local content as well as a global context to facilitate navigation. In this research, the original one-dimensional Bifocal Display concept has been extended in two-dimensional form to deal with two fundamental types of large information spaces: those with a high information density, for example, large databases and spreadsheets, and those with inherent spatial relationships, such as topographic maps and networks. An experimental study has been carried out to study the usability of the Bifocal Display and other presentation techniques based on various implementations of the London Underground map. Results have shown that the Bifocal Display is a usable and effective approach for the presentation of large information spaces. Presentation techniques can be broadly classified into distortion-oriented and non-distortion-oriented; the former generally requires more computational resources than the latter. With the increasing processing power of personal computers, researchers have developed a variety of novel distortion-oriented presentation techniques. Unfortunately, the distorting appearance resulting from the application of these techniques, coupled with the growing number of new tenninologies used by researchers, has caused some confusion to the graphical user interface designer. A taxonomy of. V.
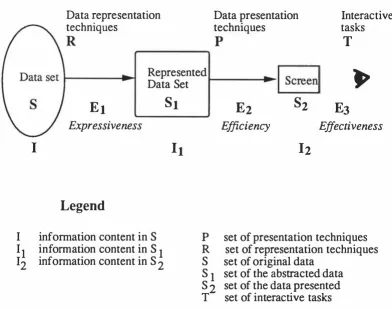
(5) distortion-oriented techniques based on their magnification functions has been proposed to facilitate the identification of the similarities and differences of these techniques. A conceptual model has also been put forward to unveil the underlying principles which govern their operations. Despite the variety of novel presentation techniques currently available, the choice of a technique in a particular application remains very subjective; there is a general. lack of selection guidelines or methodologies. An evaluation framework E3 has been developed to provide a basis for the comparison of different presentation techniques, given the nature and characteristics of the data to be presented, and the interpretation. required. E 3 focuses on three aspects of graphical data presentation: expressiveness, efficiency and effectiveness. This framework lays the foundation for the development of a set of metrics to facilitate an objective assessment of presentation techniques. A general visualisation tool, the InfoLens, has been designed based on the theoretical framework of this research.. The design of the InfoLens has further. demonstrated that the Bifocal Display is an effective approach to visualising large information spaces.. VI.
(6) Ack nowl e dgem e n ts. First and foremost, I would like to thank Professor Mark Apperley, my chief supervisor, for his guidance and support during the course of this research. The year that I spent on Massey campus was particularly productive as the environment in the Computer Science Department there was most conducive to research activities. The technical staff in the School of Mathematical and Information Sciences were most cooperative; they often went to great trouble to facilitate my special computing needs. I am very grateful to them for their assistance. I would also like to thank Dr. Ross Smith, a learned colleague of mine at Swinburne, who acted as my second project supervisor. His constant encouragement throughout this research is much appreciated.. I am also indebted to my employer,. Swinburne University of Technology, who generously granted me six months' sabbatical leave to further my research at Massey. This research dated back to the second half of. 1987, when I spent six months'. sabbatical leave in the Information Engineering Section of the Electrical Engineering Department at Imperial College, England.. I would like to thank Professor Robert. .;. Spence, who first introduced me to the exciting field of human-computer interaction.. In the course of the development of this project, the technical assistance provided. by Mr. Dat Tran, a computer systems officer in the School of Computer Science and. Software Engineering at Swinburne was invaluable. A group of graduate students, Ian Miller, Peter Phillips and Michael Quinn also contributed to this project in the generation of the later versions of Bifocal Displays for the London Underground Map and the. Melbourne Metropolitan Railway Map. Their assistance is gratefully acknowledged.. V1l.
(7) Finally, I would like to express my deepest gratitude and love to my wife Gillian and my two children, Martyn and Maurice, who made tremendous sacrifices especially during my year of absence in New Zealand. Without their understanding and emotional support, this research could not have been completed.. Vlll.
(8) Conte nts. Introduction. Chapter 1. 1. 1.1. Accessing large information spaces. 1. 1.2. Motivation for the research. 7. 1.3. Objectives of the research. 8. 1.4. Approach adopted. 8. 1.5. Outline of the thesis. 9. Chapter 2. A Brief Overview of Human-Computer Interaction and Graphical Presentation. 11. 2.1. Human-computer communication. 12. 2.2. Communication media in HCI. 13. 2.3. Graphical user interfaces. 20. 2.4. Graphical presentation of data. 25. 2.5. Review. 29. Chapter 3. The Bifocal D isplay. 31. 3.1. The Bifocal concept.. 32. 3.2. Applying Bifocal Displays to topological maps. 36. 3.3. A comparative study of graphical user interfaces for topological maps. 44. 3.4. Subjective evaluation: Experiment. 47. 3.5. Qitical evaluation. 3.6. Objective evaluation: Experiment. 3.7. Review. 1. 54 2. 56 60. xi.
(9) Chapter 4. A Taxonomy and Conceptual Model of DistortionOriented Presentation Techn iques. 61 61. 4. 1. Introduction. 4.2. A review of distortion-oriented presentation techniques. 64. 4.3. A taxonomy of distortion-oriented presentation techniques. 78. 4.4. A conceptual model. 81. 4.5. Discussion. 83. 4.6. Conclusion. 88. The E 3 Model. Chapter 5. 91. 5. 1. Introduction. 92. 5.2. Presentation of large data sets. 93. 5.3. £3: the framework. 98. 5.4. Discussion. 101. 5.5. Concluding remarks. 106. Designing the InfoLens. C hapter 6. 107. 6. 1. The Lens Metaphor. 108. 6.2. Design considerations. 1 15. 6.3. Final design and illustrations of the lnfol.ens. 1 18. 6.4. Implementation issues. 133. 6.5. Review. 135. Chapter 7. Conclusion. 137. 7. 1. Summary of thesis. 137. 7.2. Review of the lnfoLens. 139. 7.3. Original contributions. 140. 7.4. Future research work. 141. References. 145. Appendix A Experimental Data on Graphical User Interfaces for Topologica l Maps. 15 9. Appendix B Mathematical Derivation of Transformation and Magnification Functions. 17 3. Xll.
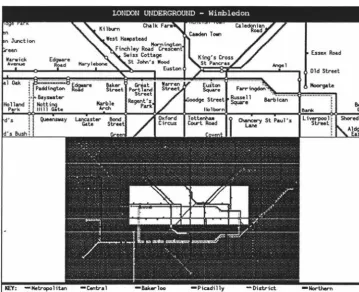
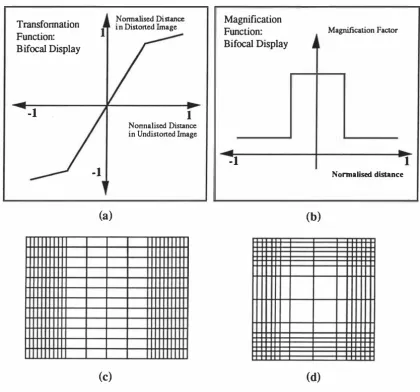
(10) Figures. Figure. 3.1. The display of a two-dimensional infonnation space.. 33. Figure. 3.2. An electronic diary as it appears on the Bifocal Display, with the current week in the central region.. 34. Figure. 3.3. Locating a journal article with the Bifocal Display.. 35. Figure. 3.4. Split screen display of the London Underground map.. 39. Figure. 3.5. Implementation of a two-dimensional Bifocal Display.. 41. Figure. 3.6. Bifocal Display of the London Underground map and the Melbourne Metropolitan Railway map.. 42. Figure. 3.7. Scrolling view of the London Underground map.. 46. Figure. 3.8. Subjects' relative preferences for the five interfaces.. 50. Figure. 4. 1. A taxonomy of presentation techniques for large graphical data spaces.. 62. Transforming an elliptical object using the Bifocal Display technique.. 65. A rectangular grid is to be mapped onto a confined space by applying a distortion-oriented technique.. 66. Figure. Figure. 4.2 4.3. Figure. 4.4. The polyfocal projection.. 68. Figure. 4.5. The Bifocal Display.. 69. Figure. 4.6. A typical magnification function for Furnas's "Fisheye View".. 71. Figure. 4.7. Analysing the Perspective Wall.. 74. Figure. 4.8. The Perspective Wall.. 75. Figure. 4.9. The Fisheye View.. 77. A taxonomy of distortion-oriented presentation techniques.. 78. Figure 4.10. Xlll.
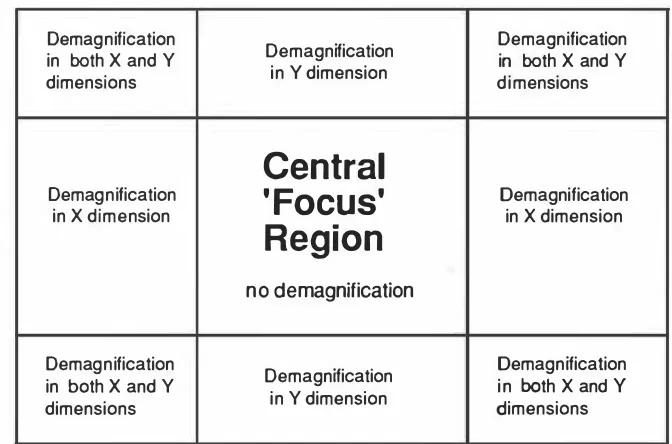
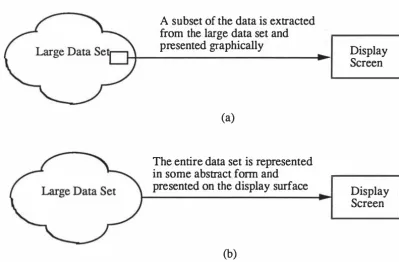
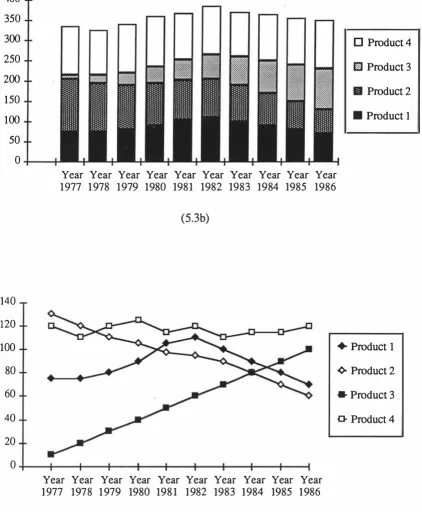
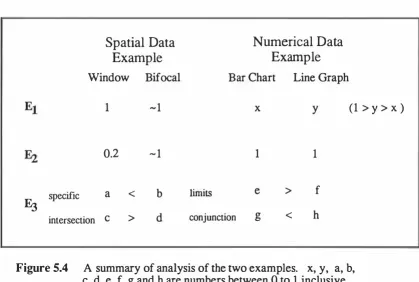
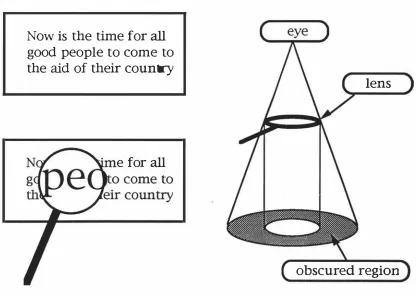
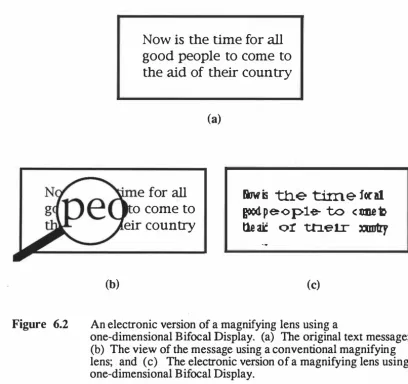
(11) Figure. 4.11. Figure 4.12. The 25 regions that would be generated by extending a two-dimensional Bifocal Display to incorporate three distinct magnification levels, rather than two.. 79. The magnification function of a piecewise Fisheye View.. 80. Figure. 4.13. The effects of stretching the rubber sheet. 82. Figure. 4.14. A common problem with multi-foc�s presentations.. 86. Figure. 4.15. An application of the combined spatial and information enhancement technique using a Bifocal Display.. 87. Figure. 5.1. Two common approaches in presenting large data sets.. 96. Figure. 5.2. Stages involved in designing a presentation system for large data sets.. 99. Figure. 5.3. Example diagrams as used by Sparrow. Figure. 5.4. A summ ary of analysis of the two examples.. 105. Figure. 6.1. The problem with a magnifying lens.. 109. Figure. 6.2. An electronic version of a magnifying lens using a one-dimensional Bifocal Display.. 110. Figure. 6.3. The three canonical manipulation operations of a rectangular magnifying lens.. 111. Different views generated by manipulating the electronic magnifying lens.. 112. Figure. 6.4. (1987).. 103. Figure. 6.5. The interface of the lnfoLens.. 119. Figure. 6.6. Three representations of the data as the representation button is progressively activated.. 121. The operation of the special cursor for adjusting the column width or row height to show the hidden data.. 122. Figure. 6.7. Figure. 6.8. The menu and dialogue box for specifying an integrated view.. 123. Figure. 6.9. The dialogue box for specifying the Lens Filter.. 124. Figure. 6.10. A typical view of a fmancial database through the InfoLens.. 128. Figure. 6.11. A multi-focus view of the same database.. 128. Figure. 6.12. A multi-focus view showing time-series data.. 129. Figure. 6.13. An integrated view of the multi-dimensional data using Chemoff faces. 130. Figure. 6.14. The lens filter highlights stocks with a dividend yield of 6% or higher.. 131. Figure. 6.15. The lens filter highlights stocks with a dividend yield of 6% or higher and a price to earning ratio of 14 or lower.. 131. Figure. 6.16. A presentation and comparison of the data stored in the container.. 132. XIV.
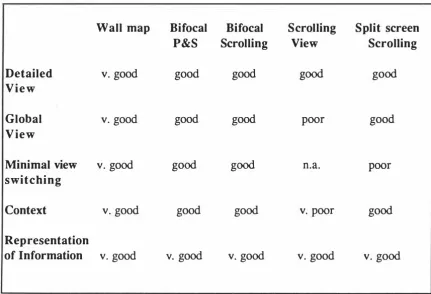
(12) Tables. A critical evaluation of the five interfaces based on five display criteria.. 55. Table 3.2. A critical evaluation of the five interfaces based on tasks.. 55. Table 3.3. A summary of task completion times in seconds of the 34 subjects in Exp eriment 2.. 58. A summary of the number of uncompleted tasks for each of the four interfaces.. 58. Table 3.1. Table 3.4 Table 6.1. An. excerpt from a financial database.. XV. 126.
(13)
(14) Publication s. The following publications have been prepared in the course of this research:. 1.. Leung, Y.K. (1989): Human-computer interface techniques for map-based diagrams. In Advances in Hwnan Factors/Ergonomics , Vol 12B: Designing and using Human-Computer Interfaces and Knowledge Based Systems, (Eds. Salvendy, G. and Smith, M.) Amsterdam, Elsevier, 361-368.. 2.. Howard, S. and Leung, Y.K. (1991): Interacting with graphical user interfaces. Proceedings of OZCHI '91 , Sydney, November 1991, 47-52.. 3.. Leung, Y.K. (1992): A comparative study of graphical user interfaces for topological maps. Massey University School ofMathematical & Information Sciences, Report Series A No. 92/1.. 4.. Leung, Y.K. and Apperley, M.D. (1993): A taxonomy of distortion-oriented techniques for graphical data presentation. In Advances in Hwnan Factors/Ergonomics , Vol 19B: Human-Computer Interaction - Software and Hardware Interfaces, (Eds. Salvendy, G. and Smith, M.), Amsterdam, Elsevier, 104-109.. 5.. Leung, Y.K. and Apperley, M.D. (1993): E3: Towards the metrication of graphical presentation techniques for large data sets. In Lecture Notes in Computer Science Vo/ 753: Hwnan-Computer Interaction, (Eds. L.J. Bass, J.G. Gomostaev and C. Unger) Berlin: Springer-Verlag, 125-140.. 6.. Leung, Y. K. and Apperley, M.D. (1993): A unified theory of distortion-oriented presentation techniques. Massey University School ofMathematical & Information Sciences Repon , Series A No. 93/1.. 7.. Leung, Y.K. and Apperley, M.D. (1993): Extending the Perspective Wall. Proceedings of OZCHI 93, Canberra, November 1993, 110-120. '. XVll.
(15) 8.. 9.. Leung, Y.K. and Apperley, M.D.. (1994): A review and taxonomy of distortion oriented presentation techniques. ACM Transactions on Computer-Human Interaction. 1, 2, 126-160. Leung, Y.K., SpenceR. and Apperley M.D. topological m aps.. (1995): Applying Bifocal Displays to International Journal ofHuman-Computer Interaction, 1, 1, 79-. 98.. xviii.
(16) Chapter 1. Introduction. "We are entirely convinced the future is 'visual'. We believe that in the next few years many more of our daily technical and scientific chores will be carried out visually, and graphical facilities will be far better and cheaper than today's . ... They (languages and approaches) will be designed to encourage visual modes of thinking when tackling systems of ever-increasing complexity, and will exploit and extend the use of our own wonderful visual system in many of our intellectual activities. " Harel, 1988. 1.1. Accessing Large Info rmation Spaces The computerisation of information systems, coupled with better communication. facilities and ease of connection to remote sites in recent years, has resulted in the exponential growth of information confronting the computer user.. In performing a. typical task on the computer, the user is often required to spend a large proportion of his or her time at the workstation locating various pieces of information stored in the system. Tools which would assist the user to locate specific information in these information bases could therefore significantly improve productivity and efficiency. In the context of human-computer interaction, information retrieval goes beyond. just the location of a piece of data; it also encompasses comprehension and understanding of the data presented by the system. There are two levels of difficulty. 1.
(17) 2. �R1: ThiTRODUCTION. associated with information retrieval over a small display screen on which large information spaces can be presented.. At the upper level, the problem relates to the. management of various information sources. Window-oriented systems allow the user to see information from several tasks, but severe conflicts among tasks contending for the limited activities.. screen. space available may lead to high overheads engaged in task switching. At the lower level, the problem is one of locating items within a large. information space over a small display screen, once the desired window is selected. Often, the user encounters difficulty in navigating within this information space, and in extreme cases, can get completely disoriented in it. Visualisation is emerging as a key concern for a wide variety of applications. It brings the human visual system with its pattern recognition capabilities to bear in either exploration or portrayal of information (McCormick, DeFranti & Brown, 1987). Large complex data sets are displayed in ways to allow the viewer to investigate the global nature of numerical solutions and to explore analyses visually. Visual programming systems represent algorithms in ways that may improve clarity and simplicity of expression,. as. well as manage complexity in large systems (Shu, 1988). In knowledge. engineering environments, systems often supply graphical representations of rules and facts, and effective knowledge visualisation systems have been developed (Patel & Sutcliffe, 1993). Even hypertext systems, which are predominantly textual in content, typically rely on visual representations for navigation and orientation (Conklin, 1987).. Interacting with a small display surface Whilst the visual channel is the. key. means of computer-to-human. communication in the computing system, the limited screen space available on the display .monitor places. a. serious constraint on its effectiveness.. Many knowledge. intensive computer applications require that the user interacts with a considerable number of objects, often residing in different parts of the system. In order that the user can examine, manipulate and track these objects, they should be readily visible. When humans perform tasks with paper, current information is usually managed using a horizontal two-dimensional space in the form of a desk. The person organises his or her sources and reference (books and papers) on the table in such a way that visual arrangement. provides memory cues that organise and ease the performance of the tasks.. Henderson and Card (1987) compare the sizes of desks and tables with various display screens and suggest that the size of a typical dining table is equivalent to 119 Macintosh. 9" screens; if the effects of resolution, grey scale and colour were considered, the comparison would be more extreme. The desktop metaphor has been designed around these ideas; the work environment on the computer is presented to the user as if he or she.
(18) �R1: ThiTRODUCTION. 3. is working with paper documents. Whilst computer displays are much smaller than desks or tables, files and folders are hierarchically organised and represented using space-efficient icons on the computer screen to facilitate easy access and interaction. It is well recognised that screen real estate is a scarce commodity and interface designers strive to use this valuable resource efficiently and effectively. Indeed, there are systems available on the market now which support multiple display screens to extend the immediate workspace accessible to the user. In the Macintosh system, for example, two monitors may be configured to form a continuum of work area. However, these systems are costly and moreover, even with these extensions, the display areas are generally not large enough to support the number of non-overlapping windows typically used in a multi-tasking environment Despite the multitude of techniques available to address the small-screen problem, the fundamental difficulty that not all the information may be viewed by the user brings with it two issues: navigating around the information space and the simultaneous viewing of information situated in different parts of the workspace. The issue of navigation relates to the problem of finding the way to locate the desired information without getting lost in the workspace. There is a need to provide the user with a global as well as a local view of the information space. The issue of simultaneous access to separated information can often be overcome with multiple focus presentations using a distortion technique or a multiple linking mechanism such as those in hypertext _ systems.. Switching Tasks In a typical work environment, the user writes a paper, reads and responds to electronic mail messages and news items, looks up databases and performs housekeeping on the computer files. The variety of these tasks to be carried out by the user often demands constant switching of attention from one task to another; especially in situations where mail messages are transmitted and received asynchronously. In the course of these task switching activities, users have to move, reshape and scroll windows, make selections on menus, shrink and expand icons using a pointing device or even type in commands through the keyboard. Bannon, Cypher, Green span & Monty (1983, cited in Card & Henderson, 1987) identify a number of situations in which users switch from one task to another: (1). user digresses to perform tasks that users remember while carrying out another. task; (2). user time-shares among concurrent demands;.
(19) C�Rl:. ThiTRODUCTION. (3). user is working on a task with long waiting periods;. (4). user performs subtasks which relate to the main task;. (5). user runs into a snag and perform error recovery tasks;. (6). user may be interrupted by external sources; and. (7). user shifts to a specialised environment. 4. Some of these task switching operations, are required as a result of the limited screen space available to support multiple non-overlapping views to be displayed simultaneously. Bannon. et al also suggest six areas to consider in interface design, to. support task-switching:. (1 ). reducing the user's mental load when switching tasks;. (2). facilitating speedy suspension and resumption of activities;. (3 ). maintaining records of previous activities;. ( 4). defining functional grouping of previous activities;. (5). supporting multiple perspectives on the tasks at hand; and. (6). providing interdependencies among items in different workspaces. In designing their Rooms system to facilitate task switching in a window-based. graphical user interface, Henderson & Card (1987) take the view that there are specific issues which relate to task switching. One example is the amount of time it takes to perform the switching and the mental complexity of remembering how to invoke the other task and of trying to get into the mental context. They propose a refinement of Bannon et al's list with four specific areas of consideration:. (1). The interface should support fast task switching, fast task resumption and enable the user to re-acquire the mental task context easily.. (2). The interface should provide access to a large amount of information relevant to the task at hand, quickly and with minimal overhead activities.. (3). The interface should support clustering of phases and transitions of user activities to minimise 'window faults'.. (4). The interface should provide the user with engaged tools, or a collection of tools, sharable among several tasks and they should be presented to the user in a task-specific manner.. The Rooms system has been designed around these concepts and a variety of facilities have been implemented to support task switching activities..
(20) CHAPTER 1:. IN1RODUCTION. 5. Information access and retrieval One of the primary goals of visualisation is to help manage and understand large amounts of information. From this perspective, information retrieval systems for large databases are natural application domains of visualisation techniques. The time it takes for the user to gain access to a document, a screen or a piece of information is a quantitative measure of the efficiency of this information retrieval process.. This. information retrieval time can be broken down into two components: the time it takes for the user to provide the relevant keys to enable the system to begin the searching process and the processing time involved in locating the desired information. Research efforts in data structure, compression techniques and information retrieval theory, coupled with the increasing computational power of computing machines, have all contributed to significant reduction of the processing time involved in searching. The time it takes for the user to input the search keys into the system is often much longer than it takes the computer to perform the search. The bottleneck of information flow lies clearly with the human-computer interface, and the design of an effective interface to present information still remains a major challenge to be tackled in an information retrieval system. The standard formulation of the information retrieval problem presumes a query and the user's specification of an information need. The task is then to search the particular database of interest. However, it is sometimes difficult for the user to formulate such a query precisely. For example, in the case of a document search, the user may not be familiar with the vocabulary appropriate for specifying a topic of interest, or may not wish to commit himself to a particular choice of words. In a numerical database containing time series data, the user is often interested in the general trend of the data to gain a feel of the data set. Indeed, the user may not be searching for anything specific at all, but rather may wish to explore the general information content of the database. In fact, access to information covers an entire spectrum: at one end is a narrowly specified search for a particular piece of information given some specific search keys; at the other end is a browsing session with no well defined goals, satisfying a need to learn more about the document collection. It is common for a session to move across the spectrum, from browsing to searching with a specific goal: the user starts with a partially defmed goal which is gradually refined as he fmds out more about the data examined. As standard information access techniques tend to emphasise the search end of the spectrum, the interface for this type of information retrieval system can be generally catered for using a text-based form fill-in style of dialogue. In contrast, interface design to support browsing is far more complex, made more difficult by the small size of the.
(21) �R 1: ThiTRODUCTION. 6. display screen. Further, as the search for information is carried out by the user instead of the computer, the implications on the user's cognitive resources should be carefully considered. In developing a theoretical framework for their Information Visualizer at Xerox. PARC, Card, Robertson and Mackinlay ( 1 99 1) make six observations about information. processing systems: (1). [llierarchy] Organising the parts of a system hierarchically often improves the quantity of information processed relative to processing cost.. (2). [High cost ratios] The cost of accessing information often varies radically both because of the cost in finding it and because of the cost of assimilating it. (3). [Locality of reference] The processing of information exhibits locality of reference. That is, over a small time interval, references to information are not uniformly distributed throughout the corpus, but tend to be concentrated in a subset, called the working set.. (4). [Reference clustering] Information use defines clusters of information used repeatedly to perform some task. The processing of information tends to establish locality of reference in one cluster, then jump to another cluster. Some information may appear in more than one cluster.. (5). [Max information/cost] Information systems tend to adjust themselves to m aximise (or sometimes minimise) the quantity of information processed relative to some processing cost constraint.. (6). [Abstraction] Lower levels of an information processing system simplify and organize information, supplying higher centres with aggregated forms of information through abstraction and selective omission.. The cost of information access time is generally translated into the cost of storage devices for the information. Consequently, different systems are used for various types of information storage, ranging from RAM (tens of nS) to optical tertiary storage devices (seconds). An information access/retrieval system can then be optimised by selecting the most often accessed items with the fastest storage device, matching usage frequency with access time..
(22) �R1: ThiTRODUCTION. 1. 2. 7. Motivation for the Research Baecker & Buxton (1987) observe that the information revolution has brought. upon us a data explosion. The information age has succeeded in making voluminous amounts of information available at our finger tips through the ease of connection and subscription to newsgroups, electronic mailing lists, databases and remote sites. Manoeuvring through these large information spaces at best requires a lot of time, skill, determination and often patience on the part of the user to sift through the available information to extract what is considered to be useful to the user. Recently, information filtering techniques and methods have been developed to help manage this worsening situation (Stevens, 1992; Stadnyk & Kass, 1992; Foltz & Dumais, 1992; Goldberg, Nichols, Oki & Terry, 1992); however, these filtering systems are often not enough. In every transaction with a computer, the user is making decisions. The user needs the relevant information presented in the most expressive, concise and appropriate manner possible. To achieve this, the human capacity for perceiving structure and organisation, in short for comprehension, should be exploited. The human perceptual system most capable of providing a high bandwidth communication channel is vision. The presentation and n avigation of large information spaces over a relatively small display screen still remains a major challenge to the user interface designer. "The difficulty has much in common with that of trying to peruse a newspaper through a 2column-inch sized keyhole ('How long is this article?', 'Where is the crossword?', 'What other headlines are there?', 'What page is this?'), or of attempting to locate a needed diagram or equation within a microfiched article." (Spence & Apperley, 1982). This difficulty is coupled with the advent of multi-tasking computer operating systems which are now commonly available, where users are often required to work on multiple sources of information. Their attention on the computer screen is required to be switched among a number of concurrent tasks often presented on overlapping windows. The advantages of easy access to information offered by current computer and communications technologies may therefore be adversely affected by an unsatisfactory work environment The Bifocal Display (Spence & Apperleyy-1982) was designed to overcome this 'Where am I?' problem which is common in the presentation of large information spaces on a small display surface. Although this technique is simple in implementation and effective for displaying large information spaces, its application has often been. overlooked and its potential under-exploited. The current research is motivated by the need for an interactive visualisation tool for large databases and spreadsheets, the most.
(23) �R1: ThiTRODUCTION. 8. common forms of information spaces on computer systems nowadays. The Bifocal Display is also considered as a possible choice for being the fundamental presentation framework of this visualisation tool.. 1.3. Objectives of the Research The principal objectives of this research are to study and characteris e. visualisation techniques for large databases and to propose a design of a general visualisation tool for the presentation and navigation of large information spaces on a small display surface. Implicit in this objective are the following secondary objectives: •. that the visualisation tool should optimise the use of the available display surface;. •. that the presentation technique used in the tool should be suited for information systems with high information density as well as those which are large and spatial in nature.. •. that the tool should support three prime functions of user interaction with a piece of data in an information system: the location of a piece of data, its interpretation, and its relation to other data.. •. that the tool should be easily adapted in a multi-tasking environment and readily implemented with the currently available technology.. 1.4. App roach Ado pted The following is a summary of the approach adopted in this research to achieve. the objectives set out in Section 1.3: •. A taxonomy of data, tasks and presentation techniques, together with the inherent problems of task switching, is identified. The original Bifocal concept (Spence & Apperley, 1982) is extended to two-dimensional form and the implementation of a 2D-Bifocal Display of the London Underground map is described (Leung, 1989 ). A comparative study using an approach adapted from the multi-dimensional evaluation methodology (Burger & Apperley, 1991) has been carried out to assess the usability of the Bifocal Display and other presentation techniques (Leung, 1992; Leung, Spence & Apperley, 1995)..
(24) CHAPTER1 : INTRODUCTION •. 9. A mathematical analysis of various distortion-oriented presentation techniques forms the basis of the development of a taxonomy and a conceptual model (Leung & Apperley, 1993c; Leung & Apperley, 1994).. •. An analytical framework based on efficiency, expressiveness and effectiveness in facilitating a more objective assessment of presentation techniques for large data sets is presented (Leung & Apperley, 1993b).. •. The design of a visualisation tool for large spreadsheets and databases is described. The tool, the InfoLens, demonstrates the effectiveness of Bifocal Display as a presentation technique for large data sets.. •. The contribution of the research is examined critically and further work identified.. 1.5. Outline of the Thesis The thesis is organised in seven chapters, the order of which also reflects the. chronological development of this research. Chapters 1 and 2 present the major part of the literature survey and establish the need for an effective visualisation tool for large information spaces. Chapter 3 examines the Bifocal Display and evaluates its usability. as a general approach for data presentation. In Chapter 4, a taxonomy and a conceptual model of distortion-oriented techniques are presented to show their roots and origins which help clarify the confusing nature of these techniques. A framework for the metrication of presentation techniques is described in Chapter5 to facilitate a more objective assessment of the relative merits of different presentation systems. Chapter 6 discusses the design rationale for and provides a detailed design of, the InfoLens, a visualisation tool for large spreadsheets and databases based on the Bifocal Display. Chapter 7 is a review chapter in which the contribution of this research is examined and further work identified..
(25)
(26) Chapter 2. A Brief Review of Human-Computer Interaction and Graphical Presentation. "Richard Hamming observed many years ago that The purpose of [scientific] computing is insight, not numbers'. The goal of visualization is to leverage existing scientific methods bYproviding new scientific insight through visual methods. " McCormick, DeFranti & Brown, 1987. Graphical user interfaces are now ubiquitous on modem computing machines. These interfaces exploit the wide bandwidth of the human visual perceptory system which is supported by the highly developed processing capability of the brain to interpret graphical data. Indeed, effective visualisation systems match the computer's capacity to generate and present large data sets in various graphical form to optimise the information flow between the system and the user. This chapter flrst examines the human-computer communication process (Section 2 .1 ) and discusses various communications channels available to support it (Section 2 .2). Section 2 .3 presents an overview of graphical user interfaces andSection. 2 .4 provides a discussion of the techniques for presenting graphical data. Section 2 .5 reviews the problems of visualising large information spaces on a small display surface and identifies the inherent presentation and navigation difficulties.. 11.
(27) CHAP1ER2:. 2.1. A BRlEF REVIEW OF HCI AND GRAPHICAL PRESENTATION 12. Human-Computer C ommunication The way humans use and communicate with computers has changed enormously. over time. Early computers were expensive, and it was important that they did not sit idle for economic reasons. Programs and data were prepared off-line and fed t o the mainframe computer continuously in batches by operators, often around the clock. After the execution of a job, the computer output was returned to the user. This approach kept the computer busy, but wasted the user's time. Users of early systems needed to have a good knowledge and understanding of how the computer works and consequently the use of computers was typically in the domain of highly trained computing professionals. The huge technological advances in the processing power of personal computers over the past fifteen years have brought about many powerful techniques and effective devices for the user to interact with the modern computing machine. Research efforts in human-computer interaction over the same period have also provided us with a much better understanding of the communicative processes which take place between the user and the machine in a real-time interactive environment. It is now widely accepted that the bottleneck in improving the usefulness of interactive systems lies not in performing the processing task itself, but in communicating requests and results between the system and the user (Jacob, Leggett, Myers & Pausch, 1993). These developments have led to new approaches to user interface design, shifting from those purely driven by the new technologies since the early days of interactive computing machines, to those involving extensive and continual user participation and involvement.. The field of computer. systems design is experiencing a shift in research emphasis from producing more elegant and faster algorithms towards producing more user-oriented systems (Gaines & Shaw,. 1986; Norman, 1986; Borgman, 1984). The terms 'user-centred design' and 'task oriented design' are now synonymous with modern user interface design methodologies. As increasing attention and effort have been placed by software engineers on producing easy-to-use and easy-to-learn interfaces, interface software is becoming large and complex and typically represents a significant portion of code in an application. Bobrow, Mittal & Stefik (1986) report that 40 to 5 0 percent of the code and runtime memory of artificial intelligence applications are devoted to interface aspects. Smith. (1986) observes that whilst user interface software is critical to system performance, it can also represent a sizeable proportion of the cost of a project. The creation of a good user interface requires special skills, tools and methodologies, and often the collaboration of a team of professionals with a good knowledge and understanding of human factors in computer systems. This is because the exchange of dialogue between humans and computers is far more complex than that.
(28) CHAPIER 2: A BRIEF REVIEW OF HCI AND GRAPIDCAL PRESENTATION 1 3. between humans or than that between computers.. In computer-computer. communication, dialogues between systems are well structured and must be pre-defined. Indeed, the International Standards Organisation has established a comprehensive reference model for Open Systems Interconnection (OSI) to facilitate the exchange of data among heterogeneous/homogenous computer systems linked together, often over long distances, by complex communications networks (ISO, 1982). The hierarchical nature of this now well known seven layer model has made it easy for the engineer to adopt a top-down approach to designing computer systems for the exchange of data in a controlled and orderly manner. A further advantage of this structured model is that it facilitates easy identification of communication faults, when they arise, within the network. Typically, interactive human-human communication is primarily carried out over the audio channel. The exchange of dialogue is error prone, as the meanings of a dialogue depend not only upon the literal meaning of the words themselves, but also upon the context in which they are communicated and the recipient's knowledge of language and the world generally (Booth, 1989). Whilst the verbal communicative process between humans is highly complex and does sometimes lead to misinterpretation, facial expressions and gestures often supplement and enhance the bandwidth for communication. Binding, Schmandt, Lantz & Arons (1990) suggest that human communication is much richer than an exchange of text or graphical images, as it employs a variety of channels such as speec h, intonation, gesture and eye contact. The difficulties with human-computer communication lie in the fact that there is a fundamental asymmetry in human-computer interaction, which is not present in computer-computer communication.. Hollnagel (198 3 ) considers that one major. contributing factor is that humans, unlike machines, are not designed explicitly as parts of man-machine systems. Norman (1986) identifies the discrepancies between the psychological variables of users and the physical variables of the system as two gulfs that must be bridged: the gulf of execution and the gulf of evaluation. He suggests that the design of a user interface should aim to minimise the gaps between the user's goals and the system.. 2.2. Communication Media i n HCI The growing interest in human-computer interaction in recent years has led to a. great increase in our understanding of the interactive processes between the user and the machine. Researchers have developed various models in an attempt to specify these.
(29) CHAPTER 2:. A BRIEF REVIEW OF HCI AND GRAPHICAL PRESENTATION 14. underlying processes (Moran, 1981; Foley & van Dam, 1982; Buxton; 1983; Nielsen,. 1986). These models comprise three key components: the conceptual domain, the communication domain and physical domain (Thompson, 1991).. Models of the. conceptual domain generally fall into two categories: those concerned with cognitive processes and those with cognitive structure. Models of the communication domain are models of interactive language. An interactive language typically consists of a set of rules defining the syntactic structure of a language for the description of the communication between the user and the computer. Models of the physical domain consist of a representation of the physical and/or behavioural characteristics of the communication channel.. Nielsen (1986) proposes a seven layer protocol model for. computer-human interaction which is conceptually based on, and hierarchically similar to, the ISO reference model for Open Systems Interconnection. An important aspect of this model is that physical communication is only taking place at the physical level, the lowest layer of the model. All other levels communicate with each other indirectly through the use of a set of well defmed protocols. Because of the inherent asymmetry of communication, physical interaction between the user and the machine is carried out through the use of dedicated interactive input and output devices. Despite the comprehensive range of input and output devices currently available,. the means by which human-computer communication is achieved rely on the use of three human senses through the visual channel, the audio channel and the haptic channel (Baecker & Buxton, 1987). Whilst human senses can be broadly classified as near and distant, interactive systems typically involve these two types of senses to provide a richer interaction with the user. In a modem computing environment a user interacts with the computer with input devices such as a keyboard and/or a mouse through the haptic channel, while the computer generates graphical or audio (or both) output to the user to enable the user to establish and maintain an effective mental model to perform the desired tasks. Whilst there has been relatively little work carried out on the use of the other two human perceptual faculties, smell and taste, for human-computer interaction applications, interest has increased recently in exploring these two senses in virtual reality applications to create a more complete and realistic environment (Rheingold,1992; Kalawsky,1993). There are a number of reasons for the lack of research interest in these two senses, especially in their use as a means of presenting quantitative information to the user. First, the underlying operation of these two sensory processes are chemical in nature and as such, their sensations are rather subjective. Second, these two human senses are often affected by external factors and conditions; for example, tastes are strongly influenced by the presence of smell. Third, whilst there has been experimentation in the.
(30) CHAPfER 2 : A BRIEF REVIEW OF HCI AND GRAPlllCAL PRESENTATION 15 use of smell in some virtual reality systems, there is a practical problem in overcoming the persistence of 'left-over' sensation. Fourth, there are difficulties in the generation of these senses and, from the implementation point of view, the interactive device required to support these systems tends to be too intrusive to the user for practical application. Finally, experimental evidence has shown that the channel capacity of taste intensity is significantly lower than that of the visual channel (Beeb-Center, Rogers & O'Connel, 1955), making it a less useful means of representing data. Jacob et al (1993) observe that odours are still classified in terms of many seemingly arbitrary components, rather than a single, universal basis. Consequently, it is not yet possible to synthesise an odour in the way one can synthesise a convincing. graphical image of an arbitrary object by modulating beams of red, green, and blue light. on the display screen. The haptic channel is one which involves physical contact between the user and the computer.. Touch is a proximate sense.. It is an important medium for. communication as humans have highly developed hands which can be controlled with a fine degree of accuracy. Over the years, haptic input devices such as keyboards, mice, joysticks, tablets and gesture gloves have been developed for a variety of applications to enhance the interaction with the computer. However, haptic output devices are rare. One example would be a device capable of producing output in braille. Another recent example is the Feelmouse (Penz & Tscheligi, 1993), an interaction device with force feedback to extend the base of human-computer communication from a strongly visual to multisensory information exchange. Strictly speaking, every input device can be considered to provide output through the tactile or kinaesthetic feedback it provides to the user. The effectiveness and acceptance of a device in a particular application often depends on the quality and appropriateness of this 'feel'.. In describing their touch communication systems. consisting of sophisticated touch sensors and servo-mechanisms, Geyer & Wilson (19 75) postulate that touch communication may allow a growing intimacy between humans and machines. It is important to note that concepts relevant to the use of the hands generally apply to control through other parts of the body. For example, foot pedals, head operated keypress pointers and tongue activate joysticks have been developed for users with physical disabilities.. The audio channel in HCI Historically, the development of computer user interfaces has been linked to the technology of cathode ray tubes. Consequently the application of sound as a main.
(31) CHAP1ER 2: A BRIEF REVIEW OF HCI AND GRAPHICAL PRESENTATION 16 medium for communication between the computer and the user has been under-explored, constrained by the need for complicated and expensive hardware to generate high quality sound (Frysinger, 199 0).. The advent in recent years of low cost A-to-D, D-to-A. converters, memory devices, consumer-oriented digital music synthesisers and indeed efficient data compression techniques, coupled with the development of the MIDI interface (Loy, 1985 ), has brought sound to a growing number of PC-based software applications. Early research interests in the use of human speech as a human-computer interface were directed towards the development of intelligent and robotic systems for voice recognition and speech synthesis in the automated manufacturing environment. Applications of non-speech audio were only confined to warning signals and alarms. More recently, experimentations on sound as a medium for the representation of statistical data have been carried out.. Chambers, Mathews and Moore ( 19 74) use. multiple parameters of sound - frequency, spectral content and modulation - to encode multi-dimensional data which cannot be displayed on a conventional scatter plot. In a similar vein, Yeung ( 198 0) presents an audible display for experimental multi dimensional data from analytical chemistry using frequency, intensity, damping, direction, duration/repetition and rest. He further suggests that multivariate data of up to. 20 dimensions can be represented using sound and that audio representation of multivariate analytical data is superior to the known visual methods.. Bly ( 1982). combines her auditory display scheme to a visual scatterplot and also to a combined (redundant) auditory/visual representation. She provides experimental evidence to support her argument that auditory display is at least as effective and that the combined display outperforms them both.. as the visual display,. Mezrich, Frysinger &. Slivjanovski ( 199 0) developed a dynamic representation employing auditory and visual components for a multivariate time-series display to facilitate decision making. Sound is as an ideal channel of communication for the visually impaired. Various techniques using non-speech sound have been developed to convey quantitative information to this group of disadvantaged people (Lunney & Morrison 198 1; Mansur, Blattner & Joy, 1 9S5 ). Audio-based interfaces have also been specifically designed for the blind user. Edwards ( 1989 ) developed a word processor called Soundtrack with an auditory interface. The system incorporated auditory menus as a means of specifying user commands. Gaver ( 1989 ) proposed the SonicFinder for the Macintosh system, which was an extension of the Apple Macintosh Finder program, that uses auditory icons (Gaver, 1986). Auditory icons are caricatures of naturally occurring sounds used to complement the visual information presented on the screen. Although this system was not specifically designed for the blind, Gaver suggested that the additional audio channel for communication serves to influence the conceptual mapping that produced the model.
(32) CHAPTER 2 : A BRIEF REVIEW OF HCI AND GRAPIDCAL PRESENTATION 17 world that had already been developed for the Finder, adding user satisfaction of with the interface. Gaver (1993) points out that sound is well suited to providing information about previous and possible interactions, indicating ongoing processes and modes which are useful for navigation and to support collaboration. He proposes the use of auditory icons which are like sound-effects for computers, allowing the user to listen to the computer as we do to the everyday world. Gaver later ( 1993) developed synthesis algorithms and techniques to generate a variety of flexible, realistic sounds for auditory icons. Another class of audio-based icons are earcons. Whilst auditory icons u se sound that have a semantic link with the object they represent, earcons , as defined by Blattner, S umikawa & Greenberg ( 1 989), are audio mess ages which provide information and feedback to the user about computer entities. Families of earcons can be constructed, where audio messages with meanings are derived, through modular, transformational and hierarchical structures. Jones & Furner ( 1 989) compared u ser performances between earcons, auditory icons and synthetic speech. Their results showed that whilst subjects preferred earcons they were better able to associate auditory icons to commands. In a series of experiments, Brewster, Wright & Edwards ( 1 993) attempted to discover how well earcons can be recalled and recognised. Earcons are found to be effective for communicating information in a human-computer interface. Brewster, Wright & Edwards also showed that earcons were better than an unstructured burst of sound and that timbres were more effective than simple tones. Whilst the question of how human beings localise auditory events is the subject of an extensive body of psychophysical research, sound has been used to provide 3D spatial information with potential applications in virtual reality systems. Moore ( 1 989) used sound to provide spatial information through a technique called spatialisation. This technique creates the subjective "locatedness" of auditory events despite the fact that sounds responsible for these percepts emanate from loudspeakers sitting at fixed locations inside a listening space. Kendall, Marte.ns & Decker (1989) presented the first reverberation system that recreated the full spatial-temporal sound field of a natural environment.. Wenzel, Wightman & Foster ( 1988) proposed a three-dimensional. auditory display for applications where the user's situational awareness is critical, particularly when visual cues are absent. Smith, Bergeron & Grinstein ( 1990) described several auditory data presentation techniques, including the generation of stereophonic sound with depth and sound that appear to emanate from a two dimensional area. More sophisticated applications of sound in the computing environment have been proposed by researchers recently. Some researchers advocate the use of sound in programming as program auralisation. DiGano, Baecker & Owen ( 1 993) described.
(33) CHAPTER 2: A BRIEF REVlEW OF HCI AND GRAPIDCAL PRESENTATION 18. LogoMedia, a sound-enhanced programming environment for monitoring program behaviour. Binding et al (1990) described VOX, a novel audio and window server architecture integrating audio and graphics as a user interface. Proponents of the use of sound in the interface argue that overly cluttered displays can lead to a "cognitive overload " that adversely affects a user's decision making performance ( Ramsey & Atwood, 1980). Blattner et al (1989) cite Buxton et al's studies (1985) where scores in a video arcade drop when the sound accompanying the video games is turned off. There is also evidence to suggest that messages presented using voice seem to be assimilated with less effort than the same messages presented through visual media (Elliot, 1937; Sticht, 1969). Green & Jacob (1991) advocate that sound can provide the user with another high bandwidth input and output channel, in addition to the visual channel. Guastello , Traut & Korienek (1989) take the view that brain laterization theory (e.g. Perelle & Ehren, 1983) suggests that mixed modality metaphors are more meaningful than other types. The human brain contains two cerebral hemispheres: one side is dominant and contains the verbal processing centre, and the other side is nondominant, and contains spatial processing sites. The parallel processing theory of cognition (Egeth, Jonides & Wall, 1972; Lachman, Lachman & Butterfield, 1979) also supports the view that, when a human perceives a stimulus of mixed verbal and visual context, both sides of the cerebrum process the data simultaneously. Reaction time is faster when the verbal and pictorial stimulus elements are compatible with each other, rather than conflictual (Jensen & Rohwer, 1966). Brewster et al (1993) consider that having redundant information gives the user two chances of identifying the data; if they cannot remember what an icon looks like they may be able to remember what it sounds like. Monk (1986) suggests that sound can be used to present information otherwise unavailable on a visual display, for example mode information or information that is hard to discern visually, such as multi-dimensional numerical data. Further, whilst the foveal area of the retina subtends an angle of only two degrees around the point of flXation, sound, on the other hand, can be heard from 360 degrees without the need to concentrate on an output device, thus providing greater flexibility. Sound is also good at capturing a user's attention whilst he or she is performing another task. Nielsen (1993) considers that interface elements such as sound can add to the richness of the dialogue and thus provide additional cues to the user without adding to the complexity of the primary interaction. Auditory icons remain in the background as long as no exceptional cases are encountered..
(34) CHAPTER 2:. A BRIEF REVIEW OF HCI AND GRAPHICAL PRESENTATION. 19. Despite the advantages of sound as a means of conveying information in the human-computer interface, there are some fundamental problems with it The first and perhaps the most important feature of audio communication is the serial nature of sound. An audio m enu for example must be presented serially, item by item, and the user must. be attentive during its presentation to select an item . If the user misses a menu item, the. audio menu will have to be replayed. This could be a problem if the number of items in the menu is large. In the case of speech communication, speech may not be sped up more than one order of magnitude without losing much intelligibility (Binding et al,. 1 990). Nielsen & Schaefer (1993) found that even though the sound effects seemed enjoyable to several younger interface analysts, the older users (between 70-75 years) testing a drawing program with sound effects did not find the program more enjoyable than those testing it in a silent mode. Also the older test users found the interface more difficult to use when they were exposed to the sounds, possibly because they were overwhelmed by the multi-media effects. Whilst sound offers some attractive features as an important component of the human-computer interface, the use of sound alone will not be appropriate in many applications, especially in the presentation of large data sets. The visual channel is a far more effective m eans of communication, as the high bandwidth nature of this channel facilitates speedy information retrieval and comprehension.. Visual communication and graphical user interfaces Visual communication has a long history with the earliest writing system, essentially pictographic in nature, evolving into systems such as ancient Egyptian hieroglyphs. Today the main vehicle for delivery of information from a computer to a human being is the visual channel. Whilst the computational power of computers has improved at a phenomenal rate since the early days of computing systems, it is interesting to note that visual communication has always been the main output channel of the computing machine.. With the advent of the cathode ray tube, computer output. progressed from the slow, noisy teletype machines to the quiet monochrome video display unit.. Later advances in electronics technology enhanced the monochrome. terminal by the addition of graphics capabilities, enabling diagrams and charts to be presented on the computer screen. Then came the huge progress made in VLSI and memory chips which contributed much to the affordability and availability of colour display systems. With the proliferation of personal computing systems in the eighties, users were ever demanding higher resolution and higher s peed display systems..
(35) CHAPTER 2: A BRIEF REVIEW OF HCI AND GRAPIDCAL PRESENTATION 20 Nowadays, the grap hics capabilitie s of the p ersona l computer system can generally support high quality animation applications. Effective human-computer interaction requires the presentation of information so that the eye a nd bra in can work together to see what the pre senter intends to be seen. The visual sensations reaching the eye are translated into perceptual experience by the brain through processes such as pattern recognition. Psychop hysici sts have long been interested in how the human visual perceptual system works. Their research efforts over the years have contributed to a much better understanding of the effects of luminance (Burns, Smith, Pokorny & Elsner, 1982), contra st (Patel, 1966; va n Nes & Bouman, 1967), flicker (Kelly, 196 1 ; Farre ll, Ca sson, Haynie & Benson, 1988), motion, colour. (Chri st, 197 5 , 1 984; Murch, 1984; Wa lraven, 1985; Davidoff, 1 987), disp lay size (Travis, 1990), a nd a nti-a lia s effects (Booth, Bryden, Cowan, Morga n & Pla nte, 1987; Hewitt, Kennedy & Scrivener, 1989). Huma n beings ma intain a strongly spatial view of their surroundings. This spatial view is adequately supported by our visual system; for the visually handicapped , the sense of space i s mediated by acou stic or tactile modalities. Visual communication at the huma n-comp uter interface ca n be broadly cla ssified into system s which are app lication sp ecific a nd those which are not. The latter category of i nterface s supports the general op era tion of the computing e nvironment a nd it is typically closely related to the dia logue style . The app lication specific interface s, on the other ha nd , are typ ically concerned with presenting information of interest to or requested by the u ser.. 2.3. Graphical User Interfaces The d evelopment of comp uter user i nterfaces ha s been closely linked to that of. the video disp lay u nit. In the early days of teletype systems and monochrome displays, user interfaces were invariably command-ba sed where user interaction with the machine took p lace at the keyboard. Interaction with these types of interfaces could sometimes be very fru strating eve n for exp erienced u sers. The availability of colour grap hics capabilities on the display screen, coupled with the advent of interactive devices such a s mice, joystick s a nd tablets, ha s shifted the focus from the keyboard t o the disp lay screen in the human-comp uter interface d esign. The p op ularity of personal computer systems ha s also influenced u ser i nterface d esign. Emp hasis has increa singly been focused on producing interfaces which are primarily targeted at novice u sers a nd a im to provide the u ser with a positive feeling of control a nd ma stery of the system. Shneiderman ( 1983) coined the term Direct Manip ula tion to describe systems which have visible interface.
(36) CHAPTER 2: A BRIEF REVIEW OF HCI AND GRAPHICAL PRESENTATION 2 1 objects and actions of interest, rapid reversible incremental actions and replacement of complex command language syntax by direct manipulation of the object of interest. The advent of Window, Icon, Menu and Pointing-device (WIMP) interfaces has evolved from the pioneer work at Xerox Palo Alto Research Centre on the Star system (Smith, Irby, Kimball & Verplank, 1982).. Nowadays, the desktop metaphor is. synonymous with WIMP-based and WYSIWYG (What You See Is What You Get). interfaces� The operation of a WIMP interface is clear and unambiguous, reducing the user's cognitive load and physical interaction with the keyboard. Objects (files and programs) within the system are hierarchically arranged and represented by icons in a window. A window may act as a parent to other windows ('children') which inherit the basic operational characteristics of their parents. All windows are situated on a desktop area which represents the display surface of the monitor. Several different windows may be open at a particular point in time, and windows may be moved, resized and closed. Objects may be activated by selecting with a pointing device, typically a mouse. The development of the Apple Macintosh system and the Microsoft Windows environment has contributed to the standardisation of user interfaces. Despite the large number of computer software applications available in the PC market, their visual appearances are becoming increasingly similar.. One advantage of this familiar. appearance is that each system's behaviour may be more predictable and hence encourage users to explore the functionalities of new software packages. Visual communication plays an important role in the interface design. Jacob et al (1993) observe that current technology has been stronger in the computer-to-user direction than user-to-computer, with the bandwidth from the computer to the user far greater than that from the user to the computer. The capacity for a high volume of data to be represented graphically, coupled with the human's perceptual capability in interpreting. information, has made the visual channel the ideal medium for communication from the computer to the user. In his research into multi-level statistical maps, DesJardins ( 1982). identifies three important aspects of graphic communication: speed, perception and comprehension.. He considers that the average human comprehension rate when. expressed in computer terms as bits per second would be 300bps for speech, 1000bps for text and, for pictorial representations, attain speeds of 10,000 to lOO,OOObps. McCormick, DeFanti & Brown (1 987) suggest that the gigabit bandwidth of the eye/visual cortex system permits much faster perception of geometric and spatial relationships than any other mode, making the power of supercomputers accessible. McCormick et al ( 1987) point out that an estimated 50% of the brain's neurons. are. associated with vision and that visualisation in scientific computing is to put that powerful neurological machinery to work..
(37) CHAPTER 2: A BRIEF REVIEW OF HCI AND GRAPIDCAL PRESENTATION 22 Marcus ( 1983) is of the view that visual communication between computers and people ta kes place in thr ee d iffer ent phases that represent the three "faces" of the computer : outerfaces, inter faces and innerfaces.. "Outerfaces are the d ispla ys of. information that are the final products of computation. Interfaces are the frames of command/control and documentation that computer system users encounter . Innerfaces are the fra mes of command/control and documentation that computer experts confront, specifically the builders and maintainers of computer systems." He argues that computer graphics should be exploited to support the design of each of these three faces.. Windows The desktop metaphor was introduced in the Star a nd Macintosh Lisa systems, and with it the popularity of WIMP interfaces increased. In windows systems, the user's screen is divided into a number of possibly overlapping rectangular areas, each of which handles a specific function or is itself a "virtual terminal". Windows allow the user to interact with more than one source of information at the same time. It is this plethora of contexts, coupled with the graphical nature of the displays and the use of interactive input devices, which give this typ e of interface its power . Card , Pavey and. Farrell (1984) classify windows systems into four major categories (1) the familiar TTY text windows, (2) time multiplexed windows, (3) space multiplexed windows a nd (4) non-homogeneous wind ows. Research interest in windows has been focused on the differences between systems based on the overlapping window paradigm a nd those based on the tiled window paradigm . As the complexity of the windows systems incr eases, windows mana gers are used to help the user monitor and control differ ent contexts b y separating them physically into different parts of one or more display screens. These windows managers are often implemented as part of a computer's operating systems. Indeed , the increasing popularity of windows has also attributed to the stand ardisation of the interfaces of windows mana ger systems such as the Microsoft Windows, the Macintosh, the X ,.. . ........ ·. Windows (Scheifler & Gettys, 1 986) and Motif. "This high level interface can also ma k e application code more portable from one machine to another, since the same window manager procedural interface can be provided on different machines." (Myers, 1988). Icons Despite its relatively short history, iconic interfacing is now widespread a nd it r e presents a fundamental aspect of the new generation of interfaces. Rogers (1989) suggests that, since we live in a strongly visual and spatially organised environment,.
(38) CHAPTER 2:. A BRIEF REVIEW OF HCI AND GRAPHICAL PRESENTATION 23. interfaces that also use visual spatial information are more conducive to learning. Lodding ( 1982), an early proponent of the use of icons at the interface, classifies them into three categories : representational, abstract and arbitrary. He further argues that icons can reduce the complexity of a system and hence make it easier to learn (Lodding,. 1983). This is achieved by giving an immediate impression to the user that the system is easy to use and in doing so has a positive effect on the first time user. There is quite a selection of guidelines from a variety of fields, ranging from graphics arts to computer science, available to the icons designers (Gittens, Winder & Bez, 1984; Gittens, 1 986; Marcus, 1 984; Marchant, 1985) Fairchild, Meredith & Wexeblat (1989) present a formal structure for describing icons and their relations to objects, and an extension which they called automatic icons. Icons are mappings from icon space, which deals with representational properties, to object space, which deals with computational objects. Automatic icons serve as icon generators, generating icons based on the properties of the object and the mapping between the object and the image. This provides the system designers with more power and flexibility in the construction. There appears to be quite consistent empirical evidence to support the use of icons at the user interface. Guastello, Traut & Korienek ( 1989) reported that mixed modality (textual and pictorial) metaphors are rated as more meaningful than icons that utilise verbal or pictorial elements only. In their experiment to compare the usability of menu items constructed of text alone, icons alone, and text and icons together, Kacmar and Carey (1991) also concluded that menus constructed of a mixed format (text and icons) result in smallest number of incorrect choices by users without any significant difference in the time they take to make a selection. In their study of videotex choice pages, Muter and Mayson (1986) reported that whilst icon-like graphics had no effect on the users' response time, their error rate in the graphics condition was half that measured in the text only condition. In his study of the m emorability of icons in an information retrieval task, Lansdale ( 1988) reports no exceptional levels of recall. He suggests, however, that icons may be useful in enhancing and supporting the search process by rapidly limiting the number of documents through which a user is asked to search. Lansdale, Simpson. & Stroud (1990) compared the use of words and icons as external memory aids in an information retrieval task. Their results indicated strongly that recall was higher when subjects made their own selection of enriching attributes as opposed to having them selected for them. When comparing words and icons, they found no evidence that the modalities of the enrichers were a significant factor in recall. Recall performance seems.
(39) CHAPTER 2:. A BRIEF REVIEW OF HCI AND GRAPHICAL PRESENTATION 24. to be primarily related to the 'semantic fit' of the documents and the attributes selected to enrich them. Variations and enhancements of conventional icons have been considered by a number of researchers. Henry & Hudson ( 1990) describe the multi-dimensional icons which appear as a cube on a two and a half dimensional display surface. These icons allow several different icons representing views of an object, but occupy a fraction of the screen space which would be required to display all the icons individually. Nielsen. (1990) considers the use of miniatures and suggests that the advantage of miniatures over icons is that they can be constructed automatically from the primary information to which they refer, whereas icons have to be designed manually by a graphic artist. He compares users' performance with miniatures and icons, but his results is not in favour of either. However, he recommends that the choice between miniatures and icons in a given user interface should be made on the basis of other design considerations. Everything else being equal, icons are preferred. Baecker, Small & Mander ( 199 1) propose a new generation of animated icons to represent complete applications or functions within an application. This type of icon serves to clarify. the meaning of each icon, de� onstrates its capabilities, and even. explains its method of use. Icons have proven to be an indispensable ingredient of a human-computer interface. It is envisaged that the next generation of animated icons will be augmented by an audio interface, providing a richer interaction experience for the user.. Menus In computer terminology, a menu is a list with a limited number of options, usually words or short phrases. Shneiderman ( 1986) argues that menu systems are attractive because they can eliminate training and memorisation of complex command sequences. Menu applications range from trivial choices between two items to complex videotex systems involving hundreds of thousands of screens. Based on functionality, menus can be classified into binary menus involving a choice of two items; multiple item menus; multiple selection menus, where more than one item may be selected; and extended menus, where sublists of menus are hierarchical layers.. arranged. in. Pop-up and pull-down menus which appear on the screen in. response to an activation of a pointing device are the most common types. There has been a good body of empirical studies evaluating user performance using various tree-structure menus (Miller, 198 1 ; Dray, Odgen & Vestewig, 198 1 ;.
(40) CHAPTER 2: A BRIEF REVIEW OF HCI AND GRAPHICAL PRESENTATION 25 Kiger, 1 984; Landauer & Nachbar, 1 985; Sisson, Parkinson & Snowberry, 1 986). Results tend to suggest a general preference for broad, shallow trees rather than deep, narro w ones. Norman & Chin ( 1 988) classify tree menus into constant, decreasing, increasing, convex and concave, based on the shape of the structure. They conclude that the concave menu is superior when the user is searching for scenario targets and the increasing menu is slightly superior for explicit targets. Pierce, Sisson & Parkinson ( 1992) propose a criterion model that accounts for variation in search strategies and. response accuracy in a computer menu search task. The model considers three factors: (1). the user perceived relationship among target items sought and menu alternatives available for selection;. (2). the number of alternatives available for selection; and. (3). the probability of an omission situation where the target item is not subsumed under any of the alternatives available for selection. Menu systems are an essential component of a modem graphical user interface.. They are often used in situations where pictorial representation of objects or functions are difficult or impossible.. Pointing devices. From an early age, infants interact with their surroundings and develop useful eye-hand coordination skills. This early training has prepared them to engage in increasingly complex physical activities. It is not surprising that designs of human computer interfaces have exploited such well-learned skills. Interactive input devices and visual displays must therefore be considered an integral part of the interface. Indeed, the use of interfaces incorporating icons, windows, and, to a lesser extent, menus would be inconvenient and possibly difficult without an effective pointing device such as a mouse. The basic functions required of pointing devices in a modern computing environment include pointing, selection, dragging and tracking.. 2.4. Graphical Presentation of Data In the context of visual communication, information display formats therefore. have a direct influence on this sense of space, which in turn affect our comprehension. The use of graphics has been studied by researchers in various fields and design guidelines on the effective use of charts, diagrams and graphical displays are available (Morse, 1979; Wainer, 1984; Kossyln, 1989; Gillan, 1993). There has also been a.
Figure
+7
Outline
A BRIEF REVIEW OF HCI AND GRAPIDCAL PRESENTATION 17 world that had already been developed for the Finder, adding user satisfaction of with
A BRIEF REVIEW OF HCI AND GRAPIDCAL PRESENTATION 22 Marcus ( 1983) is of the view that visual communication between computers and
3 2 Applying Bifocal Displays to Topological Maps
3 3 A Comparative Study of Graphical User Interfaces for Topological Maps
A TAXONOMY AND CONCEPIUAL MODEL Transfonnation
4 5 Discussion
5 4 Discussion
e for all o come to
6 2 Design Considerations
DESIGNING 1HE INFOLENS
Related documents
The characterization of breathing sound was carried by Voice Activity Detection (VAD) algorithm, which is used to measure the energy of the acoustic respiratory signal during
National Conference on Technical Vocational Education, Training and Skills Development: A Roadmap for Empowerment (Dec. 2008): Ministry of Human Resource Development, Department
Intervention effects with respect to ‘ PTA ’ , ‘ INFO ’ , ‘ SAFED ’ , clinical patient outcomes, and health-related quality of life were estimated using general- ised
The Quarterly financial statistics Survey covers a sample of private enterprises operating in the formal non-agricultural business sector of the South African economy. It
19% serve a county. Fourteen per cent of the centers provide service for adjoining states in addition to the states in which they are located; usually these adjoining states have
Assessing the Impact of Biodiversity Conservation in the Management of Maize Stalk Borer (Busseola f
Field experiments were conducted at Ebonyi State University Research Farm during 2009 and 2010 farming seasons to evaluate the effect of intercropping maize with
○ If BP elevated, think primary aldosteronism, Cushing’s, renal artery stenosis, ○ If BP normal, think hypomagnesemia, severe hypoK, Bartter’s, NaHCO3,
