R E S E A R C H A R T I C L E
Open Access
Bayesian modeling of spatiotemporal
patterns of TB-HIV co-infection risk in
Kenya
Verrah Otiende
1*, Thomas Achia
2and Henry Mwambi
2Abstract
Background:Tuberculosis (TB) and Human Immunodeficiency Virus (HIV) diseases are globally acknowledged as a
public health challenge that exhibits adverse bidirectional relations due to the co-epidemic overlap. To understand the co-infection burden we used the case notification data to generate spatiotemporal maps that described the distribution and exposure hypotheses for further epidemiologic investigations in areas with unusual case notification levels.
Methods:We analyzed the TB and TB-HIV case notification data from the Kenya national TB control program
aggregated for forty-seven counties over a seven-year period (2012–2018). Using spatiotemporal poisson regression models within the Integrated Nested Laplace Approach (INLA) paradygm, we modeled the risk of TB-HIV co-infection. Six competing models with varying space-time formulations were compared to determine the best fit model. We then assessed the geographic patterns and temporal trends of coinfection risk by mapping the posterior marginal from the best fit model.
Results:Of the total 608,312 TB case notifications, 194,129 were HIV infected. The proportion of TB-HIV co-infection was higher in females (39.7%) than in males (27.0%). A significant share of the co-co-infection was among adults aged 35 to 44 years (46.7%) and 45 to 54 years (42.1%). Based on the Bayesian Defiance Information (DIC) and the effective number of parameters (pD) comparisons, the spatiotemporal model allowing space-time interaction was the best in explaining the geographical variations in TB-HIV coinfection. The model results suggested that the risk of TB-HIV coinfection was influenced by infrastructure index (Relative risk (RR) = 5.75, Credible Interval (Cr.I) = (1.65, 19.89)) and gender ratio (RR = 5.81e−04, Cr. I = (1.06e−04, 3.18e−03). The lowest and highest temporal relative risks were in the years 2016 at 0.9 and 2012 at 1.07 respectively. The spatial pattern presented an increased co-infection risk in a number of counties. For the spatiotemporal interaction, only a few counties had a relative risk greater than 1 that varied in different years.
Conclusions:We identified elevated risk areas for TB/HIV co-infection and fluctuating temporal trends which could be because of improved TB case detection or surveillance bias caused by spatial heterogeneity in the co-infection dynamics. Focused interventions and continuous TB-HIV surveillance will ensure adequate resource allocation and significant reduction of HIV burden amongst TB patients.
Keywords:Bayesian modeling, TB-HIV co-infection, co-epidemic burden, Kenya
© The Author(s). 2019Open AccessThis article is distributed under the terms of the Creative Commons Attribution 4.0 International License (http://creativecommons.org/licenses/by/4.0/), which permits unrestricted use, distribution, and reproduction in any medium, provided you give appropriate credit to the original author(s) and the source, provide a link to the Creative Commons license, and indicate if changes were made. The Creative Commons Public Domain Dedication waiver (http://creativecommons.org/publicdomain/zero/1.0/) applies to the data made available in this article, unless otherwise stated. * Correspondence:otiende.verrah@students.jkuat.ac.ke;
verrahodhiambo@gmail.com
1Department of Mathematical Sciences, Pan African University Institute of
Background
Tuberculosis (TB) and Human Immunodeficiency Virus (HIV) diseases have a co-epidemic relation such that the chronic immune prompt arising from TB disease hastens HIV disease advancement [1, 2]. Both the TB and HIV pathogens interact collectively, accelerating the progress of illness thereby increasing the chances of death [3]. Globally, TB and HIV exhibit an adverse bidirectional interaction because of the co-epidemic overlap. The risk of TB infection developing into TB disease is between 16 and 27 times higher in HIV infected persons [4]. TB can occur both in the early stages and through all stages of HIV infection although the risk intensifies soon after in-fection with HIV [5].
Under the same degree of exposure, there exists no ir-refutable evidence that HIV positive persons are more likely to acquire TB infection than HIV negative persons [6]. However, the risk of rapid progression once TB in-fection occurs is greater among persons living with HIV infection [7,8]. The lifetime risk for HIV negative indi-viduals to develop active TB from latent TB is about 5 to 10%, whereas, for persons living with HIV, the same percentage holds but annually opposed to a lifetime [9]. Studies by [10] and [11] in various outbreak settings confirm that HIV co-infection does intensify the pro-gression of latent TB to active TB disease. The diagnosis of TB in the HIV epidemic remains extremely challen-ging because of the difficulty in differentiating between reactivation and recent infections [12]. The risk of infec-tion or reinfecinfec-tion is dependent on the source case num-bers in various congregate settings including households and health-care facilities [5].
The disparity for TB infections between persons with and without HIV infection remains a global concern es-pecially because of the high incidence rate among HIV infected persons [13]. A study by [14] observed that the prevalence of HIV infections for persons reporting prior TB disease was 33.2% compared to 5.1% in persons with-out prior TB. Another study by [13] confirmed that TB disease incidence among HIV infected persons was still eight times higher than in persons without HIV. In the year 2015, the global estimation of TB disease was 10.4 million of which 11% were HIV positive [15]. Approxi-mately 60% of the TB/HIV co-infected patients received neither diagnosis nor treatment leading to 390,000 TB related deaths [16].
Globally, sub-Saharan Africa accounts for the largest percentage of the dual epidemic with co-morbidity from TB-HIV remaining a critical public health challenge [14]. In essence, more people die from TB than HIV as-sociated infections [17]. In 2016 alone, the SSA region accounted for an estimated 86% of HIV-linked TB deaths [18]. Kenya is one of the countries in SSA se-verely hit by the dual epidemic and appears among the
WHO high TB and TB-HIV burden countries ranking 13 out of the 22 countries globally [19, 20]. The impact of TB-HIV co-infection in Kenya is evident mainly be-cause of the complications in diagnosis and manage-ment. Equally, the HIV surveillance on TB patients and the TB surveillance on HIV patients in Kenya relies pri-marily on the self-reported cases from health facilities as a surrogate measure of the actual co-endemic. The two surveillance systems are not integrated making it a chal-lenge to profile the actual co-infection burden. There-fore, the feasibility of using case notifications instead of population-based studies to capture the valid spatiotem-poral infection incidence estimates of the co-epidemic is unknown.
Against this background, we investigate the geograph-ical variation and co-infection burden using the case no-tification data for a 7-year period and characterize the areas with unusually high relative risks. We utilize the space-time disease mapping models which allow for the concurrent study of persistent and unusual co-infection trends, thus offering additional benefits over purely spatial disease mapping models [21, 22]. These model-maps describe new exposure hypotheses that warrant further epidemiologic investigations in areas with un-usual case notification levels and ultimately inform rele-vant geographically based interventions and resource allocation towards suppressing further infections.
Methods Data sources
We conducted this study through extensive analysis of TB case notification data from the Kenya national TB control program database. The database is an elaborate and robust surveillance system that captures case notifi-cation data from the health facilities in every county and updates the records on the national grid. For the process of data capture into the surveillance system, the National TB program adapted both the recording and reporting tools from WHO. The WHO recommends systematic screening for HIV among TB patients; our dataset cap-tures the HIV status of all the TB case notifications. We analyze the data aggregated at the county level.
Model description
For the county s in the year t, we modeled the TB-HIV cases notification ystas
ystPoissonð Þλst
We assumed our count data follows the Poisson distri-bution where the log of the relative risks was the focus
of modeling. We defined the mean λst in terms of the
We defined the population at risk of TB-HIV co-infection are the TB cases. We computed the expected counts of co-infection cases Est per county per year.
These counts represent the number of cases one would expect if the population of county s has similar behavior to the standard population. Our statistical consideration for the standard population N was the average of the pooled TB cases, that is, N¼PY, where P is the total number of TB cases at risk of co-infection and Y is the number of years, which is seven for this study. We
cal-culated the crude rate as Rst¼
P
Xst
Pst where∑Xstand Pst are the number of co-infection cases and the number of TB cases in county s, year t respectively. We then multi-plied the crude rate by the standard population to obtain the expected number of co-infection cases
Est¼RstN
We expressed the linear predictor on the logarithmic scale,ηst= log(ρst) which is the recommended invertible
link function for the Poisson family of distributions. We compared the spatiotemporal disease models discussed by [23]. The models differed in their formulation of the space-time structure and the inclusion or not of the co-variates. Model 1a applied the classical parametric
for-mulation of [24] on the linear predictor, which we
expressed as
ηst¼αþυsþνsþðρþδsÞ Zt ð1aÞ
The formulation included the spatially structured (υs)
and unstructured (νs) random effects, the global linear
time trend effect (ρ× Zt). The term δs× Zt is the
inter-action term between space and time defining the difference betweenρand the area-specific time trend. It is referred to as the differential trend of the stharea [23, 24]. The term Ztis a vector of temporal weights and the
interceptαquantifies the average co-infection rate in all the 47 counties. Each spatial unit has its own time trend with a spatial intercept (α+υs+νs) and a slope (ρ+δs).
This model assumes a linear time trend in each spatial unit. We estimated the parameters θ= {α,ρ,ν,υ,δ} and the hyper-parametersψ= {τν,τυ,τδ}.
The model 1b included the covariates to the model 1a thereby estimating θ= {α,β,ρ,ν,υ,δ} and ψ= {τν,τυ,τδ}. The model expression was
ηst¼αþ X
βixiþυsþνsþðρþδsÞ Zt ð1bÞ
The model 2a used the dynamic non-parametric for-mulation on the linear predictor
ηst¼αþυsþνsþγtþϕt ð2aÞ
The terms α, υs and νs are similar to the formulation
in the first model, additionally, the terms γt and ϕt
represents the temporally structured and unstructured random effect respectively. The model assumes a non-parametric time trend. In this formulation,θ= {α,ν,υ,γ,
ϕ} andψ= {τν,τυ,τγ,τϕ}.
The model 2b incorporated the covariates to the model 2a to estimate θ= {α,β,ν,υ,γ,ϕ} and ψ= {τν,τυ,
τγ,τϕ}. We expressed model 2b as
ηst ¼αþ X
βixiþυsþνsþγtþϕt ð2bÞ
Our model 3a expanded the model 2a by allowing a space-time interaction to explain for the difference in the time trend of TB-HIV coinfection for the diverse counties.
ηst ¼αþυsþνsþγtþϕtþδst ð3aÞ
For this model,θ= {α,ν,υ,γ,ϕ,δ} andψ= {τν,τυ,τγ,τϕ,
τδ}. We defined δst as the interaction betweenνsand ϕt
consequently assuming no interaction betweenυsand γt
thereforeδst~N(0,τδ).
The final model 3b incorporated the covariates to the model 3a to estimateθ= {α,β,ν,υ,γ,ϕ,δ} andψ= {τν,τυ,
τγ,τϕ,τδ}. We formulated the model as
ηst ¼αþ X
βixiþυsþνsþγtþϕtþδst ð3bÞ
To assess the performance of these six models, we used the DIC taking into consideration the complexity of the models. We selected the model with the lowest DIC as the best-fit model.
Baseline predictor variables
The set of baseline predictors were poverty index, infra-structure index, health index, education index, gender ratio, dependency ratio, and Gini coefficient. These pre-dictors are standard indices used to establish the com-parative level of development of different counties in Kenya. The computation of these indices is further elab-orated in the reports from [25] and [26]. All these pre-dictor variables were fitted in the models 1b, 2b and 3b but only the significant ones were considered in the discussion.
gives an indication of the burden of the working popula-tion and government to support the non-working popu-lation who are either too young or too old. The Gini coefficient compares the distribution of income in the entire population of any given county. It is based on the Lorenz curve and varies between 0 (complete equality) and 1 (complete inequality).
Statistical analysis
For the demographic characterization of the case notifi-cations, we compared the summaries of TB cases with and without HIV infections. We stratified the data based on HIV status and performed the chi-square test to de-termine the association between HIV status and each of the demographic variables TB-type, age, gender, and pa-tient type. All the p-values were two-tailed with values less than 0.05 considered being statistically significant. The TB type classification was either pulmonary TB or extra-pulmonary TB. Pulmonary TB referring to a pa-tient with TB disease involving the lung parenchyma whereas the extra-pulmonary TB involves any organ other than the lungs. For the patient type, we had five categories; the first was the default category for patients who defaulted the TB therapy then experienced recur-rence. The second was the failed category for patients previously diagnosed with TB but never took on the therapy. The third category was for newly diagnosed pa-tients without previous TB diagnosis or therapy. The re-lapse case was the fourth category whereby patients were previously diagnosed, treated of TB and completed the TB therapy but experienced a recurrence. The fifth and final category was the cases transferred in from other health facilities to continue with the therapy.
Using the Integrated Nested Laplace Approach
(INLA), we fitted the case notification data to our spa-tiotemporal disease models to determine the best fit. We assessed the nature of the response variables on our baseline predictors. We specified the Besag-York-Mollie (BYM) prior onυsusing the intrinsic conditional
autore-gressive structure (iCAR). Thus υsij υsi≠sjNð
P
jϵNðsÞυs j #NðsÞ
; σ2υ
#NðsÞÞ where #N(s) is the number of neighbors sharing
boundaries with the county si. The BYM model allows
us to capture both the heterogeneity (variability) and clustering of disease risk simultaneously. We then used the exchangeable prior on νs, that is νsNð0;σ2νÞ. We
modeled γt using a random walk specified through the
temporal adjacency structure, which is analogous to the spatially structured random effects specification as it borrows strength from adjacent time periods. The
tem-porally unstructured random effect ϕt was modeled
using the Gaussian exchangeable prior ϕt~N(0,τϕ). We defined improper priors for the intercept and regression
coefficients of the fixed effects as α~N(0, 0) andβ~N(0, 0.001) respectively. For the distribution of the hyper-parameters, we assumed the default specifications of INLA whereby we assigned minimally informative priors on the log of the precision of both the structured and unstructured effectsψ~(1,0.0005).
Results
Demographic characterization of TB-HIV case notification in Kenya, 2012–2018
Of the total 608,312 TB case notification for the period 2012–2018 included in the study, 194,129 cases were HIV co-infected, 391,030 cases were HIV uninfected and 23, 153 cases were unaware of their HIV status because either the HIV test was not done or they declined to be tested. The demographic characteristics of TB patients stratified by HIV status are in Table1. The TB case notification de-creased from 99,586 (16.4%) in 2012 to 78,318 (12.6%) in 2016 but increased to 85,886 (14.1%) in 2017 and 83,324 (13.7%) in 2018. Similarly, the co-infection cases decreased from 36,135 (36.3%) in 2012 to 21,896 (26.3%) in 2018. The chi-square test showed that HIV status was positively associated with age, time of case notification, type of TB, gender and TB patient type (p-value < 0.01).
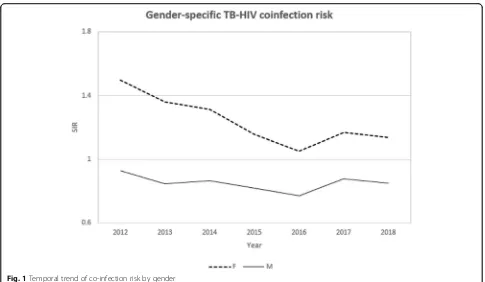
The male TB case notification exceeded the female but the proportion of TB-HIV co-infection was higher in female cases (39.7%) as compared to male cases (27.0%). The tem-poral trend of co-infection risk was consistently higher in women (Fig.1) whereas the spatial pattern was widespread in males compared to the female. The counties with a high co-infection burden for both males and females were Homa-bay, Siaya, Kisumu, Migori and Busia counties (Fig.2). A sig-nificant share of the co-infection was among adults between the ages of 35 to 44 years (46.7%) and 45 to 54 years (42.1%). Patients aged below 25 years and above 54 years registered a considerably lower co-infection risk over time (Fig.3). The spatial patterns based on age-categories showed a wide-spread co-infection risk pattern for the ages 25–34 followed by 35–44 years (Fig.4). These age categories and generally the most sexually active age ranges, which puts them at a higher risk of co-infection.
The proportion of extra-pulmonary TB cases co-infected with HIV (35.6%) also surpassed that of pulmon-ary TB (31.2%). Looking at the patient types, the 194,129 TB-HIV co-infection cases were composed of 171,115 (31.0%) new TB infections, 17,174 (42.9%) TB relapse cases, 457 (29.5%) TB therapy failure cases, 3336 (37.5%) defaulted cases and 2047 (30.9%) transferred in cases.
Model comparison
and the mean deviance (Ď). We compared the spatio-temporal disease models discussed by [23], which dif-fered in their formulation of the space-time structure and the inclusion or not of the fixed effects. The values of pD penalize the complexity of the model and smaller values indicate a parsimonious model. For Poisson likeli-hoods, the pD should be approximately equal to the number of observations [27]; that is 47 × 7 = 329. Model 1a has a smaller pD than the number of observations and the biggest DIC, indicating a clear lack of fit. Both criteria thus point to the model 3f being the best fitting model. In this model, the infrastructure index (RR =
5.75, Cr. I = (1.65, 19.89)) and gender ratio (RR =
5.81e−04, Cr. I = (1.06e−04, 3.18e−03)) were significantly as-sociated with TB-HIV co-infection. In the remaining sections, we focus on presenting the results on the model 3b.
Temporal characteristics of TB-HIV co-infection epidemics The temporal trend in TB-HIV co-infection relative risks from 2012 to 2018 is in Fig. 5. The co-infection risk trend shows an initial steady decrease between 2012 and 2016 then a sharp increase in 2017 that slightly de-creases in 2018. The lowest risk of 0.9 was in the year 2016 while the highest risk of 1.07 was in the year 2012.
Spatial patterns of TB-HIV co-infection epidemic
The spatial map in Fig. 6 and the relative risk plot in
Fig. 7 present the cumulative predicted values of
[image:5.595.57.537.98.506.2]TB-HIV co-infection risk over a 7-year period (2012–2018) per county. There were 12 counties out of the 47 with high co-infection risk evidenced by values greater than 1. Most of these high-risk counties were towards the fur-ther west of Kenya; Homabay County was leading followed by Siaya, Kisumu, Migori and Busia counties.
Table 1Demographic characterization of TB patients with and without HIV in Kenya (2012–2018)
All [n (%)] HIV uninfected [n (%)] HIV co-infected [n (%)] HIV unknown [n (%)] χ2(df,p-value)
Year 6112.3 (12, < 0.01)
2012 99,586 (16.4) 58,967 (59.2) 36,135 (36.3) 4484 (4.5)
2013 90,674 (14.9) 53,562 (59.1) 32,099 (35.4) 5013 (5.5)
2014 90,123 (14.8) 55,593 (61.7) 30,472 (33.8) 4058 (4.5)
2015 82,401 (13.5) 53,617 (65.1) 26,616 (32.3) 2168 (2.6)
2016 78,318 (12.9) 50,393 (64.3) 23,051 (29.4) 2874 (3.7)
2017 85,886 (14.1) 59,535 (69.3) 23,860 (27.8) 2491 (2.9)
2018 83,324 (13.7) 59,363 (71.2) 21,896 (26.3) 2065 (2.5)
TB Type 1422.1 (2, < 0.01)
Extra-pulmonary TB 102,072 (16.8) 60,643 (59.4) 36,344 (35.6) 5085 (5.0)
Pulmonary TB 506,240 (83.2) 330,387 (65.3) 157,785 (31.2) 18,068 (3.6)
Age Category 38,896 (12, < 0.01)
< 15 57,591 (9.5) 40,813 (70.9) 13,327 (23.1) 3451 (6.0)
15–24 108,104 (17.8) 87,171 (80.6) 16,438 (15.2) 4495 (4.2)
25–34 172,114 (28.3) 106,384 (61.8) 60,046 (34.9) 5682 (3.3)
35–44 130,106 (21.4) 65,507 (50.3) 60,808 (46.7) 3791 (2.9)
45–54 71,743 (11.8) 38,889 (54.2) 30,229 (42.1) 2615 (3.6)
55+ 68,656 (11.3) 52,256 (76.1) 13,281 (19.3) 3119 (4.5)
Gender 10,796 (2, < 0.01)
Female (F) 233,903 (38.45) 132,494 (56.6) 92,970 (39.7) 8439 (3.6)
Male (M) 374,409 (61.5) 258,536 (69.1) 101,159 (27.0) 14,714 (3.9)
Patient Type 2681.4 (8, < 0.01)
Default (D) 8889 (1.5) 5335 (60.0) 3336 (37.5) 218 (2.5)
Failed (F) 1547 (0.3) 1068 (69.0) 457 (29.5) 22 (1.4)
New (N) 551,231 (90.6) 358,430 (65.0) 171,115 (31.0) 21,686 (3.9)
Relapse (R) 40,020 (6.6) 21,862 (54.6) 17,174 (42.9) 984 (2.5)
Transferred In (TI) 6625 (1.1) 4335 (65.4) 2047 (30.9) 243 (3.7)
Figure8a shows the spatial pattern of the posterior mean for the country-specific relative risk ðζs¼eðξs¼υsþνsÞ) of TB-HIV co-infection compared to the whole of Kenya while Fig.8b presents the measure of uncertainty associated with the posterior meansζs: P(ζs> 1| y). It is evident that there is
an increased co-infection risk in a number of counties char-acterized by a spatial relative risk above one and a posterior probability of the relative risk above 0.8 indicating a high level of associated certainty.
Spatiotemporal trends of TB-HIV co-infection epidemics The probability maps for the space-time interaction relative risk estimates greater than one, Pðeδst>1jyÞ, for the 7 years are in Fig.9. These are the exceedance probabilities useful for assessing the unusual elevation of coinfection risk over the 7-year period of study. Only a few counties had a probability of the relative risk being greater than 1 and they varied in different years.
Fig. 1Temporal trend of co-infection risk by gender
[image:6.595.56.541.85.367.2] [image:6.595.57.547.536.717.2]Discussion
The surveillance data from the National TB program gives deep insights into the TB-HIV co-epidemic. This study established that 96% of the TB case notifications had documented HIV test results, which is greater than the WHO’s global estimate of 64% in 2017 and that of the African region (86%) [28]. The significant upturn in
the HIV screening practices for every TB case notifica-tion in Kenya could be attributed to the commitment from the National TB program and the health profes-sionals in communication and social mobilization for early diagnosis and therapy uptake. Similar observations were reported in Ghana [29] and Ethiopia [30]. Globally, Kenya registered an 8% TB decline rate per year from
Fig. 3Temporal trend of co-infection by age-category
[image:7.595.58.541.88.392.2] [image:7.595.58.541.538.721.2]Table 2Posterior estimates and their 95% credible intervals (CI) for the random effects models
Variables 1a (95% Cr. I) 2a (95% Cr. I) 3a (95% Cr. I)
Fixed effects:
(Intercept) 0.91 (0.73, 1.13) 0.74 (0.60, 0.91)* 0.74
(0.61, 0.90)*
Year 0.94 (0.92, 0.97)* – –
Random effects
Spatial
Structured (τυ) 4.64e02(1.37e01, 3.95e03) 4.34e02(1.33e01, 3.75e03) 3.29e03 (6.66e02, 1.09e04)
Unstructured (τν) 1.96 (1.27, 2.89) 1.95 (1.27, 2.90) 2.24 (1.44, 3.31)
Temporal
Structured (τγ) – 2.07e02(6.68e01, 5.28e02) 1.02e04(7.23e02, 5.91e04)
Unstructured (τϕ) – 1.21e04(9.45e02, 6.51e04) 5.65e02(1.48e02, 2.08e03)
Spatiotemporal
Interaction (τδ) 3.48e03(1.05e03, 9.48e03) – 6.64e01(5.40 e01, 8.15e01)
DIC 5163.47 5163.31 3100.82
pD 55.40 55.40 268.34
Md (Ď) 5108.07 5107.91 2832.49
Table 3Posterior estimates and their 95% credible intervals (CI) for the random effects models with covariates
Variables 1b (95% Cr. I) 2b (95% Cr. I) 3b (95% Cr. I)
Fixed effects:
(Intercept) 2.81e02(9.49, 8.35e03)a 2.28e02(7.69, 6.77e03)a 2.02e02(7.54, 5.43e03)a
Year 0.94 (0.92, 0.97)a – –
Poverty 3.49 (0.96, 16.95) 3.49 (0.72, 16.95) 3.74 (0.81, 17.46)
Infrastructure 4.90 (1.40, 17.29)a 4.90 (1.40, 17.29) 5.75 (1.65, 19.89)a
Health 2.56 (0.56, 11.59) 2.56 (0.56, 11.59) 1.99 (0.44, 8.94)`
Education 0.36 (0.07, 1.86) 0.36 (0.07, 0.53)a 0.40 (0.08, 1.99)
Gender 4.71e−04(8.36e−05, 2.63e−03)a 4.67e−04(8.36e−05, 2.63e−03)a 5.81e−04(1.06e−04, 3.18e−03)a
Dependency 0.94 (0.33, 2.69) 0.94 (0.32, 2.69) 1.01 (0.36, 2.83)
Gini 1.15 (0.21, 6.23) 1.15 (0.21, 6.23) 0.79 (0.14, 4.35)
Random effects
Spatial
Structured (τυ) 4.75e02(1.63e01, 3.91e03) 4.89e02(1.63e01, 4.00e03) 3.22e03(6.70e02, 1.09e04)
Unstructured (τν) 8.30 (5.21, 1.27e01) 8.30 (5.21, 1.77e01) 8.96 (5.55, 1.39e01)
Temporal
Structured (τγ) – 2.06e02(6.71e01, 5.31e02) 1.08e04(7.24e03, 5.95e04)
Unstructured (τϕ) – 1.18e04(9.45e02, 6.42e04) 5.57e02(1.46e02, 2.02e03)
Spatiotemporal
Interaction (τδ) 3.50e03(1.04e03, 9.47e03) – 6.63e01(5.39e01, 8.14e01)
DIC 5162.85 5162.69 3100.07
pD 55.18 55.19 268.09
Md (Ď) 5107.66 5107.50 2831.98
a
[image:8.595.58.541.402.727.2]2013 to 2017 amongst other high TB burden countries including the Russian Federation (13%), Ethiopia (12%), Sierra Leone (10%) and Viet Nam at 8% [28].
Our findings on the number of TB case notifications per year for the period 2012 to 2018 showed a steady
reduction for the period 2012–2016 then a significant rise in 2017 and a slow decrease in 2018. The temporal trend of the coinfection relative risk for the entire country followed a similar pattern as the TB case notifications. From 2012 to 2016, there was a clear downward relative risk
Fig. 5Temporal trend of co-infection risk in Kenya
[image:9.595.56.540.87.303.2] [image:9.595.58.542.404.714.2]trend then a steep upward risk for the year 2017–2018. This could be because of either improvement in TB cases detec-tion or surveillance biases due to spatial heterogeneity in the co-infection dynamics, an observation that is in accord with the conclusions of [31]. To maintain the consistent TB de-cline rates, supplementary efforts to support TB-HIV collab-orative activities towards reducing the burden of HIV in TB patients are critical.
The co-infection cases were higher in patients aged be-tween 35 and 54 years with new cases of TB infection.
Similarly, the co-infection risk was higher for the same age bracket, which implied that co-infection was more common in the sexually active age group. These findings were contrary to the findings by [32] and [29] who ob-served that high rates of TB-HIV co-infections were in younger patients (< 15 years of age) but consistent with several other studies [30,33–36]. The study also revealed that a larger proportion of the HIV co-infected cases had extra-pulmonary TB conforming to [37] and [34] who found that the risk of extra-pulmonary TB was higher in
Fig. 7Relative risk plot (2012–2018)
[image:10.595.56.539.89.371.2] [image:10.595.59.540.536.715.2]HIV co-infected cases majorly because of delayed diagno-sis especially for the sputum smear-negative.
In our study, the male TB cases significantly exceeded female cases. However, the risk of co-infection was con-sistently higher in females than in males for the period 2012–2018. The findings conform to a number of stud-ies showing that females bear a disproportionate burden of TB-HIV co-infection in SSA [14, 38–41]. The larger TB case notification among the male could be because of the barriers the female encounter in seeking care for and diagnosis of TB or could reflect more complete registration for treatment by the male [42]. In other studies, by [34], the prevalence of co-infection was much higher among males in most countries in Sub-Saharan Africa whereas in all other countries there was no sig-nificant difference in the gender ratio. However, the case notification data alone are insufficient to determine whether the gender ratio reflects an excess in the co-infection burden among men or a disadvantage among women in seeking and accessing TB care.
Having proper infrastructure in place is the foundation for planning, delivering and evaluating public health services. The country infrastructure ranking in [26] showed counties with infrastructure index below the national average of 0.41 were classified as the most marginalized. In our study, it was evident that counties in the western region of Kenya, that is Homabay, Siaya, Kisumu, Migori, Busia, and Vihiga, have unresolved co-infection dynamics that is echoed by their in-frastructure index. Their patterns of co-infection also
reinforced the fact that counties with high HIV prevalence also post high TB disease burden [43,44] with exception of a few like Wajir, Lamu, Isiolo and West Pokot that have lower HIV incidence rate but high TB burden. We attribute these exceptions to unsuccessful treatment critical to arrest-ing TB re-infection and new infections. In terms of competi-tive exclusion, TB can exist in places where HIV is of low incidence.
Although TB disproportionately affects persons living with HIV, most of the transmission is by persons with-out HIV, who typically remain transmissible for a longer period. Since delayed diagnosis influences, the prolonga-tion of infectiousness and effective treatment rapidly at-tenuates infectiousness [45, 46], initiatives to reduce TB incidence in the general population can help prevent new infections among persons living with HIV.
The primary limitation of the study is using case noti-fication data as a surrogate measure of the general popu-lation at risk. Case notifications are data from specific subpopulations who seek treatment and care from health facilities; these are geographically representative of nearby populations. Whereas this kind of data is not completely spatially random for the co-epidemic burden, it still captures the spatiotemporal patterns of incidence risk, which is the ultimate goal of this study.
Conclusion
We identified elevated risk areas for TB/HIV co-infection and fluctuating temporal trends which could
[image:11.595.59.541.88.360.2]be a result of improved TB case detection or surveillance bias caused by spatial heterogeneity in the co-infection dynamics. The elevated risk areas indicated the need for focused interventions and continuous TB-HIV surveil-lance. Our study also demonstrated the potential utility of case notification data in providing robust estimates for the broad spatiotemporal structure of the TB-HIV co-epidemic. The findings showed that the high burden counties for TB-HIV co-infection were consistent with findings from previous work done on high burden coun-ties for HIV. This suggested that the TB-HIV co-epidemic in Kenya is still at a critical point portending a dual endemic challenge for many years to come. Much as HIV is a serious challenge in the management of TB, the national response to TB-HIV co-infection promotes HIV testing among TB patients as a strategy to reduce TB transmission. However, the government of Kenya needs to combine surveillance systems for the TB and HIV National programs to optimize the TB-HIV cofection case notification processes at all levels. With in-tegrated case notification systems at the health facility levels, there will be complete data capture on co-infection incidences and outcomes. Integration of care for both TB and HIV using a single facility and single health provider in each county will enable proper moni-toring of the co-infection trends, which will guide policy decisions on access to health care and relevant public health interventions. This will also ensure adequate source allocation to cause a significant impact on the re-duction of HIV burden amongst TB patients and TB burden amongst HIV patients.
Abbreviations
BYM:Besag-York-Mollie; CI: Confidence Interval;Ď: Mean deviance; DIC: Deviance Information Criterion; FEM: Fixed Effects Model; HIV: Human Immunodeficiency Virus; iCAR: intrinsic Conditional Autoregressive Model; INLA: Integrated Nested Laplace Approach; NLTP: National Tuberculosis, Leprosy and Lung Disease Program; pD: effective number of parameters; RR: Relative Risk; TB: Tuberculosis
Acknowledgments
The authors sincerely thank the National Tuberculosis, Leprosy and Lung Cancer Program (NLTP) for providing the data used in this study. The authors acknowledge the help of Prof Gabriel Magoma for commenting on earlier drafts of the manuscript.
Authors’contributions
VO conceived, designed the study and wrote the first draft of the manuscript. VO and TO analyzed data. HM contributed to data analysis. All authors contributed to reviewing literature, interpretation of the results and writing of the manuscript. All authors read and approved the final manuscript.
Funding
The authors would like to thank the African Union and Pan African University Institute of Basic Sciences Technology and Innovation (PAUISTI) for funding the study through VO’s Ph.D. work. The funders had no role in study design, data collection and analysis, interpretation of results, decision to publish, or preparation of the manuscript.
Availability of data and materials
The datasets used and/ or analyzed during the current study are available from the corresponding author on reasonable request.
Ethics approval and consent to participate
This study used data with all participant identifiers removed. Ethical permission for use of the data in the present study was obtained from National Tuberculosis, Leprosy and Lung Disease Program (NLTP) - Kenya.
Consent for publication Not applicable.
Competing interests
The authors declare that they have no competing interests.
Author details
1
Department of Mathematical Sciences, Pan African University Institute of Basic Sciences Technology and Innovation, Nairobi, Kenya.2School of
Mathematics, Statistics & Computer Science, University of KwaZulu-Natal, Pietermaritzburg, South Africa.
Received: 25 April 2019 Accepted: 9 October 2019
References
1. Kumar A, Kumar AMV, Gupta D, Kanchar A, Mohammed S, Srinath S, et al.
Global guidelines for treatment of tuberculosis among persons living with HIV: unresolved issues. Int J Tuberc Lung Dis. 2012;16(5):573–8 Available from:http://www.ncbi.nlm.nih.gov/pubmed/22507931.
2. Khan FA, Minion J, Pai M, Royce S, Burman W, Harries AD, et al. Treatment of active tuberculosis in HIV-coinfected patients: a systematic review and meta-analysis. Clin Infect Dis. 2010;50(9):1288–99 Available from:http:// www.ncbi.nlm.nih.gov/pubmed/20353364.
3. Mayer KH, Hamilton CD. Synergistic pandemics: confronting the global HIV and Tuberculosis epidemics. Clin Infect Dis. 2010;50(s3):S67–70 Available from:https://academic.oup.com/cid/article-lookup/doi/10.1086/651475. 4. WHO. Global Tuberculosis Report. 2016. Geneva: World Health Organization;
2016. p. 214.
5. Nkhoma K, Ahmed A, Ali Z, Gikaara N, Sherr L, Harding R. Does being on TB treatment predict a higher burden of problems and concerns among HIV outpatients in Kenya? a cross-sectional self-report study. AIDS Care. 2018;30(sup2):28–32 Available from:
https://www.tandfonline.com/doi/full/10.1080/09540121.2018.1469726.
6. Whalen CC, Zalwango S, Chiunda A, Malone L, Eisenach K, Joloba M, et al. Secondary attack rate of tuberculosis in urban households in Kampala, Uganda. PLoS One. 2011;6(2):e16137 Available from:http://www.ncbi.nlm. nih.gov/pubmed/21339819.
7. Dheda K, Shean K, Zumla A, Badri M, Streicher EM, Page-Shipp L, et al. Early treatment outcomes and HIV status of patients with extensively drug-resistant tuberculosis in South Africa: a retrospective cohort study. Lancet. 2010;375(9728): 1798–807 Available from:http://www.ncbi.nlm.nih.gov/pubmed/20488525. 8. Patel NR, Swan K, Li X, Tachado SD, Koziel H. Impaired M.
tuberculosis-mediated apoptosis in alveolar macrophages from HIV+ persons: potential role of IL-10 and BCL-3. J Leukoc Biol. 2009;86(1):53–60 Available from:
http://www.ncbi.nlm.nih.gov/pubmed/19383626.
9. Bell LCK, Noursadeghi M. Pathogenesis of HIV-1 and mycobacterium
tuberculosis co-infection. Nat Rev Microbiol. 2017;16(2):80–90 Available from:http://www.nature.com/doifinder/10.1038/nrmicro.2017.128. 10. Van-Rie A, Westreich D, Sanne I. Tuberculosis in patients receiving
antiretroviral treatment: incidence, risk factors, and prevention strategies. J Acquir Immune Defic Syndr. 2011;56(4):349–55 Available from:http://www. ncbi.nlm.nih.gov/pubmed/20926954.
11. Gupta A, Wood R, Kaplan R, Bekker L-G, Lawn SD. Tuberculosis incidence rates during 8 years of follow-up of an antiretroviral treatment cohort in South Africa: comparison with rates in the community. PLoS One. 2012;7(3): e34156 Available from:http://www.ncbi.nlm.nih.gov/pubmed/22479548. 12. Winter JR, Adamu AL, Gupta RK, Stagg HR, Delpech V, Abubakar I. Tuberculosis
infection and disease in people living with HIV in countries with low tuberculosis incidence. Int J Tuberc Lung Dis. 2018;22(7):713–22 Available from:
http://www.ingentaconnect.com/content/10.5588/ijtld.17.0672. 13. Yuen CM, Weyenga HO, Kim AA, Malika T, Muttai H, Katana A, et al.
HIV and adults without HIV--Kenya, 1998-2012. PLoS One. 2014;9(6):e99880 Available from:http://www.ncbi.nlm.nih.gov/pubmed/24937804. 14. Mbithi A, Gichangi A, Kim AA, Katana A, Weyenga H, Williamson J, et al.
Tuberculosis and HIV at the national level in Kenya: results from the second Kenya AIDS Indicator survey. J Acquir Immune Defic Syndr. 2014;66(Suppl. 1):S106–15 Available from:http://www.ncbi.nlm.nih.gov/pubmed/24732814. 15. WHO. Global tuberculosis report. 2015. 20th ed. Geneva: World Health
Organization; 2015. p. 192. Available from:http://www.who.int/iris/handle/1 0665/191102.
16. Trinh QM, Nguyen HL, Nguyen VN, Nguyen TVA, Sintchenko V, Marais BJ. Tuberculosis and HIV co-infection-focus on the Asia-Pacific region. Int J Infect Dis. 2015;32:170–8 Available from:http://www.ncbi.nlm.nih.gov/pubmed/25809776. 17. Lin W-C, Lin H-H, Lee SS-J, Sy C-L, Wu K-S, Chen J-K, et al. Prevalence of latent
tuberculosis infection in persons with and without human immunodeficiency virus infection using two interferon-gamma release assays and tuberculin skin test in a low human immunodeficiency virus prevalence, intermediate tuberculosis-b. J Microbiol Immunol Infect. 2016;49(5):729–36 Available from:https://linkinghub. elsevier.com/retrieve/pii/S1684118214001790.
18. Karo B, Krause G, Hollo V, van der Werf MJ, Castell S, Hamouda O, et al. Impact of HIV infection on treatment outcome of tuberculosis in Europe. AIDS. 2016;30(7):1089–98 Available from:http://content.wkhealth.com/ linkback/openurl?sid=WKPTLP:landingpage&an=00002030-201604240-00012. 19. Onyango DO, Yuen CM, Cain KP, Ngari F, Masini EO, Borgdorff MW.
Reduction of HIV-associated excess mortality by antiretroviral treatment among tuberculosis patients in Kenya. PLoS One. 2017;12(11):e0188235 Available from:http://dx.plos.org/10.1371/journal.pone.0188235.
20. Onyango DO, Yuen CM, Masini E, Borgdorff MW. Epidemiology of pediatric
Tuberculosis in Kenya and risk factors for mortality during treatment: A National Retrospective Cohort Study. J Pediatr. 2018;201:115–21 Available from:https://linkinghub.elsevier.com/retrieve/pii/S0022347618306735. 21. Schrödle B, Held L. A primer on disease mapping and ecological regression
using INLA. Comput Stat. 2010;26(2):241–58.
22. Ugarte M, Adin A, Goicoa T, Militino A. On fitting spatio-temporal disease mapping models using approximate Bayesian inference. Stat Methods Med Res. 2014;23(6):507–30.
23. Blangiardo M, Cameletti M, Baio G, Rue H. Spatial and spatio-temporal models with R-INLA. Spat Spatiotemporal Epidemiol. 2013;4:33–49. 24. Bernardinelli L, Clayton D, Pascutto C, Montomoli C, Ghislandi M, Songini M.
Bayesian analysis of space-time variation in disease risk. Stat Med. 1995;14:2433–43. 25. HDR. Technical Note 3. 2015.
26. CRA. Creating a County Development Index to identify marginalized counties. Nairobi, Kenya; 2012. Report No.: 01.
27. Richardson S, Abellan JJ, Best N. Bayesian spatio-temporal analysis of joint patterns of male and female lung cancer risks in Yorkshire (UK). Stat Methods Med Res. 2006;15(4):385–407.
28. WHO. TB burden estimates, notifications and treatment outcomes: For individual countries and territories, WHO regions and the world. 2018. 29. Osei E, Der J, Owusu R, Kofie P, Axame WK. The burden of HIV on Tuberculosis
patients in the Volta region of Ghana from 2012 to 2015: implication for Tuberculosis control. BMC Infect Dis. 2017;17(1):504 Available from:http:// bmcinfectdis.biomedcentral.com/articles/10.1186/s12879-017-2598-z. 30. Tarekegne D, Jemal M, Atanaw T, Ebabu A, Endris M, Moges F, et al.
Prevalence of human immunodeficiency virus infection in a cohort of tuberculosis patients at Metema hospital, Northwest Ethiopia: a 3 years retrospective study. BMC Res Notes. 2016;9(1):192–8 Available from:http:// bmcresnotes.biomedcentral.com/articles/10.1186/s13104-016-2004-8. 31. Sanchez M, Bartholomay P, Arakaki-Sanchez D, Enarson D, Bissell K, Barreira
D, et al. Outcomes of TB treatment by HIV status in national recording systems in Brazil, 2003-2008. PLoS One. 2012;7(3):e33129 Available from:
http://www.ncbi.nlm.nih.gov/pubmed/22457738.
32. Davy-Mendez T, Shiau R, Okada RC, Moss NJ, Huang S, Murgai N, et al. Combining surveillance systems to investigate local trends in tuberculosis-HIV co-infection. AIDS Care. 2019;7:1–8 Available from:http://www.ncbi.nlm. nih.gov/pubmed/30729804.
33. Sánchez MS, Lloyd-Smith JO, Williams BG, Porco TC, Ryan SJ, Borgdorff MW, et al. Incongruent HIV and tuberculosis co-dynamics in Kenya: interacting epidemics monitor each other. Epidemics. 2009;1(1):14–20 Available from:
https://linkinghub.elsevier.com/retrieve/pii/S1755436508000030. 34. Manjareeka M, Nanda S. Prevalence of HIV infection among tuberculosis
patients in Eastern India. J Infect Public Health. 2013;6(5):358–62 Available from:http://www.ncbi.nlm.nih.gov/pubmed/23999356.
35. van der Werf MJ, Ködmön C, Zucs P, Hollo V, Amato-Gauci AJ, Pharris A. Tuberculosis and HIV coinfection in Europe: looking at one reality from two angles. AIDS. 2016; 30(18):2845–53 Available from:http://www.ncbi.nlm.nih.gov/pubmed/27755106. 36. Chanda-Kapata P, Kapata N, Klinkenberg E, Grobusch MP, Cobelens F. The
prevalence of HIV among adults with pulmonary TB at a population level in Zambia. BMC Infect Dis. 2017;17(1):236 Available from:http://www.ncbi.nlm. nih.gov/pubmed/28356081.
37. Lee JY. Diagnosis and treatment of extrapulmonary tuberculosis. Tuberc Respir Dis (Seoul). 2015;78(2):47–55 Available from:http://www.ncbi.nlm.nih. gov/pubmed/22310818.
38. Magadi MA. Understanding the gender disparity in HIV infection across countries in sub-Saharan Africa: evidence from the Demographic and Health Surveys. Sociol Health Illn. 2011;33(4):522–39 Available from:http:// www.ncbi.nlm.nih.gov/pubmed/21545443.
39. Sitienei J, Nyambati V, Borus P. The epidemiology of smear positive Tuberculosis in three TB/HIV high Burden provinces of Kenya (2003–2009). Epidemiol Res Int [Internet]. 2013;2013:1–7 Available from:https://www. hindawi.com/archive/2013/417038/.
40. Sia D, Onadja Y, Nandi A, Foro A, Brewer T. What lies behind gender inequalities in HIV/AIDS in sub-Saharan African countries: evidence from Kenya, Lesotho and Tanzania. Health Policy Plan. 2014;29(7):938–49 Available from:http://www.ncbi.nlm.nih.gov/pubmed/24345343. 41. Sia D, Onadja Y, Hajizadeh M, Heymann SJ, Brewer TF, Nandi A, et al. BMC
Public Health. 2016;16(1):1136 Available from: http://bmcpublichealth. biomedcentral.com/articles/10.1186/s12889-016-3783-5.
42. Horton KC, MacPherson P, Houben RMGJ, White RG, Corbett EL. Sex Differences in Tuberculosis Burden and Notifications in Low- and Middle-Income Countries: A Systematic Review and Meta-analysis. PLoS Med. 2016; 3(9):e1002119 Available from:http://www.ncbi.nlm.nih.gov/pubmed/27598345.
43. YC MN. On Gaussian Markov Random Fields and Bayesian disease mapping.
Stat Methods Med Res. 2011;20(1):49–68 Available from:http://journals. sagepub.com/doi/10.1177/0962280210371561.
44. Cuadros DF, Li J, Branscum AJ, Akullian A, Jia P, Mziray EN, et al. Mapping the spatial variability of HIV infection in Sub-Saharan Africa: Effective information for localized HIV prevention and control. Sci Rep. 2017;7(1):9093 Available from:http://www.nature.com/articles/s41598-017-09464-y. 45. Dye C, Glaziou P, Floyd K, Raviglione M. Prospects for Tuberculosis
elimination. Annu Rev Public Health [Internet]. 2013;34(1):271–86 Available from:http://www.annualreviews.org/doi/10.1146/annurev-publhealth-031 912-114431.
46. Nardell E, Dharmadhikari A, et al. Int J Tuberc Lung Dis. 2010;14(10):1233–43 Available from:http://www.ncbi.nlm.nih.gov/pubmed/20843413.
Publisher’s Note