R E S E A R C H
Open Access
Safety and efficacy of volume-based
feeding in critically ill, mechanically
ventilated adults using the
‘
Protein &
Energy Requirements Fed for Every
Critically ill patient every Time
’
(PERFECT)
protocol: a before-and-after study
Sue Brierley-Hobson
1*, Graham Clarke
2and Vincent O
’
Keeffe
1Abstract
Background:Underfeeding in critical illness is common and associated with poor outcomes. According to large prospective hospital studies, volume-based feeding (VBF) safely and effectively improves energy and protein delivery to critically ill patients compared to traditional rate-based feeding (RBF) and might improve patient outcomes. A before-and-after study was designed to evaluate the safety, efficacy and clinical outcomes associated with VBF compared to RBF in a single intensive care unit (ICU).
Methods:The sample included consecutively admitted critically ill adults, mechanically ventilated for at least 72 h and fed enterally for a minimum of 48 h. The first cohort (n= 46) was fed using RBF, the second (n= 46) using VBF, and observed for 7 days, or until extubation or death. Statistical comparison of percentage feed volume, energy and protein delivered, plus indices of feed intolerance, were the primary outcomes of interest. Secondary observations included ventilation period, mortality, and length of ICU stay (LOICUS).
Results: Groups were comparable in baseline clinical and demographic characteristics and nutrition practices.
Volume delivered to the VBF group increased significantly by 11.2% (p ≤0.001), energy by 13.4% (p ≤0.001)
and protein by 8.4% (p= 0.02), compared to the RBF group. In the VBF group, patients meeting > 90% of
energy requirements increased significantly from 47.8 to 84.8% (p≤0.001); those meeting > 90% of protein
requirements changed from 56.5 to 73.9% (p= 0.134).
VBF did not increase symptoms of feed intolerance. Adjusted binomial logistic regression found each additional 1% of prescribed feed delivered decreased the odds of vomiting by 0.942 (5.8%), 95% CI [0.900–0.985],p= 0.010.
No differences in mortality or LOICUS were identified. Kaplan-Meier found a significantly increased extubation rate in patients receiving > 90% of protein requirements compared to those meeting < 80%, (p= 0.006). Adjusted Cox regression found the daily probability of being extubated tripled in patients receiving > 90% of their protein needs compared to the group receiving < 80%, hazard ratio 3.473,p= 0.021, 95% CI [1.205–10.014].
(Continued on next page)
© The Author(s). 2019Open AccessThis article is distributed under the terms of the Creative Commons Attribution 4.0 International License (http://creativecommons.org/licenses/by/4.0/), which permits unrestricted use, distribution, and reproduction in any medium, provided you give appropriate credit to the original author(s) and the source, provide a link to the Creative Commons license, and indicate if changes were made. The Creative Commons Public Domain Dedication waiver (http://creativecommons.org/publicdomain/zero/1.0/) applies to the data made available in this article, unless otherwise stated.
* Correspondence:susan.brierley-hobson@wales.nhs.uk
1Betsi Cadwaladr University Health Board, Bodelwyddan LL18 5UJ, UK
(Continued from previous page)
Conclusion:VBF safely and effectively increased the delivery of energy and protein to critically ill patients. Increased protein delivery may improve extubation rate which has positive patient-centred and financial implications, warranting larger confirmatory trials. This investigation adds weight to the ICU literature supporting VBF, and the growing evidence which advocates for enhanced protein delivery to improve patient outcomes.
Keywords:Volume-based feeding, Critical care, Enteral, Protein, Mechanical ventilation
Background
Critically ill patients are at high risk of morbidity, mor-tality and prolonged care needs [1]; implementing prac-tical approaches to improve outcomes is of paramount importance [2]. During critical illness, evolutionary sur-vival mechanisms release energy from stored body tis-sues to fuel life-supporting tasks [3]. The sacrifice from body stores is deleterious, and contributes to poor out-comes: when energy and protein is delivered to critically ill patients, this risk is ameliorated and recovery poten-tial improved [1,4,5].
Despite the potential benefits of nutrition therapy, feeding is stopped intermittently in 85% of critically ill patients due to essential procedures and symptoms of feed intolerance [1]. These feed stops cause patients to meet only 40–60% of their energy and protein require-ments, rather than allowing optimal delivery and meet-ing the minimum 80% recommended by clinical practice guidelines (CPGs) [1,6].
Most intensive care units (ICUs) worldwide use an hourly ‘rate-based’ feeding (RBF) approach, without strategies to rectify feed deficits. Evidence suggests chan-ging from a rate- to volume-based feeding (VBF) ap-proach helps mitigate these accrued deficits without increasing feed intolerance in medical, and some surgical ICU patients [7–12], and by corollary, may improve clin-ical outcomes. Using the VBF approach, instead of pre-scribing an hourly feeding rate of, for example, 50 ml/h, a patient is prescribed 1200 ml/24-h period; systems are put in place to ensure the entire amount is delivered within 24 h.
CPGs encourage adoption of VBF in local ICU prac-tice [1,6]. The Heyland group [10–12], who named their VBF protocol: The Enhanced Protein-Energy Provision via the Enteral Route in Critically Ill Patients (PEPuP) protocol, openly share and encourage use of their re-sources to facilitate change in local ICUs, and endorse adapting their protocol to local context to facilitate im-plementation [13].
Not all studies show improved outcomes when energy and protein goals are achieved. The VBF studies by Haskins et al. [8], Taylor et al. [9] and Heyland et al. [11] reported no significant difference in LOS, mortality or ventilation was enabled by VBF. Some other studies
evaluating overall nutritional delivery in the critically ill population [14–17] suggest reductions in mortality, ven-tilation period and LOS may be achieved when patients meet their energy and/or protein goals. Others warn that meeting ICU feeding targets triggers complex biochem-ical processes which have the opposite effect: increasing mortality, ventilation duration and LOS [18, 19], and recommend a less aggressive approach to feeding.
Three recent meta-analyses [20–22] found no differ-ence in mortality, ventilation or hospital- or ICU-LOS when patients did or did not meet their energy or pro-tein needs. The randomised controlled trials included in analyses used various strategies to improve nutritional delivery, such as faster feed starts and rate increase to ameliorate deficits [19], or managing gastric residual vol-umes or small bowel feeding. All meta-analyses found patients met sub-optimal levels of protein, which may be important. Emerging evidence suggests that with an in-creased turnover of up to 80% in critical illness, ICU pa-tients have a much larger protein need than previously accepted [23–27]. It is common for protein to be tar-geted secondary to total energy in this patient group and is considered a neglected area of research [28,29].
Deciding the optimal dose and timing of meeting the energy and protein needs of ICU patients remains con-troversial and subject to the impact of variable influ-ences [30]. ASPEN [1] advise assessing for malnutrition risk, using either the Nutritional Risk Screening (NRS) 2002 or the Nutrition Risk in the Critically ill (NUTRIC) scores. NUTRIC was developed by Heyland et al. [31] to identify which ICU patients benefit most from nutri-tional support. The score has been externally validated in large prospective observational trials and found to identify the sickest patients more likely to have increased morbidity and mortality [32, 33]. Evidence suggests the NUTRIC score predicts energy and protein deficits in critically ill patients, but NRS does not [34], and that en-ergy- and protein-related improvements in mortality are greatest in those patients with longer stay, and at highest risk calculated using NUTRIC [33,35].
study was designed with the primary aim of confirming the hypotheses: that changing from RBF to VBF would significantly increase the percentage of prescribed feed volume, energy and protein delivered to adult critically ill patients, without altering feed tolerance. Secondary obser-vations of interest included between-group comparisons of patients’ outcomes including mortality, length of ICU stay (LOICUS) and mechanical ventilation.
Methods
Permissions to undertake study
The study did not require informed patient consent: the system-level quality improvement initiative was designed to undertake a minimal-risk change in feed process which did not exceed the boundaries of standard clinical care, and could not take place practically if prior consent were required [11,36]. The LHB‘Research and Develop-ment’ department consented to the work as a service evaluation project without need to pursue ethical review. The required University Healthcare Sciences and Med-ical Sciences Academics Ethics Committee approval was obtained before data analysis.
ICU characteristics
The adult, medical-surgical ICU is within a district gen-eral teaching hospital comprising 600–700 beds. Staffing is provided in a one-to-one nurse-to-patient ratio, and patients are overseen by a Consultant Intensivist. In the years spanning 2012–2015, quarterly ICU admissions were consistent at 181–204 patients, and average length of mechanical ventilation was 3.7–4.0 days [37].
Recruitment
Data collection was undertaken prospectively in con-secutively admitted, adult (≥18 years) patients who were mechanically ventilated for 72 h or more and fed for at least 48 h. The Local Health Board intensive care unit (LHB-ICU) does not currently use NUTRIC, and the 72-h duration was selected a priori as a method of sam-ple restriction to define a level of disease acuity and lon-ger stay.
Enteral feeding was commenced within 24 h of ventila-tion in stable patients. Only patients deemed clinically appropriate to receive full feeding by the medical or sur-gical team were included. VBF was undertaken from day 2 onwards, or once a patient was considered suitable to meet full-volume feeds. Patients initially nil by mouth, prescribed trophic feeding, or fed cautiously due to a risk of refeeding syndrome, were included if they were able to progress to full feeding within 72 h of ventilation. Data was collected for up to 7 days, cessation of mech-anical ventilation, death or ICU discharge, whichever oc-curred first.
Patients were excluded if they were pregnant, and/or were receiving parenteral or oral nutrition to limit the confounding effect of alternative nutritional support [5].
Energy and protein requirements
The following principles were adhered to throughout the RBF and VBF periods.
Outside the dietitian’s working hours, the ICU used a
‘starter feeding regimen’ devised to closely meet the American Society for Parenteral and Enteral Nutrition (ASPEN) [1] energy and protein recommendations. It used a high protein, 1 kcal/ml feed containing 6.26 g of protein/100 ml for most patients (Osmolite HP [38]), or an isocaloric, lower protein, renal-conserving [39] feed for patients with established chronic kidney disease (Osmolite). The dietitian changed the feed prescription if required following assessment, using ASPEN [1] or other relevant guidelines [39, 40], and prescribing additional protein supplements when indicated (Additional file 1: Table S1).
Feed was progressed to target rate within 6 h of start-ing feed, unless prescribed trophic feedstart-ing, or considered at risk of refeeding syndrome, when feed targets were met gradually [1].
The‘PERFECT’feeding protocol
The VBF protocol was adapted from PEPuP [13] and en-titled:Protein & Energy Requirements Fed for Every Crit-ically ill patient every Time (PERFECT); unlike PEPuP, baseline semi-elemental feeds, protein supplements and prophylactic prokinetics were not used.
The PERFECT toolkit instructed nurses how to in-crease feed rates, (maximum 150 ml/h) to compensate for feed-stops, and return to the initial goal rate at the beginning of the ICU 24 h period. For example, a patient prescribed 1200 ml would commence feeding at 50 ml/h at 0800 h; if the patient’s feed was off for 8 h, they had received 400 ml of feed prior, and there remained 8 h in the day on recommencing feeding, the deficit 800 ml (1200–400 = 800) would be given over 8 h at 100 ml/h (800/8). The 50 ml/h rate would recommence at 0800 h. A single end-of-day feed bolus up to 200 ml was given to replace remaining deficits. Boluses were not adminis-tered to jejunally fed patients.
Patients’ heads were elevated to 30–45° to reduce as-piration risk, and gastric-residual volume (GRV) was checked every 4–6 h. The ICU accepts and replaces GRVs up to 500 ml, with no change in feeding rate in the absence of other signs of intolerance.
required. Nursing daily documentation charts included an area to document feed deficits and corrections.
Data collection
Baseline RBF data was collected prospectively for 7 months from April 2016. PERFECT was implemented January 2017, and data again collected prospectively in consecutive admissions for 6 months.
Data included age, gender, weight, height and body mass index (BMI) in kg/m2; ideal body weight (IBW) if obese, daily energy and protein requirements, the calo-ries and grammes of protein prescribed per kilogramme, hours without feed, and the feed-volume prescribed and delivered in millilitres. The mean daily percentage of prescribed feed-volume, protein and energy delivered (including energy from propofol) was calculated for each patient, based on minimum requirement. Each patient’s mean daily kilocalories per kilogramme and grammes of protein per kilogramme delivered were noted. A whole day of ‘0’ energy and protein delivery was included as 0% achieved.
Total episodes of witnessed vomiting (gastric contents external to mouth) and regurgitation (gastric contents within the mouth) were noted; the expression ‘vomit’ hereon includes both. Mean daily episodes for patients who vomited were calculated. Patients with diarrhoea were noted. Three or more daily liquid stools were clas-sified as diarrhoea using the World Health Organization definition [41], based on nurse perception of type 6–7 stools using the Bristol Stool Chart [42].
Daily patient GRV (millilitres) and the amount re-placed were recorded. Prior to commencing VBF, the ICU changed from using 8-French (Fr) and 10-Fr NGTs (used in the RBF period) to using 12-Fr tubes, which withdraw substantially more GRV [43, 44], making the planned between-group comparison of aspirated vol-umes meaningless. Prokinetic prescription and the mean percentage GRV withdrawn and replaced per patient was compared between groups.
Subgroups of patients meeting < 80%, 80–89.9% and≥ 90% of prescribed energy or protein were prepared for comparison, to explore any differences in clinical out-comes when patients achieved ‘over’ 80% of the ASPEN guideline recommendations, or specifically exceeded this.
Mean daily morning blood glucose and insulin re-quirement (mmol/L) per patient was noted, plus diabetes in past history as relevant to the frequency of hypergly-caemia [9].
Clinical measures recorded from the Case Mix Pro-gram Database (coordinated by the Intensive Care Na-tional Audit & Research Centre) [45] included the Acute Physiology and Chronic Health Evaluation II (APA-CHE-II) severity of illness score, advanced mechanical
ventilation (days), ICU and 60-day hospital mortality (days) and length of ICU stay (LOICUS) (days: calcu-lated from day 1 of ICU admission to when ‘ready for ICU discharge’ to account for delays in discharge); ICU admission diagnoses were summarised by surgery, re-spiratory, cardiovascular and‘other’(pancreatitis, gastro-intestinal, neurological, sepsis, trauma, metabolic and haematological).
Statistical analysis
Power analysis
The primary outcomes of interest were energy and pro-tein delivery and feed tolerance, while secondary obser-vations of interest included ICU and 60-day mortality, ventilation period and LOICUS.
For the primary outcomes of interest, the improve-ments seen in protein and energy delivered to patients in the published VBF studies were classified as a medium-to-large effect size (0.70) for energy, and small-to-medium effect size (0.4) for protein. The G*Power 3 Power Analysis Program [46], version 3.1.9.2, was used to conduct a priori analysis for one-tailed t tests and Mann-Whitney U using the estimated effect sizes, anα-error level of 0.05 and an 80% power. A mini-mum sample requirement of 37 patients per group was noted.
Data management
IBM SPSS version 22 (IBM Corp., USA, 2013) [47] was used in descriptive and inferential statistical tests unless otherwise stated. Statistical significance was accepted at the α-error level ≤0.05; post hoc significance levels are cited in reporting.
Categorical variables are reported as counts and per-centages. These were analysed for differences in propor-tional frequency between RBF and VBF groups using χ2 (chi-square) Test of Homogeneity, Test of Two Propor-tions, or Fisher’s exact test when cell counts were less than 5. Continuous variables are described by their means and standard deviations (±) when normally distributed, or by medians and interquartile range (IQR) when non-nor-mally distributed. Mean and median group differences were compared using independent two-samplettests for normally distributed data, or Mann-Whitney U for non-normal distributions.
Effect sizes are reported for percentage differences in the volume, protein and/or energy delivered between the RBF and VBF groups.
Equivalence between the VBF and RBF groups for mean episodes of vomiting was explored [48, 49] using
logistic regression was used to predict the probability of vomiting, adjusted for daily mean GRV, percentage feed volume delivered, and group.
Secondary outcomes of interest: 60-day survival,
dis-charge and extubation rate were subjected to
Kaplan-Meier and Cox Regression.
Kaplan-Meier for 60-day hospital survival used ICU admission date as start; censoring was based on hospital discharge alive or up to 60 days in hospital alive. For extubation rate analysis, patients who died on the ICU were excluded; day 1 of intubation was the starting point; extubation up to and including day 10 was the event, with ventilated patients there-after censored. For LOICUS, censoring was under-taken after day 14.
Cox regression was adjusted for APACHE-II, group, and the percentage of energy or protein delivered; the covariate diagnosis of ‘respiratory disease’ was added to extubation-rate analysis [50], and BMI 25–35 kg/ m2/< 25 and > 35 kg/m2 to extubation-rate and mor-tality analyses.
Other
To identify predictors of increased mean morning blood glucose, insulin and propofol, multiple regression was adjusted for the percentage of prescribed energy deliv-ered, APACHE-II, group, BMI and/or having diabetes.
Results
Patient characteristics
Both the RBF and VBF groups comprised 46 patients. There were no significant differences between the groups’ patient demographic, anthropometric and baseline clinical characteristics; other than patients in the VBF group were prescribed more propofol (288.9ml) compared to the RBF group (221.6ml) (p =0.025), and there were more patients with a BMI 25–35 kg/m2in the VBF group (65.2%) than in the RBF group (43.5%) (p= 0.036) (Table1).
Nutrition practices
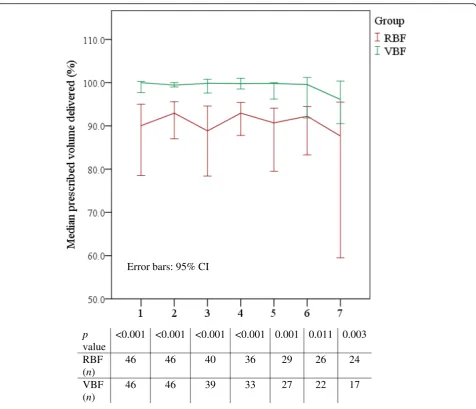
[image:5.595.57.540.367.700.2]All patients were fed by nasogastric tube, bar one in each group fed by nasojejunal tube. There was no differ-ence in the number of evaluable feeding days (Fig. 1),
Table 1Baseline demographic and clinical characteristics and nutrition practices
Variable RBF (n= 46) VBF (n= 46) p
Age (years): mean (SD) 64.3 (± 14.5) 64.8 (± 13.4) 0.870
Female:n(%) 20 (43.5) 15 (32.6)
0.283
Male:n(%) 26 (56.5) 31 (67.4)
Weight (kg): mean (SD) 81.8 (± 26.6) 84.3 (± 15.7) 0.598
BMI (kg/m2): median (IQR) 27.2 (22.2–31.7) 28.1 (24.6–32.4) 0.238
BMI 25–35 kg/m2:n(%) 20 (43.5) 30 (65.2) 0.036
BMI < 30 kg/m2:n(%) 33 (71.7) 28 (60.9)
0.270
BMI≥30 kg/m2:n(%) 13 (28.3) 18 (39.1)
Admission diagnosis:n(%) 0.379
◦Respiratory 13 (28) 19 (41)
◦Cardiovascular 7 (15) 10 (22)
◦Surgery 12 (26) 8 (18)
◦Other 14 (31) 9 (19)
APACHE-II: mean (SD) 18.0 (± 5.8) 17.2 (± 4.8) 0.458
Diabetes:n(%) 13 (28.3) 11 (23.9) 0.635
Daily propofol (ml): median (IQR) 221.6 (43.3–332.7) 288.9 (221.7–360.9) 0.025
Days on propofol: median (IQR) 4.0 (1.6–7.0) 4.0 (2.0–7.0) 0.375
≥1 feed stop:n(%) 37 (80) 35 (76) 0.613
Hours without feed: median (IQR) 488 6.5 (1.0–16.0)
414 4.0 (1–14)
0.379
Volume prescribed (ml/day): mean (SD) 1311.9 (± 273.3) 1322.6 (± 285.3) 0.843
Energy prescribed (kcal/day): mean (SD) 1755.4 (± 397.9) 1787.0 (± 283.1) 0.662
Protein prescribed (g/day): median (IQR) 85.0 (70.0–110.0) 90.5 (83.0–120.0) 0.062
pvalues found usingttest for continuous normally distributed outcomes, Mann WhitneyUfor continuous non-normally distributed outcomes, and Test of Two Proportions or Test of Homogeneity for categorical variables
p = 0.639, or duration without feed (p= 0.379) between groups (Table1).
There was no significant difference in the volume of feed, total energy or protein prescribed to patients in the RBF and VBF groups (Table1). Mean daily feed volume prescribed was 1312 ml (± 273 ml) in the RBF group, and 1323 ml (± 285 ml) in the VBF group, p= 0.843. Patients in the RBF group were prescribed a mean 1755 kcal/day (± 398 kcal/day) and the VBF group 1787 kcal/day (± 283 kcal/day) p= 0.662. Daily protein prescription in the RBF group was 85.0 g/day (IQR 70.0–110.0) and 90.5 g/ day (IQR 83–120) in the VBF group,p= 0.062.
Prescribed feed volume delivered increased by 11.2% (Table2) from a median 87.4% in the VBF group to 98.2% in the VBF group,p≤0.001;r= 0.7 indicated a large effect size. The difference in feed volume delivered was signifi-cantly increased in the VBF group compared to the RBF group every day of the evaluable feeding period (Fig. 2). Feed volume delivered also increased significantly by 16.6% in surgical patients receiving VBF (n= 8) compared to those receiving RBF (n= 12),p= 0.001.
The percentage of prescribed energy (Table 2) deliv-ered increased significantly by 13.4% in the VBF com-pared to the RBF group, from 87.9% (± 13.8%) to 101.3% (± 11.7%), 95% CI [8.1–18.7], p≤0.001; eta2= 0.22 indi-cated this was a large difference. Patients in the VBF group received more daily energy (1785 kcal/day, ± 245 kcal/day) than the RBF group (1541 kcal/day; ± 380 kcal/ day), 95% CI [111.1–376.6],p≤0.001.
The proportion of patients receiving > 90% of their en-ergy prescription increased significantly from 47.8% in the RBF group to 84.8% in the VBF group (p ≤0.001) (Additional file1: Table S2).
Protein delivery
Prescribed protein delivered (Table 2) increased signifi-cantly by 8.4% (p= 0.02), by a mean 20 g per day, 95%
CI [11.0–29.0], (p≤0.001): from 89.2% (± 19.5%) in the RBF group to 97.6% (± 14.8%) in the VBF group, 95% CI [1.2–15.6], p= 0.02; a moderately sized difference ac-cording to the effect size eta2= 0.06. Subgroup analysis found patients receiving over 90% of prescribed protein increased from 56.5% in the RBF group to 73.9% in the VBF group,p= 0.134 (Additional file1: Table S3).
Feed tolerance
There was no significant difference in patients experien-cing at least 1 day of diarrhoea, with 26 in the RBF group (56.5%), and 18 (39.1%) in the VBF group, p= 0.095 (Table3).
The GRV replaced in the RBF (100.0%) and VBF groups (100.0%) p= 0.521 were similar, and there was a non-significant difference in prokinetic prescription, with 28% of patients in the RBF group and 30% in the VBF group prescribed prokinetics,p= 0.819 (Table3).
A Mann-Whitney U TOST identified episodes of vomiting reduced by over 20% in the VBF group (Additional file 1: Table S4). The binomial logistic re-gression adjusted odds ratio (Additional file 1: Table S5) found that for each additional 1% of prescribed feed delivered, there was a 0.942 (5.8%), 95% CI [0.900–0.985], p= 0.010 decreased odds of vomiting.
Mean morning BG (Table 3) was significantly higher in the VBF group (8.5 mmol/L) than the RBF group (8 .0 mmol/L), p= 0.034. Adjusted multiple regression found diabetes to be the only predictor of increased mean morning blood glucose, being 1.05 mmol/L greater in people with diabetes, than those without, 95% CI [0.456–1.646],p= 0.001 (Table4).
There was no significant difference in the mean insulin units prescribed to patients between the RBF (median 6.7; IQR 0.0–38.7) and VBF (median 24.3; 0.0–39.7) groups,p = 0.248. Though not significantly different in distribution [51], the medians were notably dissimilar (Table 3). Ad-justed multiple regression found mean daily insulin pre-scription was predicted to be 40.1 units greater in people with diabetes than those without, 95% CI, [29.013– 51.163], p ≤0.001, and for each increase in APACHE-II score, insulin prescription was predicted to increase by 1.4 units per day, 95% CI [0.514–2.234],p= 0.003.
None of the variables, specifically group, BMI, percentage energy delivered or APACHE-II score used in adjusted mul-tiple regression, predicted propofol prescription (Table4).
Clinical outcomes
Mortality
Total ICU and hospital deaths were the same or similar in each group (Additional file1: Table S6). Kaplan-Meier (Additional file 1: Table S6; Fig. 3) and log-rank test found no significant difference in survival distribution between groups (p= 0.693). Adjusted Cox regression
[image:6.595.57.289.88.232.2](Additional file1: Table S7) found neither the percentage of prescribed energy or protein delivered nor group or BMI range predicted survival time.
Mechanical ventilation
Kaplan-Meier (Fig. 4; Additional file 1: Table S6) with log-rank test found patients in the RBF group had a me-dian time to extubation of 8 days, 95% CI [4.7–11.3], and the VBF group had a median time of 7 days, 95% CI [5.3–8.7];p= 0.342.
Adjusted Cox regression (Additional file 1: Table S7) found that each 1% additional protein delivery increased the daily probability of extubation 1.022-fold (by 2.2%),p = 0.040, 95% CI [1.001–1.043]. The surviving 64 patients (minus one extreme outlier) were grouped by percentage of prescribed protein delivered: < 80%, 80–89.9% and ≥ 90%. A further adjusted Cox regression (Additional file1: Table S7) found patients receiving 80–89.9% of prescribed
protein did not have a significantly different time to extu-bation compared to those meeting < 80%, hazard ratio (HR) 1.635,p= 0.498, 95% CI [0.395–6.772]; however, the daily probability of being extubated more than tripled in patients receiving > 90% of their protein needs compared to the group receiving < 80%, HR 3.473,p= 0.021, 95% CI [1.205–10.014].
Another Kaplan-Meier was run using the same sub-groups of percentage prescribed protein delivered. Kaplan-Meier curves (Fig.5) suggested a substantially in-creased extubation rate in patients receiving > 90% of their protein needs; the cumulative probability of this group remaining ventilated at day 10 was 24%; probability was 56% in the group meeting 80–89.9%, and 69% in the pa-tients who met < 80% of their protein requirements.
[image:7.595.58.538.99.429.2]Log-rank test found significant differences in the distri-bution of extubation time between the 3 protein ranges, p= 0.012. Pairwise log-rank comparisons (Additional file1:
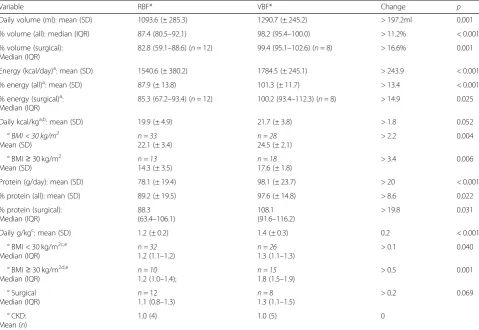
Table 2Difference in feed volume, energy and protein delivered between the RBF and VBF groups
Variable RBF* VBF* Change p
Daily volume (ml): mean (SD) 1093.6 (± 285.3) 1290.7 (± 245.2) > 197.2ml 0.001
% volume (all): median (IQR) 87.4 (80.5–92.1) 98.2 (95.4–100.0) > 11.2% < 0.001
% volume (surgical): Median (IQR)
82.8 (59.1–88.6) (n= 12) 99.4 (95.1–102.6) (n= 8) > 16.6% 0.001
Energy (kcal/day)a: mean (SD) 1540.6 (± 380.2) 1784.5 (± 245.1) > 243.9 < 0.001
% energy (all)a: mean (SD) 87.9 (± 13.8) 101.3 (± 11.7) > 13.4 < 0.001
% energy (surgical)a:
Median (IQR)
85.3 (67.2–93.4) (n= 12) 100.2 (93.4–112.3) (n= 8) > 14.9 0.025
Daily kcal/kga,b: mean (SD) 19.9 (± 4.9) 21.7 (± 3.8) > 1.8 0.052
° BMI < 30 kg/m2 Mean (SD)
n = 33
22.1 (± 3.4)
n = 28
24.5 (± 2.1)
> 2.2 0.004
°BMI≥30 kg/m2
Mean (SD)
n = 13
14.3 (± 3.5)
n = 18
17.6 (± 1.8)
> 3.4 0.006
Protein (g/day): mean (SD) 78.1 (± 19.4) 98.1 (± 23.7) > 20 < 0.001
% protein (all): mean (SD) 89.2 (± 19.5) 97.6 (± 14.8) > 8.6 0.022
% protein (surgical): Median (IQR)
88.3 (63.4–106.1)
108.1 (91.6–116.2)
> 19.8 0.031
Daily g/kgc: mean (SD) 1.2 (± 0.2) 1.4 (± 0.3) 0.2 < 0.001
°BMI < 30 kg/m2c,e
Median (IQR)
n = 32
1.2 (1.1–1.2)
n = 26
1.3 (1.1–1.3)
> 0.1 0.040
°BMI≥30 kg/m2d,e Median (IQR)
n = 10
1.2 (1.0–1.4);
n = 15
1.8 (1.5–1.9)
> 0.5 0.001
°Surgical Median (IQR)
n= 12 1.1 (0.8–1.3)
n= 8 1.3 (1.1–1.5)
> 0.2 0.069
°CKD: Mean (n)
1.0 (4) 1.0 (5) 0
pvalues found usingttest for continuous normally distributed outcomes, and Mann WhitneyUfor continuous non-normally distributed outcomes
nnumber of,IQRinterquartile range,SDstandard deviation,BMIbody mass index,RBFrate-based feeding,VBFvolume-based feeding,mlmillilitres,kg
kilogrammes,kcal/daykcal per day,g/daygrammes per day,kcal/kgkcal per kilogramme,CKDchronic kidney disease a
kcal from feed and propofol b
kcal/kg of actual bodyweight c
g/kg of actual bodyweight d
g/kg of ideal bodyweight e
Table S8) were undertaken to compare ventilation distribu-tions. Using a Bonferroni correction, with significance ac-cepted at the p< 0.0167 level, there was a significant difference in ventilation distribution between the groups of patients receiving < 80% and≥90% protein,p= 0.006.
The 75th centile is shown in Fig. 5 and Additional file 1: Table S8 and demonstrates the time by which 25% of patients were extubated: 25% of those receiv-ing < 80% of protein were extubated by day 10, 95% CI [4.6–15.4], those receiving 80–89.9% by day 6,
p
value
<0.001 <0.001 <0.001 <0.001 0.001 0.011 0.003
RBF
(
n
)
46
46
40
36
29
26
24
VBF
(
n
)
46
46
39
33
27
22
17
Error bars: 95% CI
[image:8.595.61.538.85.494.2]Fig. 2Daily median percentage feed volume delivered to RBF and VBF groups. Figure shows median 95% CI error bars,nper sample, and Mann-WhitneyUresult which found statistically significant increases in volume delivered to the VBF group compared to the RBF group every day
Table 3Summary of descriptive and inferential analysis for feed tolerance
Variable RBF (n= 46) VBF (n= 46) p
Patients with diarrhoea:n(%) 26 (56.5) 18 (39.1) 0.095
Mean GRV (ml): mean (SD) 37.8 (68.3) 153.5 (240.0) See narrative
% GRV replaced: median (IQR) 100 (20–100) 100 (61–100) 0.621
Patients vomiting:n(%) 11 (23.9) 9 (19.6) 0.613
Prescribed prokinetics:n(%) 13 (28.3) 14 (30.4) 0.819
Insulin (U): median (IQR) 6.7 (0.0–38.7) 24.3 (0.0–39.7) 0.248
Mean morning blood glucose (mmol/L): median (IQR) 8.0 (7.1–8.8) 8.5 (7.8–9.5) 0.034
[image:8.595.58.538.612.723.2](SE not calculated), and > 90% by day 5, 95% CI [3.9–5.9].
Length of ICU stay
Kaplan-Meier (Fig. 6; Additional file 1: Table S6) with a log-rank test found no statistically significant difference in the LOICUS between groups,χ2(1) = 0.815,p= 0.367. Adjusted Cox regression identified no significant predic-tors of discharge rate (Additional file1: Table S7).
Discussion
This prospective before-and-after study suggests volume-based feeding safely improved patients’feed vol-ume, energy and protein delivery, and that increasing protein delivery increased the rate of extubation, but these factors did not influence mortality or LOICUS.
Changes to delivery of feed volume, energy and protein
The percentage energy increase in the VBF group compares similarly to the VBF studies in other medical-surgical ICUs which improved delivery by 9.1– 17% [8, 10–12]. The 8.6% protein increase achieved in the PERFECT study was exceeded in the Heyland et al.
[10–12] PEPuP studies, with their improvements ranging from 11.3 to 14%, which is explained by the broad pre-scription of 24-g protein modules daily to patients, which were not used in the PERFECT study. In the PER-FECT study, the increase in energy and protein delivery in the VBF group meant that patients in this group more closely met the ASPEN nutrition guideline recommen-dations targeted by the LHB-ICU, albeit protein targets were still not achieved in the cohort of patients with a BMI > 30 kg/m2. The achievement of 1.3 g of protein per kilogramme bodyweight in patients with a BMI < 29.9kg/m2 meets the minimum prescription recom-mended by the newly published European Society of Parenteral and Enteral Nutrition (ESPEN) ICU nutrition guidelines [52].
[image:9.595.56.541.99.196.2]Like Taylor et al. [9], the small subgroup of surgical patients in the PERFECT study’s VBF group received sig-nificantly more energy and protein than the RBF group. These findings are unlike the surgical ICU study by Declercq et al. [7], who found no difference in energy or protein delivery using VBF, which was attributed to poor protocol compliance. Heyland et al. [11, 12] acknow-ledge that simply using a protocol may be insufficient to
Table 4Multiple regression analysis: showing analysis of morning BG, plus insulin and propofol requirement
Variable and adjustment
Morning blood glucose Insulin prescription Propofol
B p 95% CI B p 95% CI B p 95% CI
Group* 0.426 0.157 −0.166 to 1.018 2.990 0.574 −7.561 to 13.540 52.364 0.107 −11.572 to 116.299
BMI 0.005 0.777 −0.031 to 0.041 0.314 0.330 −0.324 to 0.952 3.258 0.102 −0.664 to 7.181
% Energy 0.011 0.316 −0.010 to 0.032 0.203 0.272 −0.162 to 0.568 1.197 0.294 −1.058 to 3.451
APACHE-II 0.000 0.992 −0.050 to 0.051 1.424 0.003 0.514 to 2.234 0.235 0.932 −5.192 to 5.661
Diabetes+ 1.051 0.001 0.456 to 1.646 40.088 < 0.001 29.013 to 51.163 – – –
Bunstandardized regression coefficients,APACHE-IIAcute Physiology and Chronic Health Evaluation II,BMIbody mass index,CIconfidence interval *VBF versus RBF
+
Having diabetes versus not
Fig. 3Kaplan-Meier 60-day survival curves by group; shows no
[image:9.595.307.538.528.712.2] [image:9.595.58.292.533.702.2]overcome individual unit cultural and systemic barriers. The PERFECT study utilised various system-level im-provement techniques to facilitate adoption, such as identified project leadership, team coproduction, local adaptation, and staff education [53, 54]. Notably, the PERFECT study’s RBF group met over 85% of pre-scribed energy and protein needs, demonstrating the existing positive attitude to nutrition practice in the LHB-ICU, which likely fostered readiness to adopt the new approach.
Feed tolerance
There was no difference between the RBF and VBF groups in patients experiencing diarrhoea. Taylor et al. [9] reported the number of patients with diarrhoea sig-nificantly increased in their VBF group, which was
attributed to large (400 ml) intragastric feed boluses not used in the PERFECT study.
Analysis found that each additional 1% of feed volume delivered was associated with a significantly decreased odds of vomiting. This is physiologically conceivable given normal gastric retention and emptying processes [43,55] and is supported by others’work [9,10,56,57].
Neither mean morning blood glucose (BG) levels nor insulin prescription was predicted by increased energy delivery or being in either group, and BG levels were maintained under 10 mmol/L as per current recommen-dations [1]. Obesity is independently characterised by insulin-resistance, which can be exacerbated by the added metabolic complexities of critical illness [58, 59]. Although benefits remain to be confirmed [52, 59], hypocaloric, high protein feeding is proposed to minim-ise the metabolic consequences of over-feeding in obese patients, plus preserve nitrogen balance and lean mass [52, 58–60]. This approach is recommended by ASPEN [1] and was used in the PERFECT study for this patient cohort. Managing the energy requirements of overweight critically ill patients has not yet been addressed by re-search [52]. We note with interest that ESPEN [52] have very recently recommended a more conservative ap-proach to prescribing energy in patients with a BMI > 25 kg/m2. In the PERFECT study, BMI did not predict elevated blood glucose or insulin requirements, suggest-ing our relatively conservative approach to energy pre-scription mitigated risk.
Clinical outcomes
Mortality
Unlike the PERFECT study which found feeding im-provements did not change mortality outcomes, some studies suggest improved energy and/or protein delivery improves survival [15, 17]; others suggest outcomes are worse when patients meet these targets, and advise a less aggressive approach [18,19].
An observational point-prevalence study of 2772 pa-tients from 167 medical-surgical ICUs by Alberda et al. [4] found that 1000 kcal/day and 30 g protein delivered were associated with reduced 60-day mortality, though only in patients with a BMI < 25 kg/m2and > 35 kcal/m2, who may be less susceptible to the earlier metabolic con-sequences of critical illness [1,5]. In the PERFECT study, 43.5% of patients in the RBF group, and 65.2% in the VBF group, had a BMI of 25–35 kg/m2: these patients may not have benefitted from early macronutrient ma-nipulation, substantially limiting the likelihood of statis-tically finding enhanced mortality outcomes in the small number of patients with a lower or higher BMI.
It may be that patients with a lower BMI, having less re-serve, benefit more from supplementation, while height-ened alterations to macronutrient utility in critically ill
Fig. 5Kaplan-Meier curves for time to extubation by percentage of prescribed protein delivered: shows 75th centile, days by which 25% of each group extubated and the cumulative probability (discussed as %) of remaining ventilated at day 10
[image:10.595.57.290.87.264.2] [image:10.595.57.290.544.714.2]obese cohorts can make both over- and under-feeding det-rimental [1, 58, 60, 61]. This may explain the increased mortality attributed to enhanced feeding suggested by studies such as Braunschweig et al. [19], who estimated and often exceeded energy requirements at 30 kcal/kg in a largely obese cohort. Using such estimations in the acute phase of ICU admission is associated with a metabolic burden which is not recommended [1,58,61,62].
Some studies suggest‘forced feeding’ in the first week of critical illness inhibits autophagy [63,64]. The physio-logical process of autophagy regulates inflammation, clears toxic cell damage and supports protein synthesis in starvation [65]. Feeding, insulin and hyperglycaemia inhibit autophagy, prompting the hypothesis that au-tophagy is prevented when need is greatest in critical ill-ness, leading to accelerated muscle loss.
Autophagy is influenced by the severity of oxidative stress [65], suggesting those with greater stress may be more vulnerable to autophagy inhibition caused by over-feeding. As characterised by their need for advanced mechanical ventilation, 89.1% of patients in the PERFECT study’s RBF group and 97.8% in the VBF group required propofol, and the VBF group received significantly more median units. Outcomes were not worse in the PERFECT study’s VBF group despite receiving more energy and pro-pofol than the RBF group, challenging the theory of detri-mental autophagy inhibition.
The role of autophagy in critical illness and feeding is poorly understood: McClave and Weijs [65, 66] argue evidence does not support underfeeding, though suggest preventing hyperglycaemia by avoiding excessive energy provision is a prudent approach to limit inhibition. They note ‘excessive’ does not equate to meeting the guideline-recommended energy and protein targets uti-lised in the PERFECT study, suggesting patients in the more‘aggressively’fed VBF group were protected by tar-geting low-to-moderate energy and higher-protein feed-ing in all recruits, which as summarised earlier did not cause hyperglycaemia.
Ventilation
Enhanced protein delivery significantly increased the rate of extubation of survivors, with the daily probability of be-ing extubated more than triplbe-ing in the PERFECT study’s group of patients receiving > 90% of their protein needs compared to patients receiving < 80%. These findings were unlike Alberda et al. [4], who found each additional 30 g protein was not associated with more ventilator-free days (VFDs). Alberda et al. [4] only reached 60% of target pro-tein equalling a mean 47 g/day compared to the PERFECT study’s often supplemented mean 78.1–98.1 g/day in the RBF and VBF groups; perhaps the Alberda et al. [4] study’s patients did not meet enough protein to see the ventila-tion improvement. This might also explain the lack of
improvement seen by Heyland et al. [11] in their VBF study given that patients met only 48% of energy and pro-tein from all sources.
Studies such as those undertaken by Alberda et al. [4] have been criticised for undertaking separate protein analyses when using fixed-ratio feeds without protein supplementation given their propensity to underfeed protein: while patients may receive‘more’, it could be in-sufficient to change outcomes [29,67,68].
Three meta-analyses [20–22] found no difference in mortality, LOS, or ventilation when patients did or did not meet their energy and protein needs; however, none of the studies included in meta-analyses achieved more than a mean 1.1 g/kg of protein. This factor may distin-guish the PERFECT study’s extubation findings from some others’ work. Metabolic studies suggest 1.5–2.5 g/ kg protein/day is required for catabolic critically ill pa-tients to reach muscle protein synthesis [28, 69]. Re-duced muscle mass inevitably weakens function and has been linked to reduced respiratory power and prolonged ventilation [66,69], so the ventilation improvement seen in the PERFECT study is plausible and compares to some others’findings [5,60].
Elke et al. [5] completed secondary analysis using pooled data from the Alberda et al. [4] and Heyland et al. [10] studies, to achieve a sample of 2270 patients, who, like the PERFECT study, were ventilated for over 72 h and exclusively enterally fed. Patients’nutrition was split into tertiles of achievement and analysed in separ-ate logistic and linear regression models for energy and protein, adjusted for age, BMI and APACHE-II. The study found each additional 1000 kcal/day and 30 g pro-tein reduced 60-day mortality and increased VFDs. In sensitivity analysis of survivors fed for the first 7 days of admission, ventilation improvements only persisted for increased protein provision.
With a mean age 62 years, BMI 27.6 kg/m2, median ventilation of 8.4 days, mortality 31%, LOICUS 11.5 days and being predominantly male, Elke et al. [5] argue their study is reflective of typical ICU populations and is cer-tainly comparable to the PERFECT study’s recruits.
Hoffer and Bistrian [28] suggest patients with an ICULOS longer than 3.8 days will particularly benefit from additional protein to alleviate muscle atrophy. This may be especially true for patients with pre-existing atrophy, such as mal-nourished and/or inactive elderly and obese patients who depend more on feeding given their reduced ability to achieve nitrogen-balance [28]. Patients in the PERFECT and Elke et al. [5] studies were included for a minimum of 3-day ventilation and largely fit this description.
Strengths and limitations
The sample of 46 patients per group exceeded the minimal sample requirement identified through power analysis, which gives confidence in the findings suggest-ing feed volume, energy and protein delivery was signifi-cantly increased in the VBF compared to the RBF group, without adverse effects.
Heyland et al. [12] questioned whether VBF improve-ments in feed delivery could be reproduced using poly-meric, rather than semi-elemental feeds. The PERFECT study strongly suggests this is possible and, furthermore, safely achieved without prophylactic prokinetics as uti-lised by Heyland et al. [10–12]. The successfully im-proved nutritional delivery and safety seen adds detail to the published research about volume-based feeding.
Recruiting only patients ventilated for 72 or more hours and amenable to VBF within the observation period ensured the study represented patients with a prolonged ICU stay and had some uniformity of disease acuity [69]. The RBF and VBF groups were well-matched with regard to baseline clinical and demographic factors and nutrition practices.
Nevertheless, outcome findings require cautious inter-pretation. We acknowledge the confounding influence of illness severity and population heterogeneity challenges findings which suggest changes in outcomes are causally re-lated to nutrition in ICU observational studies [70]. Clinical outcomes were considered observations of interest and were not subject to power analysis. Knowledge of which pa-tients benefit from ICU energy and protein remains elusive, with some suggesting three groups likely; those who do, or do not recover regardless, and those who benefit, such as patients particularly susceptible to lean-tissue atrophy, and/ or otherwise identified as high risk [28,31,71].
While discussion established this population might be reasonably represented in the PERFECT study, if the outcomes of many recruits occurred independently of energy and protein delivery, isolating nutrition’s treat-ment effect in this small sample would be very challen-ging, particularly when, although statistically significant, the absolute difference in energy and protein delivery between groups was relatively small. We recognise this is especially true of mortality, with much larger observa-tional and randomised controlled trials, designed and powered specifically to measure this outcome, still yield-ing conflictyield-ing results [52].
The suggestion that increased protein delivery pre-dicted the probability of earlier extubation in the PER-FECT study is exciting, and links to the recent call to research by Hurt et al. [72] to explore protein-related improvements in short-term outcomes. The findings from the small sample were strengthened by use of a Bonferroni correction; nevertheless, this result must be interpreted with caution and, while encouraging, should only be used in future hypothesis development.
Adjustments for the most pertinent covariates in re-gression analyses were made, but, to optimise statistical quality, only a limited number were introduced; there may be other, unadjusted confounding influences.
As patients were not followed up once extubated, it cannot be assumed that energy and protein needs con-tinued to be met, and inconstant intakes may have influ-enced the reported outcomes.
Finally, patients in the PERFECT study were not ran-domised, which was justified by the nature of the system-level, quality improvement intervention [73].
Conclusion
The investigation found the PERFECT VBF feeding protocol significantly enhanced feed volume, energy and protein delivery to prolonged, mechanically ventilated patients in the LHB-ICU, without increasing feed in-tolerance. The exciting finding that enhanced protein delivery may improve ventilation is considered plausible, albeit requires further confirmatory study.
The approach is now embedded in daily practice on our ICU. As noted, patients in the PERFECT study were quite ‘typical’ of ICU admissions elsewhere, suggesting the findings will be useful to those working in similar medical-surgical ICUs considering adopting this ap-proach. We recognise that our ICU patients met over 80% of protein and energy targets prior to commencing VBF: one might consider VBF unnecessary in such a co-hort. As delineated in Fig.2, using a VBF strategy signifi-cantly improved the likelihood of consistently achieving daily feed targets in all patients; therefore, we do con-sider this approach worthwhile in facilitating optimal en-ergy and protein delivery regardless of baseline.
Large-scale research to demonstrate the safety and ef-ficacy of VBF in other ICU populations has merit. That said, this analysis and the resulting discussion highlight that a unifying characteristic of many studies published thus far is a failure to optimise protein delivery: this may be key to improving ICU outcomes and suggests just doing ‘more of the same’ is not enough. Efforts at im-proving feeding in ICUs meeting low volumes are valu-able, but these efforts should be aimed at increasing supplemented protein delivery, not just total energy.
optimise feeding in all patients, which this investigation has shown, is enabled by the PERFECT feeding protocol in our ICU. As noted, we do not calculate the NUTRIC score at present; this will be a recommendation for our Unit so we can be prepared to respond to emerging findings.
To optimise interpretation and generalisability, large, multicentre randomised controlled trials must be designed to measure outcomes related to improved protein delivery, using adequately powered samples for pre-specified effect sizes [74], a priori determined patient outcomes, and sub-ject to powerful statistical analysis.
Additional file
Additional file 1: Table S1.Calculating patients’energy and protein prescription (using ASPEN guidelines [1] unless otherwise stated).Table S2.χ2test of homogeneity showing group frequency distributions for the percentage range of energy delivered.Table S3.χ2test of homogeneity showing group frequency distributions for the percentage range of protein delivered.Table S4.Equivalence TOST: daily episodes of vomiting.Table S5.Binomial logistic regression predicting odds of vomiting for mean GRV, percentage feed delivered, and group.Table S6.
Summary of analysis for ICU and hospital mortality, ventilation period and LOICUS by group.Table S7.Results of adjusted Cox regression for 60-day survival, length of ventilation and LOICUS.Table S8.Results of Kaplan-Meier ventilation period by percentage range of prescribed protein delivered: showing 75th quartile, total events and pairwise log-rank comparisons of ventilation distribution: (significance accepted at
p< 0.0167). (DOCX 24 kb)
Abbreviations
ABW:Actual bodyweight; APACHE-II: Acute Physiology and Chronic Health Evaluation II (score); BG: Blood glucose; BMI: Body mass index; CI: Confidence interval; CKD: Chronic kidney disease; CPG: Clinical practice guidelines; CVVHDF: Continuous venovenous hemodiafiltration; Energy: Expressed as kilocalories or kcal; g: Grammes (when discussing grammes of protein); g/ kg: Grammes (of protein) per kilogramme; GRV: Gastric-residual volume; HR: Hazard ratio; IBW: Ideal bodyweight; ICNARC: Intensive Care National Audit & Research Centre; ICU: Intensive care unit; INTACT: Intensive nutrition in acute lung injury: a clinical trial; kcal : Kilocalories; kcal/day: Kilocalories per day; kcal/kg: Kilocalories per kilogramme; kg: Kilogrammes; LHB: Local Health Board; LHB-ICU: Local Health Board intensive care unit; LOICUS: Length of intensive care unit stay; LOS: Length of stay;M: Mean difference; ml: Millilitre; mmol/L: Millimoles per litre;n: Number of; NGT: Nasogastric tube;
NHS: National Health Service;p: Value denoting statistical significance; PEPuP: Enhanced Protein-Energy Provision via the Enteral Route in Critically Ill Patients; PERFECT: Protein & Energy Requirements Fed to Every Critically ill patient every Time; RBF group: The group who received rate-based feeding; RBF: Rate-based feeding/process; SD: Standard deviation; the symbol‘±’is used throughout to represent mean standard deviation;t:ttest statistic;
U: Mann-WhitneyUtest statistic; VBF group: The group who received volume-based feeding; VBF: Volume-based feeding/process;χ2: Chi-square
Acknowledgements
Thank you to all the doctors, and especially to the nurses who contributed to and supported the work; to our clerk who assisted with data collection, and thank you to Graham Clarke for mentoring through statistical analysis and dissertation.
Funding
None to declare.
Availability of data and materials
The datasets used and/or analysed during the current study are available from the corresponding author on reasonable request.
Authors’contributions
VC is a Consultant on our unit and was supportive in designing the evaluation and the final feeding process. GC is a Senior Lecturer and Teaching Fellow at Bangor University. He was my academic supervisor for my Masters Dissertation. He provided guidance and support throughout statistical analysis and marked the work in its entirety. All authors read and approved the final manuscript and agreed to be accountable for all aspects of the work in ensuring that questions related to the accuracy or integrity of any part of the work are appropriately investigated and resolved.
Ethics approval and consent to participate
This is discussed in‘methods’as follows:
The study did not require informed patient consent: the system-level quality improvement initiative was designed to undertake a minimal-risk change in feed process which did not exceed the boundaries of standard clinical care, and could not take place practically if prior consent were required [11,23]. The Local Health Board‘Research and Development’department consented to the work as a service evaluation project without need to pursue ethical review. The required University Healthcare Sciences and Medical Sciences Academics Ethics Committee approval was obtained before data analysis.
Consent for publication
Not applicable.
Competing interests
The authors declare that they have no competing interests.
Publisher’s Note
Springer Nature remains neutral with regard to jurisdictional claims in published maps and institutional affiliations.
Author details
1Betsi Cadwaladr University Health Board, Bodelwyddan LL18 5UJ, UK. 2Bangor University, Fron Heulog, Bangor LL57 2EF, UK.
Received: 21 December 2018 Accepted: 7 March 2019
References
1. McClave SA, Taylor BE, Martindale RG, Warren MM, Johnson DR, Braunschweig C, et al. Guidelines for the provision and assessment of nutrition support therapy in the adult critically ill patient: Society of Critical Care Medicine and American Society for Parenteral nutrition. JPEN J Parenter Enteral Nutr. 2016;40:159–211.
2. 1000 Lives Plus. How to guide: improving critical care. The Health Foundation: Inspiring Improvement. 2010.http://www.1000livesplus.wales. nhs.uk/sitesplus/documents/1011/How%20to%20%283%29%20Improving %20Critical%20Care%20%28Feb%202011%29%20Web.pdf. Accessed 20 Aug 2017.
3. Pichard C, Oshima T, Berger MM. Energy deficit is clinically relevant for critically ill patients: yes. Intensive Care Med. 2015;41:335–8.
4. Alberda C, Gramlich L, Jones N, Jeejeebhoy K, Day AG, Dhaliwal R, Heyland DK. The relationship between nutritional intake and clinical outcomes in critically ill patients: results of an international multicentre observational study. Intensive Care Med. 2009;35:1728–37.
5. Elke G, Wang M, Weiler N, Day AG, Heyland DK. Close to recommended caloric and protein intake by enteral nutrition is associated with better clinical outcome of critically ill septic patients: secondary analysis of a large nutrition database. Crit Care. 2014;18:R29.
6. Critical Care Nutrition. Canadian clinical practice guidelines 2015: summary of revisions to the recommendations 2015.http://www.criticalcarenutrition. com/docs/CPGs%202015/Summary%20CPGs%202015%20vs%202013.pdf. Accessed 19 May 2017.
7. Declercq B, Deane AM, Wang M, Chapman MJ, Heyland DK. Enhanced protein-energy provision via the enteral route feeding (PEPuP) protocol in critically ill surgical patients: a multicentre prospective trial. Anaesth Intensive Care. 2016;44:93–8.
9. Taylor B, Brody R, Denmark R, Southard R, Byham-Gray L. Improving enteral delivery through the adoption of the“Feed Early Enteral Diet adequately for Maximum Effect (FEED ME)”protocol in a surgical trauma ICU: a quality improvement review. Nutr Clin Pract. 2014;29:639–48.
10. Heyland DK, Cahill N, Dhaliwal R, Wang M, Day AG, Alenzi A, et al. Enhanced protein-energy provision via the enteral route in critically ill patients: a single centre feasibility trial of the PEP uP protocol. Crit Care. 2010;14:R78.
11. Heyland DK, Murch L, Cahill N, McCall M, Muscedere J, Stelfox HT, et al. Enhanced protein-energy provision via the enteral route feeding protocol in critically ill patients: results of a cluster randomized trial. Crit Care Med. 2013; 41:2743–53.
12. Heyland DK, Dahliwal R, Lemieux M, Wang M, Day AG. Implementing the PEP uP protocol in critical care units in Canada: results of a multicentre, quality improvement study. JPEN J Parenter Enteral Nutr. 2015;39:698–706. 13. Critical Care Nutrition. PEPuP Tools.https://www.criticalcarenutrition.com/
resources/pepup/study-tools. Accessed 28 July 2016.
14. Rugeles S-J, Rueda J-D, Diaz C-E, Rosselli D. Hyperproteic hypocaloric enteral nutrition in the critically ill patient: a randomized controlled clinical trial. Indian J Crit Care Med. 2013;17:343–9.
15. Tsai J-R, Change W-T, Sheu C-C, Wu Y-J, Sheu Y-H, Liu P-L, et al. Inadequate energy delivery during early critical illness correlates with increased risk of mortality in patients who survive at least seven days: a retrospective study. Clin Nutr. 2011;30:209–14.
16. Villet S, Chiolero RL, Bollmann MD, Revelly J-P, Cayeux M-C, Delarue J, Berger MM. Negative impact of hypocaloric feeding and energy balance on clinical outcome in ICU patients. Clin Nutr. 2005;24:502–9.
17. Wei XW, Day AG, Ouelette-Kuntz H, Heyland DK. The association between nutritional adequacy and long-term outcomes in critically ill patients requiring prolonged mechanical ventilation: a multicentre cohort study. Crit Care Med. 2015;43:1569–79.
18. Arabi YM, Haddad SH, Tamim HM, Rishu AH, Sakkijha MH, Kahoul SH, Britts RJ. Near-target caloric intake in critically ill medical-surgical patients is associated with adverse outcomes. JPEN J Parenter Enteral Nutr. 2010;34:280–8. 19. Braunschweig CA, Sheean PM, Peterson SJ, Perez SG, Freels S, Lateef O,
et al. Intensive nutrition in acute lung injury: a clinical trial (INTACT). JPEN J Parenter Enteral Nutr. 2015;39:13–20.
20. Al-Dorzi HM, Albarrak A, Ferwana M, Murad MH, Arabi YM. Lower versus higher dose of enteral caloric intake in adult critically ill patients: a systematic review and meta-analysis. Crit Care. 2016;20:358. 21. Choi EY, Park D-A, Park J. Caloric intake of enteral nutrition and clinical
outcomes in acutely critically ill patients: a meta-analysis of randomized controlled trials. JPEN J Parenter Enteral Nutr. 2015;39:291–300. 22. Tian F, Wang X, Gao X, Wan X, Wu C, Zhang L, et al. Effect of initial calorie
intake via enteral nutrition in critical illness: a meta-analysis of randomised controlled trials. Crit Care. 2015;19:1–13.
23. da Cunha HFR, da Rocha EEM, Hissa M. Protein requirements, morbidity and mortality in critically ill patients: fundamentals and applications. Rev Bras Ter Intensiva. 2012;25:49–55.
24. Weijs PJM, Looijard WGPM, Beishuizen A, ARJ G, Oudermans-van Straaten HM. Early high protein intake is associated with low mortality and energy overfeeding with high mortality in non-septic mechanically ventilated critically ill patients. Critical Care. 2014;18:701.
25. Allingstrup MJ, Esmailzadeh N, Wilkens Knudsen A, Espersen K, Hartvig Jensen T, Wiis J, Perner A, Kondrup J. Provision of protein and energy in relation to measured requirements in intensive care patients. Clin Nutr. 2012;31:462–8.
26. Weijs PJ, Stapel SN, de Groot SD, Driessen RH, de Jong E, Girbes AR, et al. Optimal protein and energy nutrition decreases mortality in mechanically ventilated, critically ill patients: a prospective observational cohort study. JPEN J Parenter Enteral Nutr. 2012;6:60–8.
27. Weijs PJM, Cynober L, DeLegge M, Kreymann G, Wernerman J, Wolfe RR. Proteins and amino acids are fundamental to optimal nutrition support in critically ill patients. Crit Care. 2014;18:591.https://doi.org/10.1186/s13054-014-0591-0. 28. Hoffer JL, Bistrian BR. Nutrition in critical care: a current conundrum.
F1000Research. 2016;5.https://doi.org/10.12688/f1000research.9278.1. 29. Weijs PJ, Wischmeyer PE. Optimizing energy and protein balance in the ICU.
Curr Opin Clin Nutr Metab Care. 2013;16:194–201.
30. Preiser JC, van Zanten AR, Berger MM, Biolo G, Casaer MP, Doig GS, et al. Metabolic and nutritional support of critically ill patients: consensus and controversies. Crit Care. 2015;19:35.
31. Heyland DK, Dhaliwal R, Jiang X, Day AG. Identifying critically ill patients who benefit the most from nutrition therapy: the development and initial validation of a novel risk assessment tool. Crit Care. 2011;15:R268. 32. Kalaiselvan MS, Renuka MK, Arunkumar AS. Use of Nutrition risk in critically ill
(NUTRIC) score to assess nutritional risk in mechanically ventilated patients: a prospective observational study. Indian J Crit Care Med. 2017;21:253–6. 33. Rahman A, Hasan RM, Agarwala R, Martin C, Day AG, Heyland DK.
Identifying critically-ill patients who will benefit most from nutritional therapy: further validation of the“modified NUTRIC”nutritional risk assessment tool. Clin Nutr. 2016;25:158–62.
34. Canales C, Elsayes A, Yeh DD, Belcher D, Nakayama A, McCarthy CM, et al. Nutrition Risk in Critically Ill Versus the Nutritional Risk Screening 2002: are they comparable for assessing risk of malnutrition in critically ill patients? JPEN J Parenter Enteral Nutr. 2019;43:81–7.
35. Compher C, Chittams J, Sammarco T, Nicolo M, Heyland DK. Greater protein and energy intake may be associated with improved mortality in higher risk critically ill patients: a multicentre, multinational observational study. Crit Care Med. 2017;45:156–63.
36. Fiscella K, Tobin JN, Carroll JK, He H, Ogedegbe G. Ethical oversight in quality improvement and quality improvement research: new approaches to promote a learning health care system. BMC Med Ethics. 2015;16:63. 37. WardWatcher™Software (2013–2015). Critical Care Audit Ltd, Yorkshire, UK.
http://www.sicsag.scot.nhs.uk/Data/WardWatcher.html. Accessed 12 Aug 2016. 38. Abbott Nutrition. Tube feeds.
https://www.abbottnutrition.co.uk/products-and-services/abbott-nutrition-products/tube-feeds/. Accessed 11 Nov 2017. 39. Kidney Disease: Improving Global Outcomes (KDIGO) CKD Work Group.
KDIGO 2012 Clinical practice guideline for the evaluation and management of chronic kidney disease. Kidney inter. 2013;3:1–150.
40. Henry CJ. Basal metabolic rate studies in humans: measurement and development of new equations. Public Health Nutr. 2005;8:1133–52. 41. World Health Organisation. The treatment of diarrhoea: a manual of physicians and other senior health workers. Geneva: World Health Organisation; 1995.
42. Heaton KW, Lewis SJ. Stool form scale as a useful guide to intestinal transit time. Scand J Gastroenterol. 1997;32:920–4.
43. Guo B. Gastric residual volume management in critically ill mechanically ventilated patients: a literature review. Proc Singapore Healthc. 2015;24:171–80. 44. Metheny NA, Schallom L, Oliver DA, Clouse RE. Gastric residual volume and
aspiration in critically ill patients receiving gastric feedings. Am J Crit Care. 2008;17:512–9.
45. Intensive Care National Audit & Research Centre (ICNARC).https://www. icnarc.org/. Accessed 15 Dec 2018.
46. Faul F, Erdfelder E, Lang A-G, Buchner A. G*Power 3: a flexible statistical power analysis program for the social, behavioral, and biomedical sciences. Behav Res Methods. 2007;39:175–91.
47. IBM Corp. IBM SPSS statistics for windows, version 22.0. Armonk: IBM Corp; 2013.
48. Riffenburgh RH. Statistics in medicine. 3rd ed. London: Academic Press; 2012. 49. Walker E, Nowacki AS. Understanding equivalence and noninferiority
testing. J Gen Intern Med. 2011;26:192–6.
50. Kulkarni AP, Agarwal V. Extubation failure in intensive care unit: Predictors and management. Indian J Crit Care Med. 2008;12:1–9.
51. Hart A. Mann-Whitney test is not just a test of medians: differences in spread can be important. BMJ. 2001;323:391–3.
52. Singer P, Blaser AR, Berger MM, Alhazzani W, Calder PC, Casaer MP, et al. ESPEN guideline on clinical nutrition in the intensive care unit. Clin Nutr. 2018;38:48–79.
53. Taylor MJ, McNicholas C, Nicolay C, Darzi A, Bell D, Reed JE. Systematic review of the application of the plan-do-study-act method to improve quality in healthcare. BMJ Qual Saf. 2014;23:290–8.
54. Vos L, Duckers ML, Wagner C, van Merode GG. Applying the quality improvement collaborative methodology to process redesign: a multiple case study. Implement Sci. 2010;5.https://doi.org/10.1186/1748-5908-5-19. 55. Rice TW. Gastric residual volume: end of an era. JAMA. 2013;309:283–4. 56. Juvé-Udina ME, Valls-Miró C, Carreño-Granero A, Martinez-Estalella G,
Monterde-Prat D, Doningo-Felici CM, et al. To return or to discard? Randomised trial on gastric residual volume management. Intensive Crit Care Nurs. 2009;25:258–67.
58. McClave SA, Kushner R, Van Way CW, Cave M, DeLegge M, Dibaise J, et al. Nutrition therapy of the severely obese, critically ill patient: summation of conclusions and recommendations. JPEN J Parenter Enteral Nutr. 2011;35 (suppl 5):88S–96S.
59. Secombe P, Harley S, Chapman M, Aromataris E. Feeding the critically ill obese patient: a systematic review protocol. JBI Database System Rev Implement Rep. 2015;13:95–109.
60. Dickerson RN, Boschert KJ, Kudsk KA, Brown RO. Hypocaloric enteral tube feeding in critically ill obese patients. Nutrition. 2002;18:241–6.
61. Dickerson RN, Medling TL, Smith AC, Maish GO, Croce MA, Minard G, Brown RO. Hypocaloric, high-protein nutrition therapy in older vs younger critically ill patients with obesity. JPEN J Parenter Enteral Nutr. 2013;37:342–51. 62. Berger MM, Pichard C. Understanding the causes of death in INTACT by
Braunschweig et al. JPEN J Parenter Enteral Nutr. 2015;39:144.
63. Puthucheary ZA, Rawal J, McPhail M, Connolly B, Ratnayake G, Chan P, et al. Acute skeletal muscle wasting in critical illness. JAMA. 2013;310:1591–600. 64. Schellekens W-JM, van Hees HWH, Doordiun J, Roesthuis LH, Scheffer GJ, van der Hoeven JG, Heunks LMA. Strategies to optimize respiratory muscle function in ICU patients. Crit Care. 2016;20:103.
65. McClave SA, Weijs PJM. Preservation of autophagy should not direct nutrition therapy. Curr Opin Clin Nutr Metab Care. 2015;18:155–61. 66. Weijs PJM. Fundamental determinants of protein requirement in the ICU.
Curr Opin Clin Nutr Metab Care. 2014;17:183–9.
67. Bear DE, Wandrag L, Merriweather JL, Connolly B, Hart N, MPW C, on behalf of the Enhanced Recovery After Critical Illness Programme Group (ERACIP) Investigators. The role of nutritional support in the physical and functional recovery of critically ill patients: a narrative review. Crit Care. 2017;21:226. 68. Heyland DK, Cahill N, Day AG. Optimal amount of calories for critically ill
patients: depends on how you slice the cake! Crit Care Med. 2011;39:2619–25. 69. Nicolo M, Heyland DK, Chittams J, Sammarco TY, Compher C. Clinical
outcomes related to protein delivery in a critically ill population: a multicenter, multinational observation study. JPEN J Parenter Enteral Nutr. 2015;40:45–51.
70. Sjoding MW, Luo K, Miller MA, Iwashyna TJ. When do confounding by indication and inadequate risk adjustment bias critical care studies? A simulation study. Crit Care. 2015;19.https://doi.org/10.1186/s13054-015-0923-8. 71. Rooyackers O, Rethal MS, Liebau F, Norberg A, Wernerman J. High protein
intake without concerns? Crit Care. 2017;21:106.
72. Hurt RT, McClave SA, Martindale RG, Ochoa Gautier JB, Coss-Bu JA, Dickerson RA, et al. Summary points and consensus recommendations from the international protein summit. Nutr Clin Pract. 2017; 32 (Suppl 1):142S–151S. 73. Lee ZY, Barakatun-Nisak MY, Airini IN, Heyland DK. Enhanced protein-energy
provision via the enteral route in critically ill patients (PEP uP protocol): a review of evidence. Nutr Clin Pract. 2015;31:68–79.