R E S E A R C H
Open Access
What is the value of regional cerebral
saturation in post-cardiac arrest patients?
A prospective observational study
Cornelia Genbrugge
1,2*†, Ward Eertmans
1,2†, Ingrid Meex
2, Margaretha Van Kerrebroeck
2,1, Noami Daems
2,1,
An Creemers
3, Frank Jans
2,1, Willem Boer
2, Jo Dens
4,1and Cathy De Deyne
2,1Abstract
Background:The aim of this study was to elucidate the possible role of cerebral saturation monitoring in the post-cardiac arrest setting.
Methods:Cerebral tissue saturation (SctO2) was measured in 107 successfully resuscitated out-of-hospital cardiac arrest patients for 48 hours between 2011 and 2015. All patients were treated with targeted temperature management, 24 hours at 33 °C and rewarming at 0.3 °C per hour. A threshold analysis was performed as well as a linear mixed models analysis for continuous SctO2data to compare the relation between SctO2and favorable (cerebral performance category (CPC) 1–2) and unfavorable outcome (CPC 3–4–5) at 180 days post-cardiac arrest in OHCA patients.
Results:Of the 107 patients, 50 (47 %) had a favorable neurological outcome at 180 days post-cardiac arrest. Mean SctO2over 48 hours was 68 % ± 4 in patients with a favorable outcome compared to 66 % ± 5 for patients with an unfavorable outcome (p= 0.035). No reliable SctO2threshold was able to predict favorable neurological outcome. A significant different course of SctO2was observed, represented by a logarithmic and linear course of SctO2in patients with favorable outcome and unfavorable outcome, respectively (p< 0.001). During the rewarming phase, significant higher SctO2values were observed in patients with a favorable neurological outcome (p= 0.046).
Conclusions:This study represents the largest post-resuscitation cohort evaluated using NIRS technology, including a sizeable cohort of balloon-assisted patients. Although a significant difference was observed in the overall course of SctO2between OHCA patients with a favorable and unfavorable outcome, the margin was too small to likely represent functional outcome differentiation based on SctO2alone. As such, these results given such methodology as performed in this study suggest that NIRS is insufficient by itself to serve in outcome prognostication, but there may remain benefit when incorporated into a multi-neuromonitoring bedside assessment algorithm.
Keywords:Cerebral saturation, Post-cardiac arrest, Neurological outcome, Neuromonitoring, Targeted temperature management
* Correspondence:Cornelia.genbrugge@uhasselt.be
†Equal contributors
1Faculty of Medicine and Life Sciences, Hasselt University, Martelarenlaan 42,
3500 Hasselt, Belgium
2Department of Anesthesiology, Intensive Care, Emergency Medicine and
Pain Therapy, Ziekenhuis Oost-Limburg Genk, Schiepse Bos 6, 3600 Genk, Belgium
Full list of author information is available at the end of the article
Background
During a cardiac arrest (CA), the brain is exposed to hypoxia resulting in neurological injury and determining survival in the majority of the post-CA patients. The brain is namely a highly aerobic organ with a limited capacity to store energy, necessitating a constant delivery of oxygen and glucose. Regardless of the recent advances in cardiopulmonary resuscitation and post-resuscitation care, neurological injury still remains a major problem. Almost 70 % of patients who die during their hospital stay after out-of-hospital cardiac arrest (OHCA) decease due to post-anoxic neurological injury [1]. This may be explained by the fact that the brain of an OHCA patient is subjected to a sequence of pathophysiological changes during the arrest itself, but also during the return of spon-taneous circulation (ROSC) and in the post-resuscitation phase. First, global ischemia of the brain occurs during the arrest which accounts for the primary neurological injury. Next, after ROSC is achieved a post-CA syndrome de-velops, which is characterized by a short-lasting cerebral hyperemia followed by an increase in cerebrovascular resistance finally resulting in a decrease in cerebral blood flow (CBF) [2]. During this post-CA phase, there is an imbalance between oxygen delivery relative to oxygen requirements, which can last for several hours to days. These pathophysiological changes may cause progressive and irreversible brain injury responsible for the so-called secondary neurological injury. Thus far, targeted temperature management (TTM) is the only treatment with proven efficacy on neurological outcome after OHCA [3, 4].
Current brain monitoring techniques applied in post-CA patients focus on the prediction of cerebral outcome rather than on possible therapeutic implications [5]. Hence, cere-bral hemodynamics could have an influence on outcome in the post-CA phase. Therefore, a better understanding of cerebral hemodynamic disturbances via cerebral monitor-ing could have an impact on the post-CA management. Near-infrared spectroscopy (NIRS) provides information on brain oxygenation by monitoring the regional cerebral oxygen saturation (SctO2) at the microvascular level. It is a non-invasive monitoring tool to measure the difference between oxygenated and deoxygenated hemoglobin in venous, arterial, and capillary blood.
The aim of this study was to improve our knowledge and to elucidate the possible role of non-invasive SctO2 during the first 48 hours after an OHCA (with use of TTM at 33 °C) and to assess its possible relationship to outcome.
Methods
Study population
All comatose survivors after OHCA with presumed cardiac origin treated in our tertiary care hospital
(Ziekenhuis Oost-Limburg, Genk, Belgium) were pro-spectively enrolled between March 2011 and May 2015 (n= 107). Exclusion criteria were patients < 18 years and an obviously non-cardiac cause of OHCA. If a fall was mentioned in the hetero-anamnesis, or if any clinical signs of a fall were present (e.g., bruises) a computed tomog-raphy (CT) scan was performed prior to coronary care unit (CCU) admission. If no clear cause of the arrest was determined at arrival at the emergency department, a head CT scan was performed to exclude cerebral causes of CA. None of the included patients had intracerebral patholo-gies. All patients were treated uniformly according to the institutional post-CA protocol [6]. As part of this protocol, SctO2monitoring was routinely applied on arrival at the CCU. The study protocol was approved by the local med-ical ethics committee (Comité Medische Ethiek Ziekenhuis Oost-Limburg 11/066). Written informed consent was obtained from next of kin.
General management
Our institutional post-CA protocol has been described pre-viously [6]. In summary, all patients were intubated, mech-anically ventilated, and sedated with propofol and remifentanil (if hemodynamically tolerated). Cisatracurium was administered in case of shivering (bolus or continuous infusion). Patients underwent urgent coronary angiography followed by percutaneous coronary intervention when in-dicated. TTM at 33 °C was induced as soon as possible after hospital admission by cold saline (4 °C –30 ml/kg) and was further mechanically induced and maintained in the CCU by endovascular (Icy™catheter, CoolGard® 3000, Alsius, Irvine, CA, USA) or surface (ArcticGel™ pads, Arctic Sun® 5000, Medivance, Louisville, CO, USA) cooling systems at 33 °C for 24 hours. Both systems are equipped with a feedback loop controlling target temperature using an esophageal temperature probe. Esophageal temperature was recorded every minute during hypothermia and rewarming. After rewarming (0.3 °C/hour for 12 hours) sedation was titrated toward patient’s comfort with efforts to minimize sedation. Patients were extubated when their neurological, respiratory and hemodynamic status had recovered sufficiently. During the first 48 hours post-CA, an hourly blood gas was taken.
Cerebral saturation monitoring
both duration and severity of a desaturation below a pre-set SctO2 threshold during the first 48 hours after CA. Since this was an observational study, treatment was guided according to the guidelines of the European Resuscitation Council and was not affected in any way by the collected NIRS data although the SctO2data were not blinded for the treating physician [7].
Hemodynamic monitoring and management
Patients were treated according to the guidelines with the main focus on achieving a mean arterial pressure (MAP) above 65 mmHg [8]. If signs of inadequate circu-lation persisted despite correct fluid resuscitation (wedge pressure >18 mmHg), norepinephrine was infused first with a target MAP of 65 mmHg and subsequently dobu-tamine was given with a target cardiac index of >2.2 l/ min/m2. An intra-aortic balloon pump (IABP) was in-stalled as deemed necessary by the treating physicians. Blood pressures were obtained by a radial artery line while a Swan-Ganz catheter provided information about cardiac output (CO), cardiac index and continuous mixed venous blood oxygen saturation (SvO2).
Outcome measurement
The cerebral performance category (CPC) scale was used to define patient outcome [9–11]. According to the scale classification, CPC 1 indicates good cerebral performance, CPC 2 implies a moderate disability (sufficient for inde-pendent activities in daily life), CPC 3 indicates severe disability (dependent on others), CPC 4 implies coma or vegetative state and CPC 5 stands for death. Neurological performance was assessed at 180 days after the CA.
Statistical methods
Patients’characteristics were compared using Student’st test if normally distributed and expressed as mean ± standard deviation. The chi-square test and Fisher’s exact test (when expected frequency of five or less) were used to compare categorical values. Descriptive statistics were used for continuously measured SctO2 values and are expressed as mean ± standard deviation.
The data as collected are longitudinal in nature: SctO2 was measured repeatedly over time. By aver-aging SctO2values per hours, the data yields 48 mea-surements per patient. To take the longitudinal nature of the data into account, a linear mixed model with a random intercept and a random slope was used [12].
The comparison of the evolution of SctO2 for the survivors versus non-survivors was of primary interest. To take possible confounders into account, an effect of gender and age, together with a quadratic effect of time, and all interactions with gender and survival were con-sidered in a first, elaborated model.
A backward selection procedure was performed to exclude non-significant effects. This resulted in the following model:
Satij ¼ βms0 þb0i
þ βms
1 þb1i
tijþβs2tij
2
þβms
3 agei
þβm
4tijageiþijMale survivors βmn0 þb0i
þ βmn
1 þb1i
tijþβn2tij
2
þβmn
3 ageiþβm4tijagei
þijMale non‐survivors βfs0þb0i
þ βfs
1þb1i
tijþβs2tij
2
þβfs
3ageiþβ f
4tijagei
þijFemale survivors βf n0 þb0i
þ βf n
1 þb1i
tijþβn2tij
2
þβf n
3ageiþβf4tijagei
þijFemale non‐survivors
WhereSatijandtijare SctO2measurement and the cor-responding time of this measurement for patient i on hour j, agei is the age of patient i, and
b0i;b1i
ð ÞeN 0
0 ;
d11 d12
d12 d22
, are the random intercept and
random slope respectively. All parameters in this model were significant, and no further reduction could be ob-tained. Ap value < 0.05 was considered to be statistically significant. Tests were performed using IBM SPSS version 20.00 (IBM Corp., Armonk, NY, USA) and SAS Software version 13.2 (SAS Institute, Cary, NC, USA). Figures were made using GraphPad Prism 5.01 (GraphPad Software, San Diego, CA, USA).
Results
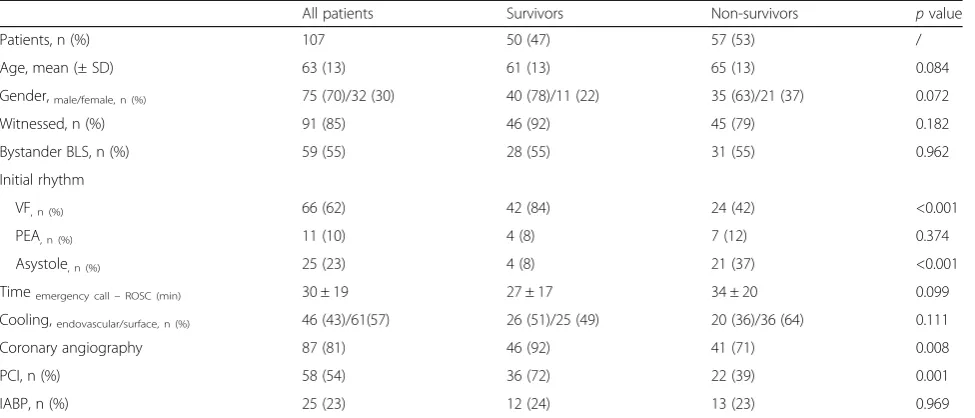
One hundred and seven consecutive OHCA patients were included in this study. Baseline characteristics are summarized in Table 1. Fifty patients (47 %) survived with a good neurological outcome (CPC1–2) at 180 days post-CA. A significant difference in initial rhythm was observed, 84 % of the survivors had ventricular fibrilla-tion in contrast to 41 % of the non-survivors (p< 0.001). Significantly more survivors underwent urgent coronary angiography (92 % versus 71 %,p= 0.008) and received a percutaneous coronary intervention (71 % versus 39 %, p= 0.001). We observed no significant difference in the use of IABP between both groups (p= 0.969). Within the group of survivors, 39 (78 %) patients had a CPC 1 and 11 (22 %) had a CPC 2 at 180 days post-CA. None of the survivors had a CPC 3 or CPC 4. Twelve patients died within 48 hours, with a mean age of 67 years ± 11, of whom four (33 %) were women. The mean SctO2of these patients was 65 % ± 7. In Fig. 1 the course of the hourly mean MAP, arterial oxygen partial pressure (PaO2), arterial carbon dioxide partial pressure (PaCO2), SvO2and lactate during the first 48 hours is shown for survivors and non-survivors.
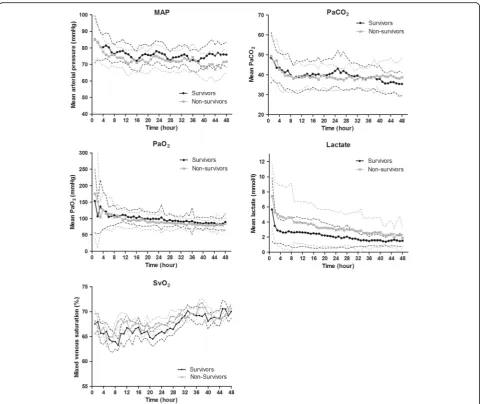
compared to 66 % ± 6 in non-survivors (p= 0.184). The mean SctO2 over 48 hours was significantly higher in the survivors (68 % ± 4) compared to non-survivors (66 % ± 5;p= 0.035). The mean course of SctO2in both groups is given in Fig. 2. An initial decrease was ob-served after initiation of TTM until hour 3 in survivors (-5 % ± 6) and until hour 5 in non-survivors (-3 % ± 12; p= 0.432) followed by a progressive increase in both groups.
The first 48 hours of TTM at 33 °C after CA can be divided in four different phases: the cooling phase, followed by the hypothermia phase at 33 °C, the rewarming phase and finally the normothermia phase. The mean time to target temperature (cooling phase) was 183 min ± 160 in both groups. The hypothermia phase took 21 hours followed by a 12-hour rewarming phase and a 12-hour normothermia phase. The results of the mean SctO2 in each phase are listed in Table 2. We observed a significant difference in the mean SctO2 in the rewarming phase between survivors and non-survivors (70 % ± 1 versus 68 % ± 1, p= 0.046). No significant differences were observed in the other phases.
If SctO2 values during the four different cooling phases were compared between patients with and with-out IABP, a difference was observed during the cooling and hypothermia phase with higher SctO2values in the no-IABP group (p= 0.009 and p= 0.042). In the next two phases, the rewarming (phase 3) and normothermia phase (phase 4), no significant difference in SctO2values was observed between both groups (phase 3 - p= 0.722; phase 4 -p= 0.827).
The area below a preset SctO2 threshold was calcu-lated as well. Receiver operating curve (ROC) analysis revealed the highest area under the curve (AUC) for a SctO2threshold of 55 % (AUC 0.58; specificity 52 % and sensitivity 62 %).
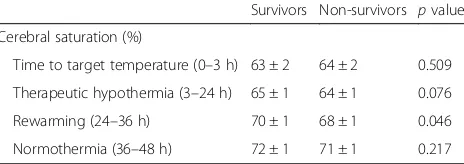
If data were fitted in an optimal mixed model, a significant difference was observed between survivors and non-survivors concerning the course of SctO2 after adjustment for age and gender (p< 0.001) (Fig. 3). Between female survivors and non-survivors we ob-served a significant difference already from the start of TTM at 33 °C with a logarithmic course of SctO2 in the survivors group versus a linear one in the non-survivor group. Male non-survivors and non-non-survivors had initially similar SctO2 values but during induction of hypothermia, SctO2 increased more rapidly in the male survivors (logarithmic) compared to male non-survivors (linear).
Discussion
[image:4.595.57.545.99.308.2]In this study, SctO2 was prospectively monitored in OHCA patients with a presumed cardiac cause during the initial 48 hours after admission to the CCU. This is currently the largest post-resuscitation patient cohort evaluated using SctO2 to prognosticate outcome. In all patients TTM at 33 °C was applied for 24 hours, followed by an active rewarming at 0.3 °C/hour. Within this timeframe, we observed a significant different course of SctO2between survivors (CPC 1–2) and non-survivors (CPC 5). In the rewarming phase, significant higher SctO2 values were observed in patients with a favorable neurological outcome. However, the clinical Table 1Patient demographics
All patients Survivors Non-survivors pvalue
Patients, n (%) 107 50 (47) 57 (53) /
Age, mean (± SD) 63 (13) 61 (13) 65 (13) 0.084
Gender,male/female, n (%) 75 (70)/32 (30) 40 (78)/11 (22) 35 (63)/21 (37) 0.072
Witnessed, n (%) 91 (85) 46 (92) 45 (79) 0.182
Bystander BLS, n (%) 59 (55) 28 (55) 31 (55) 0.962
Initial rhythm
VF, n (%) 66 (62) 42 (84) 24 (42) <0.001
PEA, n (%) 11 (10) 4 (8) 7 (12) 0.374
Asystole, n (%) 25 (23) 4 (8) 21 (37) <0.001
Timeemergency call–ROSC (min) 30 ± 19 27 ± 17 34 ± 20 0.099
Cooling,endovascular/surface, n (%) 46 (43)/61(57) 26 (51)/25 (49) 20 (36)/36 (64) 0.111
Coronary angiography 87 (81) 46 (92) 41 (71) 0.008
PCI, n (%) 58 (54) 36 (72) 22 (39) 0.001
IABP, n (%) 25 (23) 12 (24) 13 (23) 0.969
BLSbasic life support,VFventricular fibrillation,PEApulseless electrical activity,ROSCreturn of spontaneous circulation,PCIpercutaneous coronary intervention,
significant difference we observed in SctO2 course is of unlikely clinical meaning since this information is not available at the bedside, and moreover it is so small that at present clinicians will not be able to use any SctO2 cutoff value to predict outcome.
Experimental studies on CA and outcome revealed that the severity of brain damage is mainly influenced by the duration of the CA and by the mismatch in the oxygen extraction rate (CEO2) to CBF during the post-resuscitation period [13]. A better understanding of cerebral hemodynamic disturbances may have an impact on the post-CA management and may also allow a better prognostication. Monitoring of SctO2 could provide a non-invasive assessment of these cerebral hemodynamic disturbances.
In recent years, several studies investigated whether NIRS could be used during the post-CA stage to assist with the neuroprognostication and as a therapeutic target [6, 14, 15]. Overall, significant higher SctO2were observed at different time points in the post-CA phase between patients with a favorable compared to unfavor-able outcome. Nevertheless, the included patient popula-tions were inhomogeneous (mix of OHCA and in-hospital cardiac arrest (IHCA) patients), rather small in sample size and mean SctO2values over several hours were used.
In our patient cohort, we found the best AUC for a threshold value of 55 %. However, this AUC had a very low sensitivity and specificity. In contrast, Storm et al. found the highest AUC for outcome prediction at a SctO2threshold of 50 % with a far higher sensitivity and Fig. 1Course of hemodynamic parameters, mean arterial pressure, arterial carbon dioxide pressure, arterial oxygen pressure, lactate and mixed venous saturation. In this figure, the course for 48 hours of different hemodynamic parameters is shown as mean ± standard deviation. Overall
pvalues: MAP:p= 0.020; PaCO2:p= 0.842; PaO2:p= 0.370; lactate:p= 0.002; SvO2:p= 0.649.MAPmean arterial pressure,PaCO2arterial carbon
[image:5.595.58.541.86.490.2]specificity (AUC 0.80; specificity 70 % and sensitivity 86 %) [14]. We should remark that they included 60 both IH- and OHCA patients of which 38 % had a good neurological outcome compared to 47 % in our exclu-sively OHCA patient population. In the setting of aortic arch surgery, Fischer et al. showed that the time under SctO2thresholds of 55 %, 60 %, and 65 % was associated with poor outcome [16]. In contrast to the perioperative setting where treatment algorithms are proposed to treat cerebral desaturations, no target SctO2 values are cur-rently recommended in the post-CA phase.
In contrast to previous mentioned studies which applied an hour-by-hour analysis, we performed a linear mixed model analysis using continuous SctO2data to in-vestigate whether the SctO2course over time was differ-ent between survivors versus non-survivors [6, 14, 15]. If all SctO2 values were fitted in a linear mixed model, a significant time effect was observed during the SctO2 course. More specifically, survivors followed a logarith-mic SctO2course over time compared to a more linear one for non-survivors. Based on these findings, it seems possible that the balance between oxygen supply and demand in survivors recovered more rapidly and that non-survivors have longer-lasting disturbances in
cerebrovascular autoregulation. This implies that SctO2in non-survivors could be more dependent on hemodynamic parameters such as MAP, CO, and PaCO2. Despite this significant discordance in time course, which probably in-dicates different underlying pathophysiologic mechanisms between both patient groups, we should take into account that this represents post hoc information, not available at the bedside. The SctO2 course of both, male and female patients with good favorable neurological outcome, follow the same shape compared to the patients with unfavorable outcome. However, the overall course of female survivors is higher compared to the male survivors, which is more or less also the case in the non-survivor group. Bickler et al. observed no difference in gender using the FORE-SIGHT technology to measure cerebral saturation in healthy volunteers [17]. In this way a bias by the used technology can be excluded. In healthy volunteers, re-gional cerebral blood flow is higher in female volunteers compared to male volunteers [18, 19]. In animal studies a greater cerebral cortical blood flow and lower cerebral oxygen extraction ratio was observed after severe cerebral hemorrhage and ventricular fibrillation in females [20]. However, these studies were performed without the use of TTM at 33 °C. All previous described findings might explain the higher observed SctO2in female patients if we assume that TTM at 33 °C has a similar effect on both sexes. Another explanation could be the number of in-cluded female patients, which is only one third of the total included population.
At the initiation of TTM at 33 °C, a decrease in mean SctO2was observed followed by a progressive increase in mean SctO2in both survivors and non-survivors. This de-crease could be explained by the onset of different patho-physiological mechanisms after CA. A period of delayed cerebral hypoperfusion occurs which is associated with an increase in cerebrovascular resistance, a drop in CBF, and cerebral metabolic oxygen consumption [21, 22]. More-over, it has been shown that blood viscosity is higher dur-ing the initial hours after a CA [23–26]. As a significant Fig. 2Cerebral saturation course (mean ± standard deviation). 1 = time
[image:6.595.57.292.86.266.2]to target temperature; 2 = therapeutic hypothermia; 3 = rewarming; 4 = normothermia. SctO2, cerebral tissue oxygen saturation
Table 2Cerebral saturation values phase by phase
Survivors Non-survivors pvalue
Cerebral saturation (%)
Time to target temperature (0–3 h) 63 ± 2 64 ± 2 0.509
Therapeutic hypothermia (3–24 h) 65 ± 1 64 ± 1 0.076
Rewarming (24–36 h) 70 ± 1 68 ± 1 0.046
Normothermia (36–48 h) 72 ± 1 71 ± 1 0.217
Fig. 3Fitted cerebral saturation by linear mixed models. SctO2, cerebral
[image:6.595.305.540.87.218.2] [image:6.595.58.290.649.731.2]negative correlation exists between blood viscosity and the mean flow velocity of the middle cerebral artery, this could explain the observed decrease in SctO2[26]. Third, hemodynamic parameters such as PaCO2, MAP, and CO influence SctO2[27]. Especially our observed decrease in PaCO2(50 mmHg until 40 mmHg) with its subsequent ef-fects on cerebral vasculature and CBF could influence SctO2values [28]. Additionally, we observed a simultan-eous decrease in MAP until 5–6 hours after the induction of TTM at 33 °C together with a decrease in SctO2 sug-gesting an impaired autoregulation. Cerebrovascular autoregulation is known to be disturbed or right shifted after a CA, which can influence SctO2 [21, 29]. Finally, CO, in the initial phase after a CA, is relatively low due to myocardial dysfunction [30]. We observed a decrease in SvO2, and as SvO2is highly correlated with CO, our ob-served decrease in SctO2 can therefore be partially ex-plained by a drop in CO [22, 30–32]. The hemodynamic variability in the initial hours after CA as described above, suggest the presence of a therapeutic window. Therefore, hemodynamic parameters such as MAP and CO could be optimized using an interventional protocol, which may prevent the potential harming cerebral desaturation in the early post-CA hours.
After the initial drop in mean SctO2, a progressive increase in mean SctO2 was observed reaching stable values around hour 12 and 22 in survivors and non-survivors, respectively. This 10-hour delay in SctO2 recovery in non-survivors may implicate once more that brain recovery from ischemia after CA is not similar in survivors versus non-survivors. Since others described a low CEO2together with a gradual increase in mean flow velocity until 48 hours after CA, our observed increase in SctO2 6 hours after the start of TTM at 33 °C is supported by these findings [13, 33]. In addition, TTM at 33 °C induces a leftward shift of the oxygen dis-sociation curve. This results in an enhanced affinity of oxygen to hemoglobin, a phenomenon which may explain the progressive increase in SctO2 as well.
During the rewarming phase, using a rewarming rate of 0.3 °C/hour, we observed significant higher SctO2values in survivors compared to non-survivors (p= 0.046). This finding has probably an influence on the statistical difference we observed in the overall course of SctO2. The optimal rewarming rate in post-CA patients (after TTM at 33 °C) is not known thus far. But both animal and human studies performed during cardiac surgery suggest a detri-mental effect of rapid rewarming at the expense of poten-tial neuroprotective effects of therapeutic hypothermia (TH) [34–37]. Therefore, our results can only indicate that rewarming has a different influence on cerebral hemodynamics in survivors versus non-survivors.
If a sub-analysis is performed comparing patients with and without an IABP, significant higher SctO2values are
observed during cooling and hypothermia in the no-IABP group. This represents probably the higher hemodynamic instability of patients receiving an IABP.
Our study has several limitations. First, we did not assess cerebral hemodynamic parameters by transcranial Doppler. The continuous measurement of both SctO2 and cerebral hemodynamic parameters could have allowed a better understanding of cerebral hemodynamic changes in post-CA patients. Second, SctO2 was mea-sured using NIRS technology on the forehead. This is a regional measurement with the disadvantage that we do not have any information other than the frontal region. The number of patients included was rather limited but as far as we know, this study is currently the largest in which SctO2 is prospectively measured in post-CA patients. Nevertheless, we suppose that extending the number of patients will be of no added value for a better understanding of the underlying pathophysiologic mechanism responsible for the observed SctO2 course. For this purpose, an experimental setting using non-invasive as well as non-invasive cerebral hemodynamic measurements could provide more valuable information. At last, in this study SctO2was measured during TTM at 33 °C. Consequently, these findings might not be applicable to patients treated with TTM at 36 °C. More importantly, significant higher SctO2 values were mea-sured in the favorable neurological outcome group during the rewarming phase, which is absent in post-CA patients treated with TTM at 36 °C.
Conclusion
This study represents the largest post-resuscitation cohort evaluated using NIRS technology, including a sizeable cohort of balloon-assisted patients. Although a significant difference was observed in the overall course of SctO2 between OHCA patients with a fa-vorable and unfafa-vorable outcome, the margin was too small to likely represent functional outcome differen-tiation based on SctO2 alone. As such, these results given such methodology as performed in this study suggest that NIRS is insufficient by itself to serve in outcome prognostication, but there may remain bene-fit when incorporated into a multi-neuromonitoring bedside assessment algorithm.
Abbreviations
AUC:area under the curve; CA: cardiac arrest; CBF: cerebral blood flow; CCU: coronary care unit; CEO2: oxygen extraction rate; CO: cardiac output;
CPC: cerebral performance category; CT: computed tomography; IABP: intra-aortic balloon pump; IHCA: in-hospital cardiac arrest; MAP: mean arterial pressure; NIRS: near-infrared spectroscopy; OHCA: out-of-hospital cardiac arrest; PaCO2: arterial carbon dioxide partial pressure; PaO2: arterial
oxygen partial pressure; ROC curve: receiver operating characteristics curve; ROSC: return of spontaneous circulation; SctO2: cerebral tissue oxygen
saturation; SvO2: mixed venous blood oxygen saturation; TH: therapeutic
Acknowledgements
The authors wish to thank the residents, nursing and medical staff of the coronary care unit of Ziekenhuis Oost-Limburg for their cooperation and support in this study.
Funding
This study is part of the Limburg Clinical Research Program (LCRP) UHasselt-ZOL-Jessa, supported by the foundation Limburg Sterk Merk, Hasselt University, Ziekenhuis Oost-Limburg, and Jessa Hospital.
Authors’contributions
CG was responsible for the study design, study execution, oversight of data management, data analysis, data interpretation, and manuscript writing. WE was responsible for study execution, oversight of data management, data analysis, data interpretation, and manuscript writing. IM was responsible for the conception, study design, study execution and oversight of data management, and critically revised the manuscript. MVK and ND were responsible for data analysis and both critically revised the manuscript. AC was responsible for statistical analyses and critically revised the manuscript. FJ and WB were responsible for study design, interpretation of results, and manuscript editing. JD and CDD were responsible for the conception, study design, study execution, data interpretation, and manuscript editing. All the authors read and approved the final manuscript.
Competing interests
The authors declare that they have no competing interests.
Ethics approval and consent to participate
The study protocol was approved by the local medical ethics committee (Comité Medische Ethiek Ziekenhuis Oost-Limburg, reference number 11/066). Written informed consent was obtained from next of kin.
Author details
1
Faculty of Medicine and Life Sciences, Hasselt University, Martelarenlaan 42, 3500 Hasselt, Belgium.2Department of Anesthesiology, Intensive Care,
Emergency Medicine and Pain Therapy, Ziekenhuis Oost-Limburg Genk, Schiepse Bos 6, 3600 Genk, Belgium.3I-Biostat (CenStat), Hasselt University,
Agoralaan gebouw D, 3590 Diepenbeek, Belgium.4Department of Cardiology, Ziekenhuis Oost-Limburg Genk, Schiepse Bos 6, 3600 Genk, Belgium.
Received: 10 May 2016 Accepted: 26 September 2016
References
1. Dragancea I, Rundgren M, Englund E, Friberg H, Cronberg T. The influence of induced hypothermia and delayed prognostication on the mode of death after cardiac arrest. Resuscitation. 2013;84:337–42.
2. Neumar RW, Nolan JP, Adrie C, Aibiki M, Berg RA, Böttiger BW, et al. Post-cardiac arrest syndrome: epidemiology, pathophysiology, treatment, and prognostication. A consensus statement from the International Liaison Committee on Resuscitation (American Heart Association, Australian and New Zealand Council on Resuscitation, European Resuscitation Council, Heart and Stroke Foundation of Canada, InterAmerican Heart Foundation, Resuscitation Council of Asia, and the Resuscitation Council of Southern Africa); the American Heart Association Emergency Cardiovascular Care Committee; the Council on Cardiovascular Surgery and Anesthesia; the Council on Cardiopulmonary, Perioperative, and Critical Care; the Council on Clinical Cardiology; and the Stroke Council. Circulation. 2008;118:2452–83. 3. Nolan JP, Soar J, Cariou A, Cronberg T, Moulaert VRM, Deakin CD, et al.
European Resuscitation Council and European Society of Intensive Care Medicine Guidelines for Post-resuscitation Care 2015: Section 5 of the European Resuscitation Council Guidelines for Resuscitation 2015. Resuscitation. 2015;95:202–22.
4. Nielsen N, Wetterslev J, Cronberg T, Erlinge D, Gasche Y, Hassager C, et al. Targeted temperature management at 33 °C versus 36 °C after cardiac arrest. N Engl J Med. 2013;369(23):2197–206 doi:10.1056/NEJMoa1310519. Epub 2013 Nov 17.
5. Taccone F, Cronberg T, Friberg H, Greer D, Horn J, Oddo M, et al. How to assess prognosis after cardiac arrest and therapeutic hypothermia. Crit Care. 2014;18:202.
6. Meex I, Dens J, Jans F, Boer W, Vanhengel K, Vundelinckx G, et al. Cerebral tissue oxygen saturation during therapeutic hypothermia in post-cardiac arrest patients. Resuscitation. 2013;84:788–93.
7. Deakin CD, Nolan JP, Soar J, Sunde K, Koster RW, Smith GB, et al. European Resuscitation Council Guidelines for Resuscitation 2010 Section 4. Adult advanced life support. Resuscitation. 2010;81:1305–52. 8. Peberdy MA, Callaway CW, Neumar RW, Geocadin RG, Zimmerman JL,
Donnino M, et al. Part 9: Post-cardiac arrest care: 2010 American Heart Association Guidelines for Cardiopulmonary Resuscitation and Emergency Cardiovascular Care. Circulation. 2010;122:S768–86.
9. Jennett B, Bond M. Assessment of outcome after severe brain damage. Lancet. 1975;1:480–4.
10. Randomized clinical study of thiopental loading in comatose survivors of cardiac arrest. Brain Resuscitation Clinical Trial I Study Group. N Engl J Med. 1986;314:397–403.
11. Safar P. Resuscitation after brain ischemia. In: Grenvik A, Safar P, editors. Brain failure and resuscitation. New York: Churchill Livingstone; 1981. p. 155–84. 12. Verbeke G, Molenberghs G. Linear mixed models for longitudinal data.
1st ed. New York: Springer-Verlag; 2000.
13. Lemiale V, Huet O, Vigué B, Mathonnet A, Spaulding C, Mira J-P, et al. Changes in cerebral blood flow and oxygen extraction during post-resuscitation syndrome. Resuscitation. 2008;76:17–24.
14. Storm C, Leithner C, Krannich A, Wutzler A, Ploner CJ, Trenkmann L, et al. Regional cerebral oxygen saturation after cardiac arrest in 60 patients–a prospective outcome study. Resuscitation. 2014;85:1037–41.
15. Ahn A, Yang J, Inigo-Santiago L, Parnia S. A feasibility study of cerebral oximetry monitoring during the post-resuscitation period in comatose patients following cardiac arrest. Resuscitation. 2014;85(4):522–6. doi:10. 1016/j.resuscitation.2013.12.007. Epub 2013 Dec 19.
16. Fischer GW, Lin H-M, Krol M, Galati MF, Di Luozzo G, Griepp RB, et al. Noninvasive cerebral oxygenation may predict outcome in patients undergoing aortic arch surgery. J Thorac Cardiovasc Surg. 2011;141:815–21.
17. Bickler PE, Feiner JR, Rollins MD. Factors affecting the performance of 5 cerebral oximeters during hypoxia in healthy volunteers. Anesth Analg. 2013;117:813–23.
18. Gur RE, Gur RC. Gender differences in regional cerebral blood flow. Schizophr Bull. 1990;16:247–54.
19. Esposito G, Van Horn JD, Weinberger DR, Berman KF. Gender differences in cerebral blood flow as a function of cognitive state with PET. J Nucl Med. 1996;37:559–64.
20. Semenas E, Nozari A, Sharma HS, Basu S, Rubertsson S, Wiklund L. Sex differences in cerebral injury after severe haemorrhage and ventricular fibrillation in pigs. Acta Anaesthesiol Scand. 2010;54:343–53.
21. Sundgreen C, Larsen FS, Herzog TM, Knudsen GM, Boesgaard S, Aldershvile J. Autoregulation of cerebral blood flow in patients resuscitated from cardiac arrest. Stroke. 2001;32:128–32.
22 Bisschops LLA, van der Hoeven JG, Hoedemaekers CWE. Effects of prolonged mild hypothermia on cerebral blood flow after cardiac arrest. Crit Care Med. 2012;40:2362–7.
23 Ames 3rd A, Wright RL, Kowada M, Thurston JM, Majno G. Cerebral ischemia. II. The no-reflow phenomenon. Am J Pathol. 1968;52:437–53. 24 Chiang J, Kowada M, Ames 3rd A, Wright RL, Majno G. Cerebral ischemia. III.
Vascular changes. Am J Pathol. 1968;52:455–76.
25 Fischer M, Hossmann KA. No-reflow after cardiac arrest. Intensive Care Med. 1995;21:132–41.
26 Bisschops LLA, Pop GAM, Teerenstra S, Struijk PC, van der Hoeven JG, Hoedemaekers CWE. Effects of viscosity on cerebral blood flow after cardiac arrest. Crit Care Med. 2014;42:632–7.
27 Davis DH, Sundt TM. Relationship of cerebral blood flow to cardiac output, mean arterial pressure, blood volume, and alpha and beta blockade in cats. J Neurosurg. 1980;52:745–54.
28 Buunk G, van der Hoeven JG, Meinders AE. Cerebrovascular reactivity in comatose patients resuscitated from a cardiac arrest. Stroke. 1997;28:1569–73. 29 Ameloot K, Genbrugge C, Meex I, Jans F, Boer W, Vander Laenen M, et al.
An observational near-infrared spectroscopy study on cerebral
autoregulation in post-cardiac arrest patients: time to drop“one-size-fits-all” hemodynamic targets? Resuscitation. 2015;90:121–6.
31 Ameloot K, Meex I, Genbrugge C, Jans F, Boer W, Verhaert D, et al. Hemodynamic targets during therapeutic hypothermia after cardiac arrest: a prospective observational study. Resuscitation. 2015;91:56–62.
32 Ameloot K, Meex I, Genbrugge C, Jans F, Malbrain M, Mullens W, et al. Accuracy of continuous thermodilution cardiac output monitoring by pulmonary artery catheter during therapeutic hypothermia in post-cardiac arrest patients. Resuscitation. 2014;85:1263–8.
33 Bisschops LLA, Hoedemaekers CWE, Simons KS, van der Hoeven JG. Preserved metabolic coupling and cerebrovascular reactivity during mild hypothermia after cardiac arrest. Crit Care Med. 2010;38:1542–7. 34 Maxwell WL, Watson A, Queen R, Conway B, Russell D, Neilson M, et al.
Slow, medium, or fast re-warming following post-traumatic hypothermia therapy? An ultrastructural perspective. J Neurotrauma. 2005;22:873–84. 35 Alam HB, Rhee P, Honma K, Chen H, Ayuste EC, Lin T, et al. Does the rate of
rewarming from profound hypothermic arrest influence the outcome in a swine model of lethal hemorrhage? J Trauma. 2006;60:134–46. 36 Kawahara F, Kadoi Y, Saito S, Goto F, Fujita N. Slow rewarming improves
jugular venous oxygen saturation during rewarming. Acta Anaesthesiol Scand. 2003;47:419–24.
37 Lavinio A, Timofeev I, Nortje J, Outtrim J, Smielewski P, Gupta A, et al. Cerebrovascular reactivity during hypothermia and rewarming. Br J Anaesth. 2007;99:237–44.
• We accept pre-submission inquiries
• Our selector tool helps you to find the most relevant journal • We provide round the clock customer support
• Convenient online submission • Thorough peer review
• Inclusion in PubMed and all major indexing services • Maximum visibility for your research
Submit your manuscript at www.biomedcentral.com/submit