R E V I E W
Open Access
The meaning of blood pressure
S. Magder
Abstract
Measurement of arterial pressure is one of the most basic elements of patient management. Arterial pressure is determined by the volume ejected by the heart into the arteries, the elastance of the walls of the arteries, and the rate at which the blood flows out of the arteries. This review will discuss the three forces that determine the pressure in a vessel: elastic, kinetic, and gravitational energy. Emphasis will be placed on the importance of the distribution of arterial resistances, the elastance of the walls of the large vessels, and critical closing pressures in small arteries and arterioles. Regulation of arterial pressure occurs through changes in cardiac output and changes in vascular resistance, but these two controlled variables can sometimes be in conflict.
Keywords:Arterial resistance, Conductance, Critical closing pressure, Cardiac output, Blood flow, Perfusion, Gravitational energy, Elastic energy, Kinetic energy
Background
Blood pressure is one of the most commonly measured clinical parameters and blood pressure values are major determinants of therapeutic decisions. However, interpret-ation of the physiological meaning of blood pressure in an individual patient is not always an easy task. This paper reviews the physical basis and physiological determinants of arterial pressure, and the relationship of arterial pres-sure to tissue perfusion. Some of the issues have been cov-ered in a previous review on blood pressure [1]. The objective of this paper is to provide guidance when con-sidering therapeutic options but it is not possible to give a definitive algorithm with current knowledge.
Physical basis of vascular pressures
Pressure is a force distributed over a surface area and, as such, it has the same units as tension. The term pressure is used instead of tension because tension is determined
Correspondence:sheldon.magder@mcgill.ca
Department of Critical Care, McGill University Health Centre, 1001 Decarie Blvd., Montreal, Quebec H4A 3J1, Canada
in a single direction, whereas pressure can be used over the curved surfaces of vessels and has the units of force per cross-sectional area. Force is the product of mass and acceleration, and the standard unit is a Pascal, which is a newton per square meter. However, vascular pres-sures still most often are measured in length-based units of millimeters of mercury or centimeters of water. This has historical origins. Before the availability of electronic transducers, pressures were measured with columns of water or mercury. The mass of the column is the prod-uct of the volume and density. The density of water is 1 and that of mercury is 13.6 times that of water. The height of a column of fluid is proportional to the volume over the cross-sectional area of the column, and thus has units of length. Pressure, therefore, is proportional to the product of the density of the fluid and the height of the fluid and gives force per cross-sectional area. The force on the column of water, or mercury, is the acceler-ation of the column by gravity. These“length” measure-ments of force are relative, for they depend upon the position on the earth relative to the center of the earth. However, the acceleration due to gravity is similar over all the earth’s earth. It is even only about 0.2% lower at the top of Mt. Everest. Thus, length-based units are still useful for biological measurements. Units of millimeters of mercury (mmHg) are converted to kilopascals by multiplying by 0.13.
Elastic energy
Three types of energy produce arterial pressure: elastic, kinetic, and gravitational. By far the most significant is elastic energy. The volume inside vascular structures stretches their elastic walls and produces a recoil force, which, based on the elastic properties of the structure, cre-ates a pressure. The materials making up vascular struc-tures are not homogenous so that the volume-to-pressure relationship of arterial vessels is not linear and has a con-vex curvilinearity [2–4] (Fig.1). Resistance to stretch of a substance is called elastance and the inverse, the ease of stretch, compliance. Normal blood flow is pulsatile be-cause of the cyclic nature of cardiac emptying and filling. The consequent cyclic changes in the volume of the aorta
produce the cyclic changes in arterial pressure. Although the elastance of the wall of arterial vessels varies with vol-ume, over short periods of time the actual curvilinear rela-tionship of volume to pressure is constant because it is determined by the composition of the vascular wall [2,4]. Changes in this curvilinear relationship of aortic elastance require changes in the matrix of the wall which do not occur acutely, but rather occur over time with chronic processes such as long-standing hypertension and aging.
Pressure must be measured relative to a reference value which is defined as zero. Most often the reference for zero pressure is atmospheric pressure because this is the pres-sure that surrounds the body. The prespres-sure inside a vessel relative to the pressure outside a vessel gives the pressure that distends the wall of the vessel and is called transmural pressure. For example, if the outside atmospheric pressure is called zero and the pressure inside the aorta is 120/ 80 mmHg, the transmural pressure simply is 120/80 mmHg. However, if atmospheric pressure is 760 mmHg, the real pressure across the arterial wall relative to absolute zero pressure is 880/840 mmHg, but if this absolute value were to be used to determine if transmural pressure changed, one would have to first determine if atmospheric pressure had changed!
Tension across vessel walls often is calculated with use of the Laplace relationship and the value of pressure in-side the vessel relative to atmospheric pressure. How-ever, the Laplace relationship assumes that the wall is
very thin relative to the radius of the structure, as is the case of a soap bubble [5]. Thus, although commonly used, this simplification is not valid for vascular struc-tures and the full equation for the assessment of wall tension must be used with the pressure values relative to absolute zero pressure [6,7]. When tension is calculated this way, the tension across the wall is a negative value in most vessels, which means that vessels are tending to explode rather than collapse, and wall tensions are actu-ally more or less negative values.
Kinetic energy
The second force determining arterial pressure is kinetic energy, which is due to the velocity of the flowing blood [8]. Kinetic energy is equal to the product of one half the mass (m) of the blood, which is the product of the volume and density of the blood, and the square of blood velocity (v):
Kinetic energy¼ 1=2 mv2:
[image:2.595.57.537.88.327.2]vessels because the velocity of blood is similar to that in the large arteries, whereas the elastic energy is much smaller.
Kinetic energy can produce some confusing results, in-cluding blood seeming to flow from a lower to a higher pressure and the appearance that blood is flowing uphill! This occurs because flow is based on the total energy difference across a system, and not just the difference in elastic energy. Examples of this occur when sections of vessels either widen or narrow. Figure 2 shows an ex-ample of an aneurysmal dilatation of a vessel. Pressure is measured with a fluid filled catheter with the opening fa-cing the oncoming flow, as is the practice with most ar-terial catheters, and another catheter that has an opening perpendicular to the flow (side pressure). Flow in L/min must be the same in each section of the vessel because what goes in must go out to maintain conserva-tion of mass. However, in the region of the aneurysmal dilatation where the diameter is much larger, velocity is much slower because the cross-sectional area changes with the square of the radius. Energy cannot be created nor destroyed so the decrease in kinetic energy is con-verted into elastic energy. This increases the pressure on the wall of the dilated area and leads to further dilatation and a further increase in pressure on the already weak-ened wall until the wall stretches to a critical value and ruptures. In the vessel segment distal to the aneurysm, the velocity is again higher and elastic energy is con-verted back into kinetic energy so that it looks like blood
is flowing from an area of lower pressure to an area of higher pressure when a catheter facing the flow is used.
Kinetic energy likely has a greater role in septic pa-tients with high cardiac outputs, for the higher flow means that there is a greater kinetic component and, at the same time, elastic energy is decreased by the vaso-dilation. This will produce a difference between pressure measured with intravascular catheters facing the flow and the pressure measured with a non-invasive device which only measures the lateral elastic component of energy. Furthermore, the decreased lateral elastic force could alter myogenic responses whereas the increased velocity in small vessels will alter shear stress and the two could alter proper matching of flow to the tissue’s metabolic needs.
Gravitational energy
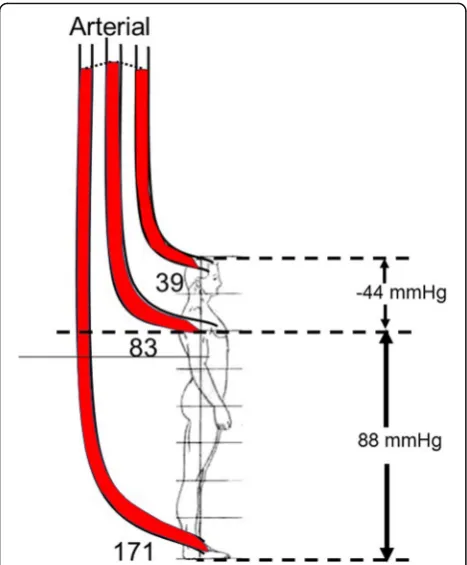
The importance of the gravitational component of the energy for blood flow is important when pressure is measured with a fluid filled system. This is because the position of the transducer and the choice of the refer-ence level have a large impact on the measured value and it is essential that the reference level is standardized. The gravitational effect on the body is very significant in the upright position. For example (Fig. 3), in a person who is 182 cm tall, and who has a systolic pressure of 110/70 mmHg and mean pressure of 83 mmHg mea-sured at the level of the heart, the pressure meamea-sured with a transducer placed at the top of the head is only
[image:3.595.58.540.451.664.2]about 66/26 mmHg with a mean of 39 mmHg. On the other hand, if the transducer is placed at the level of the foot, the pressure would be 198/158 mmHg and a mean of 171 mmHg. It is worth noting that normal pressures for brain perfusion in the upright posture are much below clinically recommended targets but we do not need norepinephrine to walk around!
Gravitational energy is not a large factor for assess-ment of arterial pressure in the supine position, but it still is a significant factor for venous return because ven-ous pressures are low, and the pressure difference be-tween the region of systemic venous compliance and the right atrium is in the range of only 4 to 8 mmHg, which is about 6 to 11 cm of height. This can produce differ-ences in venous return in the supine and prone positions and consequently in cardiac output [9].
Determinants of arterial pressure
The main determinant of arterial pressure is the stretch of the walls of the arteries by the volume they contain. This volume increases in systole because inflow exceeds
outflow and falls after the peak of ejection because out-flow exceeds inout-flow. The outout-flow is dependent upon the resistance emptying the arterial tree and the elastance of the vessel walls. The product of the inverse of elastance (compliance) and the downstream resistance gives the time constant of emptying of the arterial vessels. The time constant is the time it takes to get to 63% of a new steady state after a step change in flow or pressure. Time constants are important in pulsatile systems because they set the amount of filling and emptying of aortic vol-ume that can occur based on the cardiac frequency, the proportions of contraction and relaxation times during systole, and the diastole time.
Resistances
Resistance to flow in a tube is given by Poiseuille’s law, which says that, in a tube with laminar flow, the resistance, which is the frictional loss of energy, is determined by the length of the tube, the viscosity of the blood, and the in-verse of the radius of the tube raised to the fourth power [4]. Vessel radius is thus the dominant determinant of re-sistance and the only factor that can significantly change rapidly. The total resistance of tubes in series is determined by summing up all the individual resistances in the series; in contrast, the sum of parallel resistances is determined by:
1/Rtotal = 1/R1 + 1/R2 + 1/R3…1/Rn
This is because the greater the number of parallel channels, the greater the overall cross-sectional area, and the greater the overall effective radius. Resistances vary among different vascular beds. Factors include the size of the vascular bed and the density of vessels. Be-cause of their sizes, the splanchnic and muscle beds have overall low vascular resistances. However, when flows are related to the mass of tissue, muscle tissue has a high baseline resistance because the flow per mass is low. The importance of this is that the change in flow in dif-ferent vascular beds with a fall in arterial pressure de-pends upon the slope of the pressure–flow line in that region [1]. The steeper the slope of the relationship, the greater the fall in flow for a given decrease in pressure. The kidney starts with a very steep pressure–flow rela-tionship, whether assessed by mass or as a proportion of total body cardiac output, and it has a small capacity to dilate further [10] (Fig.4).
The important factor in assessing the reserves of flow in a vascular region is the maximum slope of the re-gional pressure–flow line because this indicates the physical limit to flow at a given pressure (Fig.4). Coron-ary blood flow can increase fivefold above the flow at a resting heart rate of 70 beats per minute. Thus, at low heart rates, the heart has very large blood flow reserves, which allow the heart to tolerate large decreases in arter-ial pressure. However, this is not true when there is a fixed coronary obstruction that limits the decrease in Fig. 3Gravitation effect on arterial pressures (adapted from [9]). The
[image:4.595.57.291.87.370.2]coronary resistance. On the other hand, the capacity to increase the slope of the pressure–flow relationship in the kidney is limited, which makes the kidney very sensi-tive to decreases in blood pressure.
Critical closing pressure
Resistance to flow through a tube is calculated as the dif-ference between the upstream and downstream pressures, divided by the flow between the two pressures. Accord-ingly, systemic vascular resistance typically is calculated as the difference between aortic mean pressure and the right atrial pressure, or central venous pressure, which usually are the same. This calculation assumes that the vascular system functions as a continuous tube, but this is not true. Most tissues have critical closing pressures at the level of the arterioles. These are also called vascular waterfalls or Starling resistors [11]. The presence of a critical closing pressure creates the same phenomena that exist in veins when the pressure inside a vessel is less than the pressure outside, but in arterioles flow limitation likely is created by the flow characteristics in small vessels without true collapse. When waterfall-like properties exist, the down-stream pressure no longer effects flow, and arterial resist-ance should be calculated from mean arterial pressure to the critical closing pressure, and not to the right atrial pressure. Animal studies suggest that the average critical closing pressure for the whole circulation is around 30 mmHg [12] but the critical closing pressure differs among vascular beds [13]. For example, in resting skeletal muscle the critical closing pressure was estimated to be over 60 mmHg [14]. In the coronary circulation the crit-ical closing pressure likely is in the range of 15 to
25 mmHg under baseline conditions [15]. Unfortunately, mean arterial critical closing pressure currently cannot be assessed in an intact person either for the whole body or in local regions.
[image:5.595.60.539.87.289.2]The arteriolar critical closing pressure is increased by a decrease in the carotid sinus pressure and alpha-adrenergic agonists [16, 17]. It is decreased by increased arterial pressure through the myogenic response [18] and by cal-cium channel blockers [19]. It also decreases with reactive hyperemia and exercise-induced hyperemia [14, 20], indi-cating that it also responds to local metabolic activity.
Cardiac-aortic coupling
The main determinant of the stroke volume by the eject-ing heart is the pressure at which the aortic valve opens, because this is the pressure at which heart muscle begins to shorten with a quasi-isotonic contraction (Fig. 5). When the aortic valve opens, the left ventricle is not yet at peak systolic elastance, and ejection continues until maximal left ventricular elastance is reached [21, 22]. Maximum ventricular elastance, i.e., the slope of the end-systolic pressure–volume line, is only a property of the heart and it is not a function of the load on the heart. The slope of this relationship is the same whether the heart contracts isometrically or isotonically [21]. The diastolic pressure at which the aortic valve opens is a function of the volume that is still in the aorta at the end of diastole. That volume is determined by a composite of factors: the amount of volume that was put into the aorta during the previous systole, the time allowed for the vol-ume to empty, which is dependent upon the length of dia-stole, the downstream arterial resistance, the critical closing pressures in small arteries or arterioles, and aortic elastance. The resistance and compliance (inverse of
elastance) of the aortic wall determine the time constant of arterial emptying and the volume left in the aorta at the end of each cycle. An increase in true aortic elastance (i.e., the shape and position of the whole curve; Fig.1) is im-portant because it is a determinant of the diastolic pres-sure at which the aortic valve opens, the shape of the pulse pressure, and the speed of the forward and back-ward pressure waves in the aorta [23,24]. Ultimately, the final value of arterial pressure is set by the strong regula-tory mechanisms that ensure that cardiac output and the return of blood to the heart match metabolic needs and as adjustments in vascular resistance and regional critical closing pressures to maintain a constant arterial pressure. This means that arterial pressure should not be consid-ered in isolation.
Dynamic elastance
Dynamic elastance has recently become popular. It is ar-gued that it can be a useful measure for assessing the coupling of the heart and circulation [25–28]. It is de-rived from concepts introduced by Sunagawa and co-workers [29, 30], who attempted to derive an equa-tion that relates stroke volume to the mechanical prop-erties of the ventricle and vascular system. Their equations predicted stroke volume based on derived aor-tic and ventricular elastances. Unappreciated require-ments were that ventricular diastolic pressure was considered to be on the flatter part of the ventricular diastolic filling curve, and that heart rate was constant, neither of which can be assured in the intact circulation. When these assumptions are true, the prediction of stroke volume from the formula essentially represented the ascending portion of a cardiac function curve with a constant heart rate, contractility, and afterload.
The term dynamic elastance currently used by investi-gators [26–28, 31] is based on the ratio of respiratory variation in pulse pressure that occurs with each positive pressure breath as a percentage of the mean pressure di-vided by the corresponding change in stroke volume as a percentage of the mean change during the breath. This makes for a very complex measure. True elastance can only be assessed in a static state by increasing or de-creasing volume in an elastic structure by a known amount with no flow and then observing the change in pressure. Elastance is also different in the thoracic and abdominal aorta and in the different large vessels [32]. The total elastance is determined by the sum of the elas-tances of all the arterial vascular segments.
When flow is present, especially pulsatile flow, there are also resistance and kinetic components to this dy-namic measure. A further problem is the curvilinear shape of the aortic volume–pressure relationship. Be-cause of this shape, the change in pressure with a change in volume is greater at higher initial volumes because Fig. 5Pressure versus volume relationship of the left ventricle. The
[image:6.595.57.289.464.674.2]the volume is moving up the steeper part of the relation-ship, but the actual shape of the relationship itself is constant over short periods of time. It can become stiffer over time with increases in age and hypertension (Fig.1). The clinically obtained “dynamic” elastance is not a static measurement and is dominated by changes in ar-terial resistance [29], the critical closing pressure, and, to some extent, the position on the arterial volume– pres-sure curve. Since the dynamic elastance term uses cyclic respiratory challenges to produce changes in pulse pres-sure and stroke volume, the changes likely are occurring mainly through the changes in return of blood to the right heart and to some extent by changes in loading of the right heart with lung inflation. This means that this measurement is affected by changes in blood volume, the size of the change in pleural pressure, and the change in transpulmonary pressure. Heart rate too is a factor because the length of diastole is a determinant of the volume that remains in the aorta at the end of dia-stole and thus a determinant of where the arterial vol-ume is on the elastance curve [33]. It also is affected by the emptying of the pulmonary venous reserves during the respiratory cycle [34]. The respiratory rate and length of inspiration and expiration add other factors. It is thus not surprising that dynamic elastance does not always act as expected [31] and at best may reflect gen-eral patterns. It is likely preferable to just examine the change in stroke volume, cardiac output, and blood pressure that were used to derive the measurement to interpret the response to a therapy.
Regulation of arterial pressure
Arterial pressures in all mammals from mice to humans is in the same range and blood pressure is one of the body’s most tightly regulated variables. The feedback control is remarkable. A young male exercising to near maximum aerobic capacity can increase cardiac output fivefold or more but mean arterial pressure does not change or even slightly decreases. For this to occur, ar-terial resistance must decrease by more than 80%. This tight regulation of arterial pressure occurs primarily through baroreceptor regulation, but regional myogenic mechanisms and metabolic activity also contribute to local autoregulation. Flow-mediated adjustments also occur, by which increased flow produces a decrease in downstream vascular resistance by the release of nitric oxide from the endothelium [35].
The tight control of blood pressure raises the physio-logical question as to why this evolved and why is arter-ial pressure much higher in mammals and birds than in all other species? The high arterial pressure is not neces-sary for baseline flow because the full cardiac output goes from the right to left heart through the lungs with
a mean pressure of only 10 to 15 mmHg. Pulmonary ar-terial pressure remains low at peak exercise even with a fivefold increase in cardiac output. There are two main advantages for our high systemic arterial pressures. First, by keeping arterial pressure relatively constant, regional flows can change by altering regional arterial resistances according to regional needs for flow, without a change in aortic pressure. This works much like opening taps in your house, which allows a common pressure head to allow water to flow into the sink, bathtub, or toilet. The alternative way to increase flow to a region, such as the working muscle, would be to increase blood pressure by increasing the resistance in every vascular region except for the one that needs more flow. This obviously is a much more complex process than simply dilating one region and would have major consequences for regions that did not need more flow. It also would mean that the initial low arterial pressure would have to increase when there is a regional need for more flow, and this would increase the strain on the heart. This brings up a second advantage for having a high baseline arterial pressure. Because mean aortic pressure changes little with changes in regional flows or cardiac output, the load on the heart is relatively constant. This is important because the heart tolerates pressure loads much less well than volume loads (i.e., volume ejected) so that by hav-ing a relatively constant pressure, the load on the heart is relatively constant.
Autoregulation
It often is argued that ideal targets for perfusion pressure should be in the range of normal autoregulated blood flow [13]. This is defined as the pressure range in which flow does not change with increases or deceases in pressure [36]. Maintenance of flow with changes in arterial pressure can occur through four general mechanisms that regulate vascular resistance and regional critical closing pressures: neuro-humeral, myogenic, metabolic, and flow-mediated processes. However, the range of autoregulated flow, the mechanisms that regulate autoregulation in a tissue, the effects of drugs, the effects of disease, and the effects of central nervous activity differ among vascular beds and cannot be generalized.
systemic vascular resistance dominate the normal regula-tion of arterial pressure. Regularegula-tion of systemic vascular resistance first occurs through neural mechanisms that provide afferent feedback to the medullary cardio-in-hibitory and cardio-stimulatory regions that regulate vascular tone by sending efferent signals through para-sympathetic and para-sympathetic pathways, and to some extent through humoral signals, to maintain the cen-trally set pressure.
The relationship of blood flow to metabolic need for the whole body is dominated by tissues that can greatly increase their oxygen needs, which are skeletal and car-diac muscle. In these tissues, as is the case for the whole body, there is a linear relationship between blood flow and oxygen consumption, indicating that the primary regulator of blood flow is metabolic activity. This strong metabolic coupling can override neural-mediated vaso-constriction. Metabolic activity likely plays an important role in the brain, too; however, the limited space in the skull means that increased volume and pressure must be controlled, likely by the myogenic process.
The two dominantly controlled cardiovascular variables, systemic arterial blood pressure and cardiac output rela-tive to metabolic need, can be in conflict. A fall in arterial pressure with a normal cardiac output requires an in-crease in systemic vascular resistance to restore arterial pressure, but the rise in arterial resistance increases the load on the left ventricle, which could lead to a decrease in cardiac output. The hypotension would be fixed, but tissue perfusion would not. If the increase in vasoconstric-tion also increases venous resistance, cardiac output would fall even more [37]. If the fall in arterial pressure occurs because of a decrease in cardiac output, an increase in arterial resistance in all vascular beds will restore blood pressure, but not regional organ blood flows. The hope when a pure vasoconstrictor drug is used is that local metabolic activity will override the constricting effect of the drug in critical vascular beds such as the brain and heart so that these regions will receive a greater propor-tion of the available flow. How much this occurs likely de-pends upon the ability of these regions to modify the generalized vasoconstriction through their local signals, and likely also is affected by the receptor density for the vasoconstricting drug. Very high doses may just constrict all regions non-discriminately. The clinically important point is that if tissue perfusion is low, a treatment must increase cardiac output without a change in arterial pressure and not overwhelm regional mechanisms that match flow to tissue needs. This type of strategy re-quires some measure of blood flow or indirect mea-sures of tissue perfusion such as lactate and central venous saturation as well as clinical indicators such as wakefulness, skin temperature and color, and urine out-put when the kidneys are working.
Baroreceptor-induced vasoconstriction is greater in peripheral vascular beds, which are primarily muscle tis-sue, than in the splanchnic bed [38, 39]. This shifts the distribution of blood flow to the splanchnic bed. By itself this would result in a decrease in cardiac output and a further decrease in blood pressure because volume accu-mulates in the very compliant splanchnic vasculature [40, 41]. However, the effect of this redistribution is compensated for by a decrease in the capacitance in the splanchnic bed (recruitment of unstressed into stressed volume) and a decrease in splanchnic venous resistance at the same time as the arterial resistance to the splanch-nic bed increases [39]. It is likely that infused vasocon-strictors also affect the peripheral vasculature more than the splanchnic bed, but at higher doses the difference may no longer be active and these drugs may then alter the normal distribution of resistances. If the vasocon-strictor cannot recruit more unstressed volume because there are insufficient reserves, and constricts venous re-sistance, cardiac output and tissue perfusion will fall. Tissues need flow and not pressure unless they can se-lectively dilate. This is what happens in most cases when phenylephrine is given; arterial pressure rises but cardiac output falls [37,42]. In contrast, norepinephrine in mod-erate doses does not increase venous resistance and also produces a moderate increase in cardiac function [43]. Again, monitoring perfusion or cardiac output can be helpful to know what is happening.
The fourth factor regulating local blood flow is flow-mediated dilatation. This provides a feed-forward process and decreases the downstream resistance when flow increases [44]. It primarily is mediated by release of nitric oxide (NO) through the effect of shear stress on vascular endothelial cells [45]. This mechanism would spiral out of control if something else does not happen because the decrease in downstream resistance would result in more flow, more release of NO, greater flow, and so on. It is typical of nature to drive with her foot on the gas and brake at the same time; consider simul-taneous parasympathetic and sympathetic nerve activ-ities and the cardio-inhibitory and cardio-stimulatory centers in the brain. In this case the brakes are the local myogenic and central neuro-humeral mechanisms, as well as local metabolic needs. The advantage to such a process is that it allows rapid adaptation to increased needs for flow and fine tuning of the matching of flow to local metabolic activity. Flow-mediated dilatation is lost when the endothelium is damaged in vascular dis-ease and contributes to further vascular damage.
oxygen consumption, because dilatation and oxygen ex-traction are maximal. When this limit is reached, the only treatments that can help tissue perfusion are an in-crease in cardiac output or constriction of some other region, but constriction of these other regions would compromise their function. This means that organs can-not be considered in isolation and the reserves of the whole system need to be considered.
Conclusions
Mean arterial pressure is determined by cardiac output, systemic vascular resistance, and a critical closing pres-sure at the level of the arterioles. Each of these factors is controlled by mechanisms that work at the level of the whole organism, but also interact with important local regulatory mechanisms. Arterial pulse pressure brings in another set of variables which are related to the elas-tance of the aortic wall, the volume of blood in the aorta, the cardiac frequency, and the proportion of time in systole and diastole. Because of the complexities of these interactions, it is not possible to make simple pre-dictions of the response to vasopressor therapies. This becomes even more complicated when pathologies are added that alter the potential of vessels to respond, or because there are fixed obstructions to flow. Only em-piric studies can determine the best approach for the management of hypotension and hypoperfusion. Finally, it must be remembered that what counts for tissues is blood flow and not the arterial pressure and, even more importantly, the matching of flow to metabolic needs. The body does this masterfully through multiple coun-teracting control mechanisms. It is very unlikely that a single therapeutic agent can match the naturally occur-ring well-orchestrated control mechanisms.
Abbreviations
cm:Centimeter; L: Liter; m: Mass; mmHg: Millimeter of mercury; Rn: Segment
resistance; RTotal: Total resistance; v: Velocity (L/sec)
Author’s contributions
The author read and approved the final manuscript.
Consent for publication
Not applicable.
Competing interests
The author declares that he has no competing interests.
Publisher’s Note
Springer Nature remains neutral with regard to jurisdictional claims in published maps and institutional affiliations.
Received: 29 January 2018 Accepted: 27 August 2018
References
1. Magder SA. The highs and lows of blood pressure: toward meaningful clinical targets in patients with shock. Crit Care Med. 2014;42(5):1241–51. 2. Dobrin PB. Mechanical properties of arteries. Physiol Rev. 1978;58(2):397–460.
3. Roach MR, Burton AC. The reason for the shape of the distensibility curves of arteries. Can J Biochem Physiol. 1957;35(8):681–90.
4. Burton AC. The vascular bed. Physiology and biophysics of the circulation. Chicago: Year Book Medical Publishers Inc.; 1965. p. 61–92.
5. Burton AC. On the physical equilibrium of small blood vessels. Am J Physiol. 1951;164:319–29.
6. Azuma T, Oka S. Mechanical equilibrium of blood vessel walls. Am J Physiol. 1971;221:1210–318.
7. Oka S, Azuma T. Physical theory of tension in thick-walled blood vessels in equilibrium. Biorheology. 1970;7:109–17.
8. Burton AC. Total fluid energy, gravitational potential energy, effects of posture. physiology and biophysics of the circulation: an introductory text. Chicago: Year Book Medical Publishers Inc.; 1965. p. 95–111.
9. Magder S. Is all on the level? Hemodynamics during supine versus prone ventilation. Am J Respir Crit Care Med. 2013;188(12):1390–1.
10. Magder SA. Pressure-flow relations of diaphragm and vital organs with nitroprusside-induced vasodilation. J Appl Physiol. 1986;61:409–16. 11. Permutt S, Riley S. Hemodynamics of collapsible vessels with tone: the
vascular waterfall. J Appl Physiol. 1963;18(5):924–32.
12. Sylvester JL, Traystman RJ, Permutt S. Effects of hypoxia on the closing pressure of the canine systemic arterial circulation. Circ Res. 1981;49:980–7. 13. Kato R, Pinsky MR. Personalizing blood pressure management in septic
shock. Ann Intensive Care. 2015;5(1):41.
14. Magder S. Starling resistor versus compliance. Which explains the zero-flow pressure of a dynamic arterial pressure-flow relation? Circ Res. 1990;67:209–20. 15. Bellamy RF. Diastolic coronary artery pressure-flow relations in the dog. Circ
Res. 1978;43(1):92–101.
16. Shrier I, Hussain SNA, Magder S. Effect of carotid sinus stimulation on resistance and critical closing pressure of the canine hindlimb. Am J Physiol. 1993;264:H1560–H6.
17. Shrier I, Magder S. NG-nitro-L-arginine and phenylephrine have similar effects on the vascular waterfall in the canine hindlimb. Am J Physiol. 1995; 78(2):478–82.
18. Shrier I, Magder S. Response of arterial resistance and critical closing pressure to change in perfusion pressure in canine hindlimb. Am J Physiol. 1993;265:H1939–H45.
19. Shrier I, Magder S. The effects of nifedipine on the vascular waterfall and arterial resistance in the canine hindlimb. Am J Physiol. 1995;268:H372–H6. 20. Shrier I, Magder S. Effects of adenosine on the pressure-flow relationships in
an in vitro model of compartment syndrome. J Appl Physiol. 1997;82(3):755–9. 21. Sagawa K. The ventricular pressure-volume diagram revisited. Circ Res. 1978;
43:677–87.
22. Suga H, Saeki Y, Sagawa K. End-systolic force-length relationship of nonexcised canine papillary muscle. Am J Phys. 1977;233(6):H711–H7. 23. Guarracino F, Baldassarri R, Pinsky MR. Ventriculo-arterial decoupling in
acutely altered hemodynamic states. Crit Care. 2013;17(2):213. 24. Wang JJ, O'Brien AB, Shrive NG, Parker KH, Tyberg JV. Time-domain
representation of ventricular-arterial coupling as a windkessel and wave system. Am J Physiol Heart Circ Physiol. 2003;284(4):H1358–68.
25. Monge Garcia MI, Gil Cano A, Gracia Romero M. Dynamic arterial elastance to predict arterial pressure response to volume loading in preload-dependent patients. Crit Care. 2011;15(1):R15.
26. Cecconi M, Monge Garcia MI, Gracia Romero M, Mellinghoff J, Caliandro F, Grounds RM, et al. The use of pulse pressure variation and stroke volume variation in spontaneously breathing patients to assess dynamic arterial elastance and to predict arterial pressure response to fluid administration. Anesth Analg. 2015;120(1):76–84.
27. Garcia MI, Romero MG, Cano AG, Aya HD, Rhodes A, Grounds RM, et al. Dynamic arterial elastance as a predictor of arterial pressure response to fluid administration: a validation study. Crit Care. 2014;18(6):626. 28. Pinsky MR. Defining the boundaries of bedside pulse contour analysis:
dynamic arterial elastance. Crit Care. 2011;15(1):120.
29. Sunagawa K, Maughan WL, Burkhoff D, Sagawa K. Left ventricular interaction with arterial load studied in isolated canine ventricle. Am J Phys. 1983;245(5 Pt 1):H773–80.
30. Sunagawa K, Maughan WL, Sagawa K. Optimal arterial resistance for the maximal stroke work studied in isolated canine left ventricle. Circ Res. 1985; 56(4):586–95.
32. Nakashima T, Tanikawa J. A study of human aortic distensibility with relation to atherosclerosis and aging. Angiology. 1971;22(8):477–90.
33. Maughan WL, Sunagawa K, Burkhoff D, Graves WL Jr, Hunter WC, Sagawa K. Effect of heart rate on the canine end-systolic pressure-volume relationship. Circulation. 1985;72(3):654–9.
34. Magder S, Guerard B. Heart-lung interactions and pulmonary buffering: lessons from a computational modeling study. RespirPhysiol Neurobiol. 2012;182(2–3):60–70.
35. Moncada S, Higgs A. The L-arginine-nitric oxide pathway. N Engl J Med. 1993;329(27):2002–12.
36. Johnson PC. Autoregulation of blood flow. Circ Res. 1986;59:483–95. 37. Magder S. Phenylephrine and tangible bias. Anesthesia Analgesia. 2011;
113(2):211–3.
38. Hainsworth R, Karim F, McGregor KH, Rankin AJ. Effects of stimulation of aortic chemoreceptors on abdominal vascular resistance and capacitance in anaesthetized dogs. J Physiol. 1983;334:421–31.
39. Deschamps A, Magder S. Baroreflex control of regional capacitance and blood flow distribution with or without alpha adrenergic blockade. J Appl Physiol. 1992;263:H1755–H63.
40. Magder S. Volume and its relationship to cardiac output and venous return. Crit Care. 2016;20:271.
41. Krogh A. The regulation of the supply of blood to the right heart. Skand Arch Physiol. 1912;27:227–48.
42. Thiele RH, Nemergut EC, Lynch C III. The physiologic implications of isolated alpha 1 adrenergic stimulation. Anesth Analg. 2011;113(2):284–96. 43. Datta P, Magder S. Hemodynamic response to norepinephrine with and
without inhibition of nitric oxide synthase in porcine endotoxemia. Am J Resp Crit Care Med. 1999;160(6):1987–93.
44. Furchgott RF, Zawadzki JV. The obligatory role of endothelial cells in the relaxation of arterial smooth muscle by acetylcholine. Nature. 1980;288:373–6. 45. Moncada S. The L-arginine:nitric oxide pathway. Acta Physiol Scand. 1992;


![Fig. 4 Flow vs pressure for kidney (thewith vasodilation. The heart starts with a much flatter flow vs pressure line but can increase fivefold in the pressure range of 70left) and heart (right) based on data from hemorrhaged dogs [11]](https://thumb-us.123doks.com/thumbv2/123dok_us/8346549.307772/5.595.60.539.87.289/pressure-thewith-vasodilation-pressure-increase-fivefold-pressure-hemorrhaged.webp)
![Fig. 5 Pressure versus volume relationship of the left ventricle. Theseries of lines with increasing slopes indicate the time-varying elastanceof the aorta as described by Sagawa and colleagues [22]](https://thumb-us.123doks.com/thumbv2/123dok_us/8346549.307772/6.595.57.289.464.674/pressure-relationship-ventricle-theseries-increasing-elastanceof-described-colleagues.webp)
