ClimateXChange is Scotland’s Centre of Expertise on Climate Change, supporting the Scottish Government’s policy development on climate change mitigation, adaptation and the transition to a low carbon economy. The centre delivers objective, independent, integrated and authoritative evidence in response to clearly specified policy questions.
Potential for the use of TIMES in assessing
energy system impacts of improved
energy efficiency
Table of Contents
Executive summary ... 5
1.
Introduction ... 6
1.1 Energy Efficiency Definition ... 6
2.
The Scottish Energy Mix ... 7
2.1 Energy consumption in Scotland ... 7
2.2 Electricity in Scotland ... 8
2.3 Heat in Scotland ... 8
2.4 Transport ... 9
3.
Overview of energy efficiency policy in Scotland ... 9
3.1 The Climate Change Plan Draft ... 9
3.1.1 The Decarbonisation Pathway ... 10
3.2 The Draft Scottish Energy Strategy ... 11
3.2.1 A whole-system view ... 11
3.2.2 A stable, managed energy transition ... 12
3.2.3 A smarter model of local energy provision ... 13
3.3 Scotland’s Energy Efficiency Programme (SEEP) ... 13
3.3.1 Aims and Objectives of SEEP ... 14
3.3.2 SEEP delivery scenarios and challenges ... 14
3.4 UK energy efficiency policy ... 15
3.5 EU policy ... 16
4.
The energy system ... 18
4.1 The energy system flow chart ... 18
5.
The TIMES model ... 22
5.1 TIMES general structure ... 22
5.2 TIMES modelling elements ... 23
5.3 Time and data management ... 25
5.4 The optimization process in TIMES ... 26
5.5 Summary of inputs and outputs ... 27
5.6 Assumptions and considerations when using TIMES. ... 29
5.7 Energy efficiency modelling in TIMES ... 29
5.7.1 Creation of energy efficiency scenarios in TIMES ... 31
5.8 TIMES application example: decarbonisation pathways ... 31
6.
Review of energy efficiency related research in TIMES and further developments of the model ... 38
6.1 Exploratory studies using TIMES ... 38
6.2 Research on further development of TIMES... 39
7.
Review of soft-linking approaches with TIMES ... 41
7.1 Studies linking TIMES with power system models (PLEXOS) ... 41
7.2 Studies linking TIMES with CGE models ... 42
7.3 Challenges in soft-linking of models ... 44
8.
Discussion of strengths and limitations of the TIMES model ... 45
8.1 TIMES Strengths ... 45
8.2 TIMES limitations ... 45
9.
Plans for further use of TIMES in energy efficiency analysis ... 49
9.1 Use TIMES as it is ... 49
9.2 TIMES improvements ... 49
9.3 Soft-linking with other models ... 50
10.
Conclusions ... 51
Table of Figures
Figure 1. Scotland’s Primary and Final Energy, 2014 (Scottish Government, 2017b). ... 7
Figure 2. decarbonisation pathway to 2032 (Scottish Government, 2017a). ... 10
Figure 3. Policy delivery options (Scottish Government, 2017c). ... 15
Figure 4. Energy system flow chart ... 18
Figure 5. Examples of Block 2, energy system flow chart. ... 19
Figure 6. Examples of Block 3, energy system flow chart. ... 19
Figure 7. Possible alternative flows in block 3, energy system flow chart. ... 20
Figure 8. Examples of Block 4, energy system flow chart. ... 20
Figure 9. Examples of Block 5, energy system flow chart. ... 21
Figure 10. Potential energy efficiency actions in the energy system. ... 21
Figure 11. Modelling of the energy system in TIMES. ... 22
Figure 12. TIMES model schematic (“IEA-ETSAP | Times,” n.d.). ... 23
Figure 13. Basic schematic of technology, commodity and commodity flow in TIMES. ... 24
Figure 14. Example of time-slices in TIMES (Loulou et al., 2005). ... 25
Figure 15. Technology and energy resource substitution example in TIMES. ... 27
Figure 16. Summary of TIMES inputs and outputs. ... 28
Figure 17. Example of energy efficiency modelling in TIMES. ... 30
Figure 18. Energy efficiency (E.E.) options in TIMES at the different energy system stages.... 31
Figure 19. Total GHG emissions by sector. ... 32
Figure 20. GHG emissions difference between scenarios (LOW_GHG - BASE). ... 33
Figure 21. Electricity consumption (from distribution grid) by sector. ... 34
Figure 22. Gas consumption (from distribution grid) by sector. ... 35
Figure 23. Residential heat production by technology (existing houses). ... 36
Figure 24. Residential heat production by technology (new houses). ... 37
Executive summary
The Scottish Government has set very ambitious targets and policies in its Climate Change Plan to decarbonise the energy system. The Scottish TIMES model is as a key tool informing these new climate change policies. TIMES is a well-known, widely used model. However, the adequacy of TIMES for energy efficiency policy analysis has not been assessed in the literature. This report sets out the potential for using TIMES to understand the system impacts of energy efficiency improvements, based upon work by ClimateXChange Fellow Christian Calvillo at Strathclyde University.
This report describes the generic structure of the TIMES modelling framework to help a wider audience to understand the capabilities of this type of model. The report reviews energy efficiency related work in TIMES, and assesses the main strengths and limitations of TIMES. The main challenges identified in the specific context of using TIMES for energy efficiency analysis are:
• Energy efficiency implementation in TIMES is not straightforward. Several approaches could be followed, delivering potentially different results.
• Decisions are cost driven. The cost minimisation algorithm would lead to outcomes involving extreme specialisation (corner solutions), if not prevented by user determined constraints (e.g. imposing maximum shares for different technologies).
• Energy demands and actions and reactions across the wider economy impacts are not modelled within TIMES. More generally, market “problems” and other drivers for consumer behaviour are not captured.
The report outlines several options to address or mitigate these modelling issues, and proposes ways forward in using TIMES for energy efficiency analysis. The three main possibilities are:
1. Use TIMES as it is. This should be considered as the first step in energy efficiency analysis. The current versions of TIMES can deliver reasonable outputs and useful insight. However, any limitations of TIMES should be taken into account when interpreting the results.
2. Develop TIMES improvements. Implementing improvements in the specification of the TIMES model to deal with issues such as those outlined above is potentially a second step in the analysis of energy efficiency changes, one that is likely only to be feasible in the medium term. Some of these developments might require relatively little time and resources to implement, while others will require important changes on the model structure and data. Hence, an assessment of the potential benefits in relation to the required resources for a TIMES improvement must be done beforehand, as it might be more convenient to rely on soft-linking with other models.
1.
Introduction
For several years, the Scottish Government has shown its commitment to tackling climate change, with ambitious targets and policies to reduce GHG emissions, and transform the energy system into a largely decarbonised one. Recently, several documents have been released by the Scottish Government, updating their decarbonisation targets. The Scottish TIMES model is a key tool informing the new climate change policies (Scottish Government, 2017a), which at the same time, drives other policies such as the Scottish Energy Strategy (Scottish Government, 2017b) and the Scottish Energy Efficiency Programme (Scottish Government, 2017c).
TIMES is a well-known, widely used model, with over 100 country versions and considerably more related studies (Connolly et al., 2010). However, the adequacy of TIMES for energy efficiency policy analysis has not been assessed in the literature. The main objectives for this report are:
1. Provide an assessment of strengths and limitations of the TIMES model, to analyse the impacts of energy efficiency changes in the Scottish energy system and on the wider economy.
2. Give recommendations on how TIMES can be used to assess the impacts of energy efficiency changes, and how can it be complemented with existing and potential new modelling approaches.
Therefore, this report seeks to assist Scottish policy makers to design the best energy efficiency policy measures, by using TIMES and other models judiciously.
The report is organised in 10 sections:
• A brief definition of energy efficiency is provided in section 1.1, to understand the differences with energy conservation.
• Section 2 presents an overview of the current state of Scotland’s energy mix.
• Section 3 reviews briefly the most relevant energy efficiency policies in Scotland, the UK and the EU.
• Section 4 provides a general description of the energy system.
• Section 5 gives an overview of the TIMES model and how it represents the energy system.
• Section 6 presents a brief literature review of TIMES research work related to energy efficiency and further developments of the model.
• Section 7 continues with the literature review, but presenting cases where TIMES is soft-linked with other models, and remarking on the most common soft-linking challenges.
• Section 8 comments on the strengths and limitations of TIMES in energy efficiency analysis, also providing some of the typically suggested solutions.
• Section 9 presents recommendations on how the Scottish government could proceed in energy efficiency analysis, using TIMES.
• Lastly, section 10 presents concluding remarks, and makes some suggestions for research activity going forward.
1.1
Energy Efficiency Definition
According to the International Energy Agency (IEA) (“Energy efficiency,” n.d.), energy efficiency is a way of managing and restraining the growth in energy consumption. “Something is more energy efficient if it delivers more services for the same energy input, or the same services for less energy input” (“Energy efficiency,” n.d.).
However, and as remarked in (“What’s Energy Efficiency?,” n.d.), energy efficiency is not energy conservation. Energy conservation refers to reducing or not using a service to save energy. For example: Turning off a light is energy conservation. Replacing an incandescent lamp with a compact fluorescent lamp (which uses much less energy to produce the same amount of light) is an example of energy efficiency.
2.
The Scottish Energy Mix
The short overview of the Scottish energy mix presented in this section is based on the report “Energy in Scotland 2016” (Scottish Government, 2016) and the “Draft Scottish Energy Strategy” (Scottish Government, 2017b).
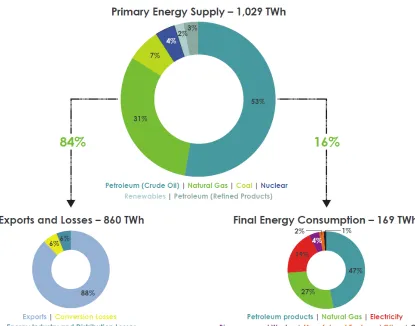
[image:7.612.49.464.201.527.2]The following figure, taken from (Scottish Government, 2017b), summarizes the energy mix and energy usage in Scotland. It can be seen that petroleum and gas are the main primary energy sources (84% together), and that the largest share of the total energy production goes to exports and losses (84%) and only a small share (16%) is consumed locally.
Figure 1. Scotland’s Primary and Final Energy, 2014 (Scottish Government, 2017b).
2.1
Energy consumption in Scotland
Energy consumption in Scotland can be divided into three main consumption sectors: electricity with 21% of total consumption, heat with 54%, and transport with 25% (Scottish Government, 2016). Hence, the efforts towards energy efficiency on heat have the potential to be extremely significant (see section 3). Furthermore, the total heat and electricity consumption (excluding transport) is split between domestic consumption with a 41% share, and industrial/commercial with 59% (Scottish Government, 2016).
Government, 2017d). This suggests that the Scottish lower energy consumption is not necessarily related to slower economic growth but to other factors, which may include the implementation of energy conservation and/or efficiency measures.
The energy reduction in Scotland can be broken down for different energy uses:
• Domestic 17% reduction
• Non-domestic 17% reduction
• Transport 9% reduction
2.2
Electricity in Scotland
As mentioned before, electricity makes up 21% of total energy consumption in Scotland. In the year 2015, the electricity generation mix (energy production) was:
• gas with a 4% contribution to the total;
• coal with 17%;
• oil with 2%;
• pumped hydro with 1%;
• nuclear with 35%; and
• renewables with 42% (Scottish Government, 2017b).
This mix shows that low carbon technologies (nuclear and renewables) account for two thirds of total generation. Renewables are taking an important role in the electricity mix. The share of gross consumption1 provided by renewables has been gradually incremented from 10% in 2001 to almost 59% in 2015 (Scottish Government, 2017b). Also, it is interesting to note that from the renewable technologies, the two bigger components are wind power (62% at 2014) and hydro (29% at 2014) (Scottish Government, 2016). Additionally, more off-shore wind projects are expected for the coming years.
The use of electrical energy falls mainly in the domestic sector with 41%, industry uses 28%, transport only uses 1% of the total electricity, and 29% is used by other sectors (Scottish Government, 2016). Another important characteristic to consider is that Scotland has traditionally been a net exporter of electricity (mainly to the rest of the GB). In 2015, Scotland exported 29% of the electricity generated (Scottish Government, 2017b).
2.3
Heat in Scotland
54% of total energy consumption in Scotland is heat (non-electrical). From this energy, 41% is consumed domestically and 59% in the commercial and industrial sectors (Scottish Government, 2016). Overall, the heat production is done with gas and oil but renewable sources are slowly gaining presence. For instance, in 2013, 2.7% of the total heat demand was supplied by renewables (Scottish Government, 2016).
Indeed, the most used heating fuel in Scotland is gas, of which 57% is used in the domestic sector (Scottish Government, 2016). From all the Scottish households, in 2014, 78% use mains gas as their primary heating fuel, 13% use electricity, 6% oil, 1% communal heating, and 2% others. Note that, in 2014, the total domestic and non-domestic gas consumption has shown a decrement of 31% and 20%, respectively, in comparison with the consumption of year 2005 (Scottish
Government, 2016).
Regarding renewable heat, since 2008 – 2009, generation has more than tripled, from 845GWh to 3,031GWh in 2014 (Scottish Government, 2016). The most commonly used renewable heat technologies are biomass with 89% (57% of it is used directly for heat production, and 32% is used as combined heat and power CHP), followed by heat pumps with 5%2, and energy from waste 6%. Solar thermal technologies have a very small share of less than 1%. Also, it may be noted that most of the renewable heat installations are micro in size (less than 45kWth) with 89% of the total (Scottish Government, 2016).
1Scotland’s annual electricity demand
2.4
Transport
The transport sector is estimated to account for 25% of Scotland’s total energy use. From this energy, the share to transport people is about 60% and to transport goods is about 40%. The main fuel input for transport is still petroleum with a share of biofuels of 3.3% in year 2015 (Scottish Government, 2016). The petroleum fuel used in 2013 is divided among buses 6%, diesel cars 24%, petrol cars 32%, heavy goods vehicles 23%, motor-cycles 0.4%, diesel large goods vehicles 15%, and petrol large goods vehicles 1% (Scottish Government, 2016).
There has been a change in road and rail energy consumption from 2005 to 2013, with a reduction of 8% in road transport, an increment of 6% in rail transport, and an overall reduction of 7% (Scottish Government, 2016). It is also noted in (Scottish Government, 2016) that car traffic (in number of road miles) has not changed significantly from 2009 to 2014, while the distance cycled is estimated to have increased by 18.1%. In addition, the number of bus and ferry passengers has decreased by 9.8%, and 4.7% respectively, while air and rail passenger numbers have increased by 7% and 20.5%, respectively, in the same period.
The total transport energy demand has been steadily decreasing from 2007 (mainly due technology efficiency improvements and high fuel costs) and it is expected to continue to do so (Scottish Government, 2016).
3.
Overview of energy efficiency policy in Scotland
Several documents addressing Scottish energy efficiency policy have been produced by the Scottish Government, since the Climate Change (Scotland) Act 2009 and the plan “Conserve and Save: The Energy Efficiency Action Plan for
Scotland” (Scottish Government, 2010).
For the sake of brevity, this section reviews only the latest documents released on energy efficiency related policies: the Draft Climate Change Plan - the draft Third Report on Policies and Proposals 2017-2032 (Scottish Government, 2017a), the Draft Scottish Energy Strategy: The Future of Energy in Scotland (Scottish Government, 2017b), and National Infrastructure Priority for Energy Efficiency - Scotland’s Energy Efficiency Programme (Scottish Government, 2017c). Additionally, for the purpose of comparison, this overview includes a brief look into the UK’s energy efficiency policy (from (“Energy efficiency | Energy UK,” n.d.) and (“Energy Company Obligation,” 2016)) and the EU energy policy (from (“2030 Energy Strategy - Energy - European Commission,” n.d.)).
3.1
The Draft Climate Change Plan
The draft Climate Change Plan (Scottish Government, 2017a) includes the Scottish Government’s third report on policies and proposals for meeting its greenhouse gas emission reduction targets from 2017 to 2032. This document was
presented in the Scottish Parliament on 19 January 2017, and was subject to a 60-day period for Parliamentary consideration.
The development of the draft Climate Change Plan draws significantly on outputs of the Scottish TIMES model (Scottish Government, 2017a). The Scottish TIMES model is a high level strategic model, that covers the entire Scottish energy system, and contains thousands of variables capturing existing and future technologies and processes. Models such as TIMES aim to capture the main characteristics of an energy system and the interlinkages within it. While this is the first time a model like this has been available for Scotland, they are widely used internationally in modelling climate and energy policy choices. A more detailed description of the TIMES model is provided in section 5.
3.1.1
The Decarbonisation Pathway
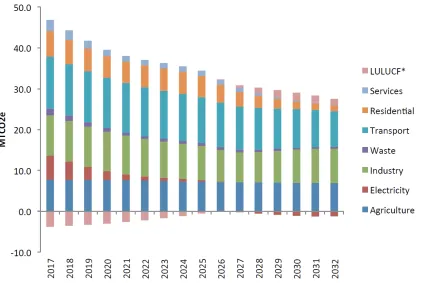
The Scottish Parliament passed legislation in October 2016, setting the third batch of annual targets for the years 2028 to 2032. The targets set an emission reduction pathway to 2032 and in doing so establish a 2032 target that represents a 66% emission reduction below 1990 levels3(Scottish Government, 2017a). This section summarises the proposed
[image:10.612.44.470.138.421.2]decarbonisation pathway out to 2032 as suggested by TIMES, organized by sector (see Figure 2, taken from (Scottish Government, 2017a)).
Figure 2. decarbonisation pathway to 2032 (Scottish Government, 2017a).
The main points of the pathway set out in the draft Climate Change Plan (Scottish Government, 2017a) include:
• The electricity system will be wholly decarbonised by 2032, and its share of total energy supply is expected to grow. Electricity will be increasingly important as a power source for heat and transport, and it will also be used for carbon capture and storage (which, through use of biomass fuel, explains the negative values in Figure 2).
• All the non-domestic buildings (service sector) will be near zero carbon emissions by 2032.
o Energy efficiency improvements will be the main focus of the efforts up to 2025.
o After 2025, the priority will be low carbon heat, with virtually all natural gas boilers being replaced by low
carbon heat technologies by 2032.
• The residential sector will follow a similar approach to the services sector, although the rate of emissions reduction is slower particularly until 2025 (focus during this period is on energy efficiency measures, such as building envelope).
• Transport will experience a significant decarbonisation as well, with emissions reducing by 32% in 2032 compared to 2014. This will be mainly achieved by changing towards more efficient low emissions vehicles and transport systems.
3 The 1990 base year uses 1990 for carbon dioxide, methane and nitrous oxide and 1995 for hydrofluorocarbons,
perfluorocarbons and sulphur hexafluoride, and is measured in MtCO2e (million tonnes carbon dioxide equivalent) (Scottish
• The decarbonisation plans for the industrial sector are broadly consistent with existing EU and UK regulatory frameworks for industrial emissions with a fall of around 19% by 2032.
o This will be achieved through a combination of fuel diversification, cost saving energy efficiency and heat
recovery, and participation in the EU Emissions Trading System (EU ETS).
• In the waste sector there are two main targets.
o By 2020, the landfilling of biodegradable municipal waste will be phased out, ahead of the statutory ban
that applies from 2021 in Scotland.
o By 2030 it is expected to reduce food waste by 50%, following the UN Sustainable Development Goals.
• On agriculture, the objective is for Scotland to be among the lowest carbon and most efficient food producers in the world.
• In terms of the Land Use, Land Use Change and Forestry (LULUCF) sector the draft Plan sets out the Scottish Government’s ambitions specifically on forestry and peatland.
o By 2020, 50,000 hectares of degraded peatland will have been restored, relative to a 1990 baseline. o By 2030 the peatland will be increased to 250,000 hectares, representing an improvement of valuable
soils in around 20% of Scotland’s landmass.
o Also, by 2032, Scotland’s woodland cover will increase from around 18% to 21% of the Scottish land area.
3.2
The Draft Scottish Energy Strategy
The draft Scottish Energy Strategy: The Future of Energy in Scotland (Scottish Government, 2017b) is presented as a free-standing companion to the draft Climate Change Plan (described in section 3.1). This draft Energy Strategy presents a statement of Scotland’s long-term vision of energy supply and use, aligned with the greenhouse gas emissions
reduction targets.
The energy strategy document takes a more exploratory approach, providing opportunities to demonstrate and consider alternative sources of low carbon energy supply. There are four separate consultation documents published to
accompany the draft Scottish Energy Strategy: • Onshore Wind Policy Statement
• Scotland’s Energy Efficiency Programme
• Local Heat & Energy Efficiency Strategies and District Heating • Unconventional Oil and Gas
The draft Scottish Energy Strategy explores the choices to be taken about Scotland’s future energy system, against the requirements of:
• the continued, sustainable and inclusive growth of Scotland’s economy;
• secure and reliable energy supply;
• better and more affordable energy for consumers; and
• long-term, sustained decarbonisation – as set out by Scotland’s 2050 climate change targets.
Moreover, the Scottish Government’s 2050 energy vision is aligned to three themes: a) a whole-system view, b) a stable, managed energy transition, and c) a smarter model of local energy provision.
3.2.1
A whole-system view
As mentioned in section 3.1, the draft Scottish Energy Strategy follows a whole-system view of energy policy. The proposed integrated approach recognises the interactions and effects that the elements of the energy system have on each other, and it was one of the main motivations on using TIMES in the climate change plan (Scottish Government, 2017a). Therefore, a new 2030 ‘all-energy’ target has been established, aiming for the equivalent of 50% of Scotland’s heat, transport and electricity consumption to be supplied from renewable sources by 2030 (Scottish Government, 2017b).
recognising the significant economic benefits of energy efficiency investment and the importance of tackling fuel poverty. The SEEP document is described in detail in section 3.3.
3.2.2
A stable, managed energy transition
In the draft Scottish Energy Strategy: The Future of Energy in Scotland (Scottish Government, 2017b), it is mentioned that the Scottish Government is taking actions to tackle climate change while boosting the economy. Note that the draft does not present potential development paths for the economy (the wider economy is not modelled in TIMES), and it does not specify a unique energy mix for 2050. Instead it tries to highlight the range of technologies and fuels that will meet the energy needs at that period of time. The draft focuses on the following priorities:
• Continuing to support the recovery of North Sea oil and gas as a highly regulated source of hydrocarbon fuels
• Supporting the demonstration and commercialisation of Carbon Capture and Storage and CO2 Utilisation
• Exploring the role of new energy sources in Scotland’s energy system
• Increasing renewable energy generation
• Increasing the flexibility, efficiency, and resilience of the energy system as a whole.
According to the draft Energy Strategy, the Scottish Government remains committed to maintaining domestic oil and gas production and maximising economic recovery from the oil and gas fields in the North Sea and west of Shetland. One of the main reasons for maintaining domestic production of offshore oil and gas industry is to prevent Scotland becoming more dependent on imports, potentially contributing more to lower net global emissions than in the opposite scenario. In the exploration of new energy sources and carriers, the production of hydrogen seems a promising solution as it is a low carbon energy carrier that can be used in a variety of ways. For instance, in stationary power and Combined Heat and Power (CHP), in the gas main supply for heating, or to power fuel cells in different vehicles. It is envisaged that hydrogen gas will be present in the gas network moderately from 2020, and it is reckoned that there may be areas of the gas network where hydrogen could fuel 100% of the gas demand.
In this document it is also remarked that hydrogen may have the potential to deliver the lowest cost and least disruptive solution for the decarbonisation of heat. Nevertheless, other energy sources will also be explored, in particular, biomass (and derived versions) to join liquid biofuels as options for replacing fossil diesel and petrol in internal combustion engines.
As mentioned before, the draft Energy Strategy consultation is accompanied with a full public consultation on unconventional oil and gas (UOG), addressing developments involving hydraulic fracturing (fracking) and coal bed methane extraction in Scotland. Once that consultation closes and the responses have been independently analysed, Ministers will consider the full range of evidence, and make a recommendation to Parliament on the future of unconventional oil and gas in Scotland.
It is also stated in the draft Energy Strategy that carbon capture and storage has been identified as an essential element in the energy transition, and that Scotland is currently the best-placed country in Europe to realise Carbon Capture and Storage (CCS) at a commercial scale (Scottish Government, 2017b). Therefore, the Scottish Government will work with industry to assess opportunities for small scale CCS demonstration and CO2 utilisation projects. Also, it will explore the opportunity to combine hydrogen and bioenergy production and CCS4.
According to the draft Energy Strategy, the Scottish Government will be supporting the continued growth of the
renewable energy sector, with the objective of achieving the renewable energy targets of delivering 30% of energy from renewable sources by 2020, and 50% of all energy needs by 2030. Some of the technologies that will attract most efforts are offshore wind and marine renewable technologies. However, it is intended that onshore wind, hydro and solar power will continue to grow in the following years. Indeed, one important ambition of the Energy Strategy draft is to make Scotland the first area in the UK to host commercial onshore wind development without subsidy.
The draft Climate Change Plan pathway shows that electricity demand could increase by approximately 30% in Scotland as a result of further electrification of heat and transport. Hence, it is necessary to improve the flexibility and efficiency
4 One of the cheapest ways for producing hydrogen is through steam methane reforming of natural gas (“Role of Hydrogen in
(and presumably the scale) of the electricity system in order to accommodate the increasing demand. This will provide great potential for investment in a range of smart, flexible and grid-friendly technologies that can provide a range of benefits to the energy system in Scotland. In addition, new flexibility mechanisms and storage, including battery systems and pumped hydro storage (PHS), could play an even greater role in the future energy system.
3.2.3
A smarter model for local energy provision
It is recognised in the Draft Energy Strategy that Scotland has been moving away from traditional centralised energy supply and passive consumption models. The existence of numerous areas of constrained electricity grid and the desire for renewable generation, have driven innovation in technology, systems, business and engineering models for local energy provision (Scottish Government, 2017b).
The Scottish Government has committed long-term funding to develop local energy systems through a number of initiatives, such as:
• the Low Carbon Infrastructure Transition Programme (LCITP) • Home Energy Efficiency Programme – Area Based Schemes • the Scotland Heat Map
• the District Heating Loan Fund
• the Renewable Energy Investment Fund (REIF)
• the Community and Renewable Energy Scheme (CARES)
• schemes delivered under CARES such as the Local Energy Challenge Fund and the Infrastructure and Innovation Fund
According to the draft Energy Strategy, there are nearly 600 operating installations across Scotland, with active projects ranging from small scale hydro schemes of under 100 kW to wind farms of up to 9 MW.
The Scottish Government also mentions that, with a focus on local energy, some of Scotland’s most pressing issues can be tackled, from security of supply to demand reduction, making energy supplies more affordable for households and businesses, and stimulate regeneration and local economic renewal(Scottish Government, 2017b). More detail on the local energy provision approach is presented in SEEP (see section 3.3).
3.3
Scotland’s Energy Efficiency Programme (SEEP)
Following the targets set in the draft Climate Change Plan (Scottish Government, 2017a), of reducing emissions in Scotland by 42% by 2020 and at least 80% by 2050 (relative to 1990 levels), the plan outlines the actions and individual targets for the different sectors across the economy. In particular, the residential and services (non-domestic buildings) sectors will have emissions reductions of 75% and 98%, respectively, by 2032 in comparison with 2014 levels. These targets will require a transition of all homes, commercial properties and the public sector in Scotland, to be near zero carbon by the middle of this century (Scottish Government, 2017c).
Scotland’s Energy Efficiency Programme (SEEP) (Scottish Government, 2017c), which is under development, and will be rolled out from 2018, has been proposed to be the cornerstone to achieve these decarbonisation targets. The specific goals of SEEP are to:
• improve the energy efficiency of Scotland’s buildings; • decarbonise their heat supply; and
• tackle fuel poverty.
The Scottish Government points to the multiple benefits that it says will accompany SEEP. These benefits not only contributes to meeting Scotland’s climate change targets but also offer significant wider economic, social, health and regeneration benefits (Scottish Government, 2017c). These include:
• Measures to make the Scottish homes and work places warmer and more comfortable, in an affordable way. This will, at the same time, help to tackle fuel poverty and improve the competitiveness of the economy.
• Health and early year’s improvements thanks to people living in warmer homes.
• Regeneration of districts and communities thanks to the upgraded building stock.
• Substantially reduced greenhouse gas emissions.
3.3.1
Aims and Objectives of SEEP
As previously mentioned, SEEP aims to reduce energy demand, decarbonise the heating of Scotland’s built environment and tackle fuel poverty in a way that is socially and economically sustainable.
The draft Climate Change Plan sets a series of policy outcomes, which SEEP has adopted as its objectives, including that:
• 94% of non-domestic buildings’ and 80% of domestic buildings’ heat will be supplied using low carbon heat technologies by 2032; and
• improvements to the fabric of Scotland’s non-domestic and domestic buildings results in a 10% and 6% reduction, respectively, in their heat demand by 2032.
The draft Climate Change Plan recognises that installation of low carbon heating solutions such as renewable heat will continue to increase throughout the SEEP period. However, the greatest shift away from gas is likely to take place after 2025.
It is also recognised by the Scottish Government that demand reduction measures (primarily through fabric
improvements to buildings, or process improvements to equipment) and heat decarbonisation measures will need to operate together. Hence, the near-zero carbon approach that new buildings are already moving towards, needs to be considered for existing buildings as well (Scottish Government, 2017c).
Note that the above targets concern low carbon heating and energy efficiency for buildings. There is no specific target in SEEP for fuel poverty or a nationwide energy efficiency target (including transport and industry).
3.3.2
SEEP delivery scenarios and challenges
Given the scale and scope of SEEP, a phased approach has been designed to be carried out over a number of years to enable the successful development of all elements of the Programme (Scottish Government, 2017c). The Programme is planned in three key phases:
1. A design phase, including the setting of formal targets for the Programme through the Climate Change Plan and Energy Strategy (see sections 3.1 and 3.2 above), which is expected to continue to run up to early 2018.
2. A development phase in which the key elements of the Programme are developed and deployed over time to create the overall programme structure which is expected to run through until 2021 – 2022.
3. A full deployment phase, which would be subject to regular review, evaluation and refinement (up to 2032). Additionally, during the initial phases of the Programme, the focus of the Scottish Government will be on supporting and delivering existing programmes more effectively and developing new pilot schemes to test delivery mechanisms for domestic and non-domestic buildings.
Throughout the duration of the programme, the Scottish Government recognises that there are many different routes to deliver and implement SEEP, successfully achieving the described objectives. As shown in in Figure 3 (taken from
(Scottish Government, 2017c)), the delivery options can range in the spectrum of choice: freedom of choice vs
Figure 3. Policy delivery options (Scottish Government, 2017c).
During the scoping of SEEP, different stakeholders were invited to advise on the policy and delivery framework for the programme. The key issues that have been raised by the stakeholders are:
• the role of regulation, standards and financial incentives;
• the definition of sources and level of funding;
• the provision of advice, information and consumer protection;
• the establishment and operation of local supply chains and trusted delivery agents;
• the nature of programme delivery;
• the balance between local and national responsibilities; and
• monitoring and review processes.
From these opportunities and challenges, the importance of the involvement and participation of the people stands out. According to the reviewed stakeholders, the Scottish Government need to have further intervention to stimulate market demand for energy efficiency improvements and low carbon heat. In addition, standards, regulatory frameworks and financial incentives are needed to give clarity to consumers about what is expected, and to make it as easy as possible and the norm to invest in energy efficiency and heat (Scottish Government, 2017c).
The methodology to assess targets and standards will be important. Stakeholders mentioned that SEEP should adopt well-understood and consistent means of assessing the potential for improvement and decarbonisation of buildings. However, many also questioned whether existing methodologies are fit for purpose, basing assessments on modelled energy use, noting the potential for tailored building-level assessment (rather than assessment at individual unit basis) and for area-wide assessment. Further discussion on the potential policy delivery scenarios can be found in the SEEP draft (Scottish Government, 2017c).
3.4
UK energy efficiency policy
The Energy Companies Obligation (ECO) provides support for packages of energy efficiency measures. ECO creates a legal obligation on energy suppliers to improve the energy efficiency of households. Suppliers are given targets based on their share of the domestic gas and electricity market. The targets are grouped in three areas:
• The Carbon Emissions Reduction Obligation (CERO) which focuses on “hard-to-treat” homes and, in particular, measures that cannot be fully funded through the Green Deal (“Green Deal,” n.d.). Solid wall insulation and hard-to-treat cavity wall insulation are two examples. Other insulation measures and connections to district heating systems are also eligible if they are promoted as part of a package that includes solid wall insulation or hard-to-treat cavity wall insulation.
• The Carbon Saving Community Obligation (CSCO) which focuses on the provision of insulation measures and connections to district heating systems to domestic energy users that live within an area of low income. 15% of this target must be achieved by promoting measures to low income and vulnerable households living in rural areas.
• The Home Heating Cost Reduction Obligation (HHCRO) under which suppliers provide measures which improve the ability of low income and vulnerable households to affordably heat their homes.
It is interesting to note that ECO will be changing soon. The scheme is coming to an end in 2017 and, starting from April 2017, will be replaced by a one-year transition scheme focusing on the fuel-poor. Key proposals for this new scheme should focus on the customers who need the energy efficiency measures the most. Also, it should enable local authorities to identify eligible customers.
3.5
EU policy
The EU can provide a supportive policy context that aids achieving the Scottish energy and climate change targets. In 2007, an energy policy for Europe, common to all member states, established goals for the 2020 horizon. Since then, a new energy policy framework has been developed, with revised targets for 2030 (“2030 Energy Strategy - Energy - European Commission,” n.d.). The European energy policy is based on three main aspects: sustainability, security of supply and competiveness.
The main objective regarding sustainability is to address climate change by reducing EU emissions to a level that limits the global temperature increments to 2ºC in comparison with pre-industrial levels. To achieve this, a first set of targets were set in 2008 (20% reduction in GHG emissions, 20% improvement in energy efficiency, 20% of renewable sources generation, for year 2020) but, recently, these targets have been revised and adapted for the 2030 framework. It includes the following targets:
• Emission reduction of over 40% by 2030 (in comparison with 1990 levels)
• Reform and improve the EU emission trading system
• Renewable energy target of 27% by 2030
• Energy efficiency target of 27% by 2030 (this is a non-binding target)
• 15% target on energy interconnections between member states
Moreover, EU leaders recognize that energy technological innovation is key to achieving the 2030 targets. Hence, more efforts are considered in research and innovation policy.
Security of supply has become a priority in energy policy after the Russian-Ukrainian gas conflict in 2014. EU leaders have agreed on a European energy security strategy, ensuring solidarity between member states, diversification of supply sources and transportations routes, and improvements on security of oil stocks, gas and electricity generation. This strategy has measures on the short, medium, and long-term, and also pushes for the establishment of a European single energy market.
4.
The energy system
This section provides a brief description of one typical representation of the energy system, highlighting the main processes involved from the extraction of the energy resources until the final end-use of energy, and examples of the different stages the energy carriers pass through. This particular representation of the energy system has been selected as it relates to the way that this is modelled within TIMES.
This overview of the energy system is also intended to assist in understanding the TIMES model (described in section 5).
4.1
The energy system flow chart
According to the IPCC fifth assessment report (Bruckner et al., 2014), the energy sector (energy system), “comprises all energy extraction, conversion, storage, transmission, and distribution processes that deliver final energy to the end-use sectors (industry, transport, and building, as well as agriculture and forestry).” Therefore, in a simple way, the energy system can be described as the series of transformations of the raw energy resources that are needed to supply energy services to end users.
According to (Bruckner et al., 2014), the energy system is composed of four main elements:
• Energy sources
• Energy carriers
• Processes
• Energy demand
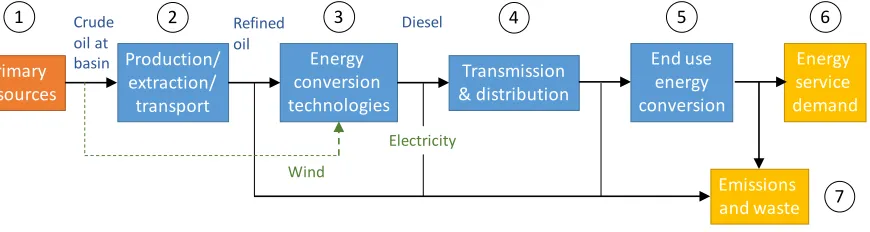
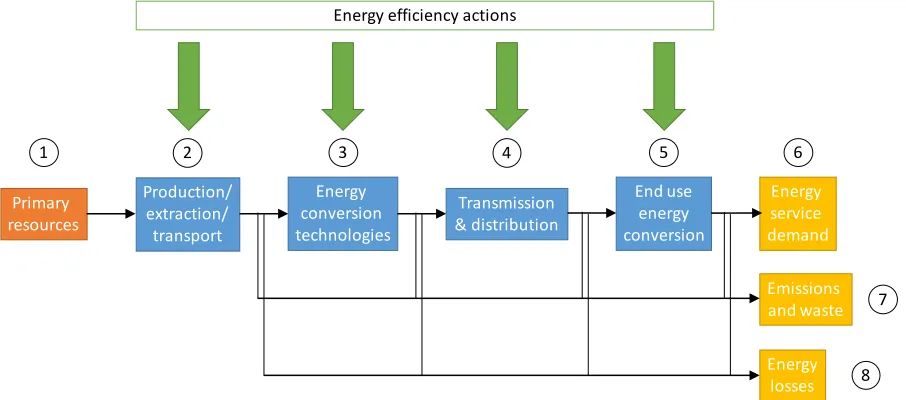
[image:18.612.39.495.442.587.2]The energy sources are the main inputs to the system, and need to be transformed for their end use. The energy carriers are transmitters of energy, occupying intermediate steps in the energy-supply chain between primary energy sources and end-use applications (IPCC, n.d.). Examples of energy carriers include solid, liquid and gaseous fuels, as well as electricity and heat. The energy system processes comprise all the necessary steps to supply energy to the end user, such as energy conversion, transmission and distribution. Lastly, the outputs of the energy system are the energy services used to meet the energy users’ need. Figure 4 shows the general energy system flow chart, including 7 blocks. These blocks are described in detail below.
Figure 4. Energy system flow chart
Block 1 represents the main inputs for the whole energy system, referring to raw materials and raw energy resources that cannot be used in their current form. Examples of such resources include:
• oil and gas reserves;
• renewable resources, such as wind, sun, or rain;
• trees; and
• minerals such as coal (before being mined).
Block 2 represents the first processing of raw materials to make them available and/or usable. This first processing includes extraction of the raw material, transportation and any other processes that the raw energy carrier might need
Inputs of the energy system
Energy system processes
Outputs of the energy system
1 2 3 4 5 6
7 Primary
resources
Production/ extraction/
transport
Energy conversion technologies
Transmission & distribution
Energy service demand End use
energy conversion
before energy conversion. The inputs of this block will be raw energy sources. The outputs will be processed energy carriers (ready for energy conversion).
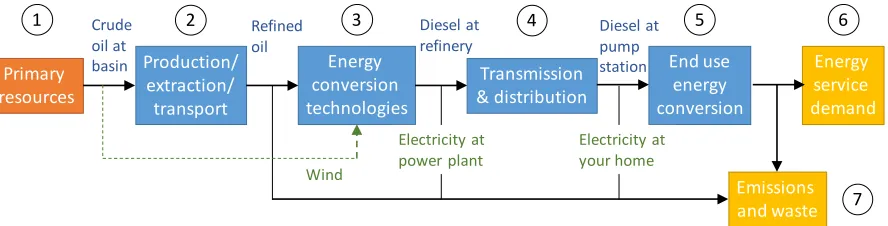
[image:19.612.55.486.185.304.2]As an example of block 2, we can take crude oil (see Figure 5). The raw version of oil is in a reserve. It needs to be extracted, transported to a petrochemical facility, and refined. These processes will fall in block 2. Therefore, the input of this block would be crude oil at a reserve, and the output would be refined oil ready to be transformed in other fuels. Note that not all energy carriers need to go through some (or any) of these processes (block 2). For instance, some renewable resources, such as wind, do not need any extraction or transportation and can be directly be used to produce electricity (energy conversion in block 3, see Figure 5).
Figure 5. Examples of Block 2, energy system flow chart.
Block 3 corresponds to the conversion process of energy carriers. It does not involve end use, but the transformation of one energy carrier to another, facilitating the transmission and distribution of it.
Continuing with the examples shown in Figure 5, in block 3 the refined oil (previously pre-processed in block 2) is ready to be transformed into a range of different fuels. The input then would be refined oil at a reserve, and the outputs are fossil fuels such as gasoline or diesel (see Figure 6).
Wind power is a different example. Unlike crude oil, wind power does not require any pre-processing (made in block 2), so it can be directly used to produce electric energy with a wind turbine (the energy conversion technology in block 3). Therefore, the input for this block is wind, and the output is electricity (see Figure 6).
Figure 6. Examples of Block 3, energy system flow chart.
Some energy carriers might pass through several conversion stages (such as hydrogen or any sort of energy storage), while others might only need the end use energy conversion (in block 5). For instance, some types of biomass such as wood, after extraction from the forest (in block 2), can be directly used in an oven (block 5) for cooking (see Figure 7).
1 2 3 4 5 6
7 Primary resources Production/ extraction/ transport Energy conversion technologies Transmission & distribution Energy service demand End use energy conversion Emissions and waste Crude oil at basin Refined oil
(wind or solar power)
1 2 3 4 5 6
[image:19.612.52.487.481.597.2]Figure 7. Possible alternative flows in block 3, energy system flow chart.
The processes in block 4 correspond to the transmission and distribution of energy carriers, from the generation side to the final consumer, making it accessible for the end use services. These processes do not involve an energy conversion. In other words, the inputs and outputs will be of the same type of energy carrier (e.g. input electricity, output electricity). The typical energy carriers that go through these processes are electricity, gas, and other fuels, such as gasoline or diesel. As mentioned before, not all energy carriers require this process and can pass directly from block 2 to block 5. For example, wood as biomass when used locally (see Figure 7).
Typical examples for block 4 include, diesel (or gasoline), and electricity. In the case of the former, the previously processed crude oil is now a fuel and is ready to be taken to consumers via a distribution network (pipes and/or tankers). Hence, the input in this case would be diesel at the refinery, and the output would be diesel at the pump station (see Figure 8). For the latter, the generated electrical energy (from wind power or any other source) is ready to go through the transmission and distribution network to end consumers. In this case, the input is electricity at the power plants, and the output is electricity at your home socket (see Figure 8). Note that, even though there is no energy
conversion at this stage, these transmission and distribution processes are associated with costs and losses (e.g. electricity losses, gas leakage or fuel cost in moving petrol or diesel).
Figure 8. Examples of Block 4, energy system flow chart.
Block 5 is the last process in the energy system, involving the energy conversion technologies to meet end use service demand (represented in block 6). This block represents the wider range of conversion technologies, from house
appliances to industrial machines, also including all the vehicles for transportation. It may also be noted that, depending on the energy conversion technology, one energy carrier can have several energy demand outputs. For instance,
electricity could be used for heating, domestic hot water and illumination.
Continuing with our previous examples, in block 5 the diesel can be used to fuel a bus, providing a public transportation service. So, the input is the diesel at the pump station and the output is the transportation service. On the other hand, the electricity available at the household is used to power a light bulb, providing light. Hence, the input is the electricity from the mains and the output is the illumination service (see Figure 9).
1 2 3 4 5 6
7 Primary resources Production/ extraction/ transport Energy conversion technologies Transmission & distribution Energy service demand End use energy conversion Emissions and waste (wood)
1 2 3 4 5 6
7 Primary resources Production/ extraction/ transport Energy conversion technologies Transmission & distribution Energy service demand End use energy conversion Emissions and waste Electricity at your home Wind Electricity at power plant Crude oil at basin Refined
oil Diesel at refinery Diesel at pump
[image:20.612.43.487.445.558.2]Figure 9. Examples of Block 5, energy system flow chart.
Block 6 represents the last link of the energy system chain. It includes the energy service demands (end-use of the energy) across all sectors. As mentioned before, most services (especially in the residential sector) could be met by different energy carriers and/or conversion technologies. Examples of residential services that could be supplied by electricity, gas or other fuels are heating, domestic hot water, illumination, cooking, etc.
Besides emissions and waste, all the processes present energy losses (block 8, see Figure 10). Processes in blocks 2, 3, 4 and 5 are carried out with certain energy efficiency. Therefore, energy efficiency measures could be implemented at all these stages, and not only at the end use energy conversion process (block 5). Examples of energy efficiency measures at the different stages of the energy system can be found in section 5.7.
Also, energy efficiency could be measured in different ways and at different points. For instance, energy efficiency could be measured in block 3, looking into the amount of input energy and the output. For a full energy system efficiency measurement, it would be necessary to check from block 1 to block 6.
Figure 10. Potential energy efficiency actions in the energy system.
1 2 3 4 5 6
7 Primary resources Production/ extraction/ transport Energy conversion technologies Transmission & distribution Energy service demand End use energy conversion Emissions and waste Light (light bulb) Wind Electricity at your home Electricity at power plant Crude oil at basin Refined
oil Diesel at refinery Diesel at pump station
Transport service (Bus)
1 2 3 4 5 6
[image:21.612.38.491.396.596.2]5.
The TIMES model
The TIMES (The Integrated MARKAL-EFOM System) model was developed by the IEA-ETSAP (Energy Technology Systems Analysis Program) to conduct in-depth energy and environmental analyses (Loulou et al., 2004). TIMES is an energy system-wide bottom-up model, which considers a great number of different technologies. TIMES uses
linear-programming to find a least-cost provision of energy to meet specified energy service demands, according to a number of user constraints (including GHG emissions, energy use, etc.), over medium to long-term time horizons. Therefore, the main objective of TIMES is to be used to explore possible energy futures based on contrasted scenarios (Loulou et al., 2005).
TIMES models cover all the processes of the energy system (see section 4 for a description of the energy system). In other words, it covers all the steps from primary resources through all the processes that transform, transport, distribute and convert energy to supply energy services. On the energy supply-side, it comprises fuel mining, primary and secondary production, and exogenous imports and exports. Energy is delivered through various energy carriers to the demand-side, which is structured by sectors: residential, commercial, agricultural, transport and industrial (“IEA-ETSAP | Times,” n.d.).
Note that the TIMES review provided in this section is a brief description to give a general understanding of the model. More detailed documentation can be found in (Loulou et al., 2004) and (Loulou et al., 2005).
5.1
TIMES general structure
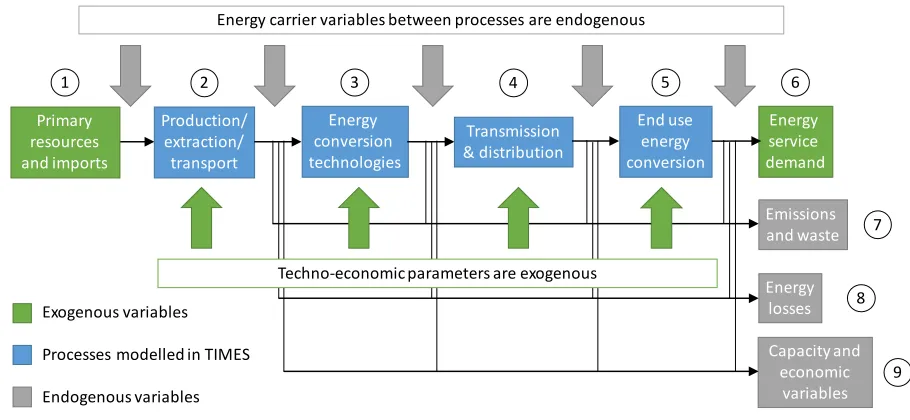
TIMES models the energy system as shown in Figure 11. Contrasting this scheme with the energy system presented in section 4.1, it can be seen that the inputs and outputs of the TIMES model are different. The inputs (exogenous variables to the model), driving all the energy system, are the data of the supply and demand side. The former is composed by the primary energy resources and imports availability (block 1), and the latter corresponds to energy service demands (block 6). The outputs of the model (endogenous variables) include emissions and waste variables (block 7), energy losses associated with the different processes (block 8), capacity planning of the different technologies and different economic variables (block 9), including energy prices, costs, profits, etc. In addition, energy carrier variables (energy flows)
[image:22.612.75.530.464.674.2]between the different steps of the energy system are also endogenous to the model, while the numerous techno-economic parameters of the technologies and processes are exogenous. These parameters include technology costs (per unit), discount rates, efficiencies, and other technical constraints.
Figure 11. Modelling of the energy system in TIMES.
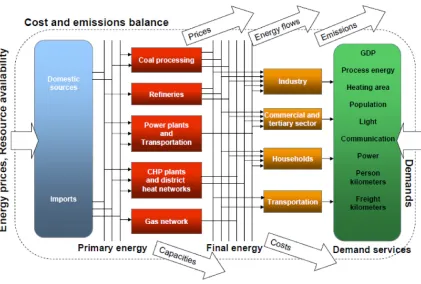
The IEA-ETSAP provides a different schematic of the TIMES model, as shown in Figure 12. This figure is a different representation of the energy system but it is composed of the same elements described previously. The inputs in Figure
1 2 3 4 5 6
7 Production/ extraction/ transport Energy conversion technologies Transmission & distribution Energy service demand End use energy conversion Emissions and waste 8 Energy losses 9 Capacity and economic variables Energy carrier variables between processes are endogenous
Techno-economic parameters are exogenous Primary
resources and imports
Exogenous variables
Processes modelled in TIMES
12 correspond to blocks 1 and 6 of Figure 11, being from the supply side the domestic sources and energy imports, and from the end-user side, the energy service demands. All the processes of the energy system (shown in blocks 2 to 5, in Figure 11) are aggregated in the red blocks shown in Figure 12. Then, Figure 12 shows explicitly the way the demand is aggregated in four sectors: Industry, commercial and tertiary sector, households and transports (brown blocks). Note that there are other outputs of the model, as shown in Figure 12, including: energy prices and energy flows, technology capacities, emissions and economic costs.
Figure 12. TIMES model schematic (“IEA-ETSAP | Times,” n.d.).
5.2
TIMES modelling elements
After reviewing the general structure of the TIMES model, it is now possible to describe the specifics of the modelling approach of the energy system used in TIMES.
The first important characteristic to consider is that all the elements, processes, inputs and outputs of the energy system are modelled in TIMES as these three elements (“IEA-ETSAP | Times,” n.d.):
• Technologies (also called processes)
• Commodities
• Commodity flows
In TIMES, the commodities are all the energy carriers, energy services, materials, monetary flows, and emissions. Some examples of commodities are electricity or coal (energy carriers), heating or transportation of heavy goods (energy services), costs (monetary flows), and CO2 or NOx (emissions).
Lastly, commodity flows are the links between processes and commodities. In other words, a flow is of the same nature as a commodity but is attached to a particular process, and represents an input or an output of that process. Note that some processes can have more than one input commodity and/or more than one output commodity, and the
[image:24.612.44.487.133.233.2]input/output commodity could be of the same type or different (see Figure 13). An example of a technology providing two different output commodities are combined heat and power systems (fuel cells, micro turbines, etc.), that uses a single input energy carrier such as gas, producing two energy carriers: electricity and heat.
Figure 13. Basic schematic of technology, commodity and commodity flow in TIMES.
Note that, besides the energy carrier output commodities, most technologies and/or processes in TIMES produce other commodities such as emissions, money flows (costs and or profits), and energy losses. Also, the technologies and/or processes in TIMES are modelled by different exogenous techno-economic parameters. These parameters define the types of commodities used as inputs and outputs, and the performance and costs of the process and/or technologies. Examples of these parameters include: operational efficiency, technology investment costs, operation and maintenance costs, discount rates, technology lifespan, emissions per unit of production, etc.
Taking the energy system example of crude oil shown in Figure 9, the equivalent TIMES modelling would be as follows:
• The crude oil at the basin would be a commodity. The maximum availability of this commodity will be defined exogenously (e.g. 10 million of barrels), and the TIMES model will decide how much of that reserve will be used and when (the commodity flow).
• The commodity flow would be the amount of crude oil that goes into the extraction, production and transport processes (grouped together in block 2 of Figure 9, but in TIMES they could be separated processes with many technology alternatives). In these processes the input and output commodities are different, as well as the commodity flows. For instance, 1 million barrels of crude oil is the input to the process, and 800 000 barrels of refined oil is the output commodity flow.
• The commodity refined oil goes into a refinery (energy conversion process, block 3 in Figure 9) to obtain the commodity diesel. In this case, the commodity flows are 800 000 barrels of refined oil as input, and 1500 MWh of diesel.
• The next process is the transmission and distribution of the diesel commodity (block 4 in Figure 9). In this process, the input and output commodities are the same: diesel. However, in TIMES it will be defined as two different commodities: diesel before and after distribution, and the commodity flows are different due to losses. For instance, an input of 1500MWh, will deliver an output of 1450 MWh of diesel.
• The final process involves the energy conversion technologies for end use (block 5 in Figure 9). The commodity, diesel, is transformed in the energy service public transport (also a commodity), the energy conversion technology being the bus. For this process, the input commodity flow is 1450 MWh of diesel, and the output commodity is 1200 MWh of public transport, for example. The demand of the public transport commodity, in this case expressed in MWh of energy demand, is dictated as an exogenous variable.
Note that this example is a simplified version of all the elements involved in an actual TIMES implementation, yet it provides an adequate overview of equivalent elements and the modelling approach carried out in TIMES. Also, note that the figures of commodity flows given in the above examples are for illustrative purposes only, and might not represent realistic values.
Technology
(process)
Commodity 1
Commodity 2
Commodity 3
Commodity 2
Com. flow 1
Com. flow 2
Com. flow 3
5.3
Time and data management
TIMES is a long-term planning model, with time horizons up to 2050 or 2100. Considering that most variables in TIMES are time specific (e.g. energy flows, emissions, etc.), the number of variables duplicates with each time step considered. Therefore, it becomes impractical to model every hour of every year, as the size of the problem increases considerably and with exponentially longer solution times.
[image:25.612.45.486.191.443.2]To avoid overcomplicating the optimization model, TIMES considers only some representative time-slices that work as an average of the elements of that time period. Figure 14 (taken from (Loulou et al., 2005)) shows an example of the time-slice organisation in TIMES. Note that it is not time-sequential simulation.
Figure 14. Example of time-slices in TIMES (Loulou et al., 2005).
It can be seen in the figure that TIMES considers four levels of time granularity. The first level, which is the coarser, is the time period division. Each time period is composed by several years, and is represented by a milestone year. These periods are designed so the model can make long-lasting decisions and changes, such as technology investments or policy changes. Therefore, each year in a given period is considered identical (capacities, commodity flows, operating levels, etc.), except for investment variables, which are usually computed only once in a period (the milestone year). In other words, the model only considers building new facilities or adding new technologies in certain years. Note that the size of the time periods and the selection of milestone years can be defined by the user, and it does not have to be the same for the whole time horizon. For instance, four time periods of five years with the milestone year at the middle of the period, followed by two time periods of 10 years with the milestone year at the beginning of the period.
The second level of granularity is the time divisions within a year, normally representing seasons (spring, summer, fall and winter, as in Figure 14), but may be defined at will by the user. Hence, these seasonal slices normally represents groups of months.
The third level of granularity is the weekly divisions, normally differentiating between working days and weekends at each season, representing several similar days (which are assumed to be equal between them).
Considering that many energy service demands (and thus, the energy supply side) are significantly different at different seasons, type of days and even time of the day, the time-slices are a particularly important feature in TIMES. For instance, heating requirements are very different in winter in comparison with summer, and they are also different in a working day than in the weekend. Also, some energy production technologies have different characteristics depending on the time of year (independently of the demand side), such as wind turbines, solar panels, or run-of-the-river hydro plants. Therefore, it is important that many of these commodities are modelled with this time slicing.
Regarding data management, TIMES relies on interpolating or extrapolating to fill up any data gaps. Due to the future long term horizon of the optimization problem, it is necessary to use data projections in TIMES. Examples of such projections include: international energy prices, energy service demand, technology costs, etc. The projections are given to TIMES as exogenous variables (see Figure 11), but normally the projections do not have the same detail as the model, making it necessary to extrapolate or interpolate the missing data from the actual projections. An example of this could be the following:
• Data of 2015 are input to the model.
• Time periods of five years are selected with milestone years at the beginning of the period, and a time horizon until 2050.
• A projection of 20% of electricity demand decrement by 2050 (in comparison to 2015 levels) is given to the model.
• If the demand details for the milestone years are not provided by the user, these values will be populated as a linear interpolation between the values of 2015 and 2050.
• Similarly, if the time horizon is extended to 2060, the missing demand values would be extrapolated from the given values.
5.4
The optimization process in TIMES
As mentioned, the objective of the optimization process in TIMES is to find the least cost energy system, while making sure that there is a balance between supply and demand sides. In other words, the energy supply technologies must produce the required energy in a cost-effective way to meet the energy service demands.
Indeed, the Objective Function in TIMES is the discounted sum of the annual costs minus revenues across all time periods (i.e. assumes perfect foresight). This includes construction costs (technology investments), operation costs (O&M, imports, delivery and transport costs, etc.), and revenues from energy supply, exports and decommissioning. The energy service demands are exogenous to the model. However, the technology use and energy flows are
endogenous, meaning that TIMES can decide which energy carriers and technologies can be used to meet the demand. This feature is one of the mains strengths of TIMES, as it allows commodity (energy carrier) substitution and technology (process) substitution. Therefore, many different potential energy roadmaps can be found under different economic, energy efficiency5, and emission reduction scenarios. For instance, Figure 15 shows an example of the possible
substitution of energy carriers and conversion technologies to provide one or two commodities in the residential sector.
Figure 15. Technology and energy resource substitution example in TIMES.
Note that TIMES scenarios can be built as a combination of different input data sets (e.g. different demand scenarios), and/or user defined constraints, such as GHG emission caps or technology adoption and usage limits.
5.5
Summary of inputs and outputs
Figure 16 shows a summary of the inputs and outputs of the TIMES model.
Technology
Gas heating
Oil heating
Electric heating
Gas water boiler
Elc. water boiler
Figure 16. Summary of TIMES inputs and outputs.
The inputs (exogenous variables) of TIMES can be grouped in five categories:
• Demand parameters, mainly composed by end-use demands (normally measured in energy units) and energy demand elasticities. In TIMES, the demands for energy services can implement certain elasticity, simulating economic feedback in the energy system. Note that the energy service demand elasticity is a feature that is available in the general TIMES model, but not all model versions implement it.
• Technology database, which is the largest part of the input data for TIMES. This includes all the techno-economic attributes that described the different technologies and processes modelled in TIMES. Examples of such parameters include operation efficiency, technology investment costs, operation and maintenance costs, discount rates, technology lifespan, etc.
• Environmental parameters, mainly used to estimate the emissions produced at all stages of the energy system. They include technology emission coefficients, environmental targets, taxes and/or subsidies related to environmental performance.
• Economic parameters, including the energy and material prices and availability of primary resources and imports (block 1 in Figure 11) and the discount rate. There is a general discount rate for TIMES. However, different discount rates can be implemented by technology and/or sector.
• Other model parameters, required for the correct operation of TIMES. For instance, the time periods, time slices, year management, etc.
Regarding the outputs of TIMES (endogenous variables), they can be summarised in:
• Technology investment and operation, including installed capacities and energy flows. Cost information and revenues are also provided (technology investments, operation and maintenance costs, revenues, etc.).
• Energy and material imports and exports, energy flows organized by energy commodity, and the related costs and profits are obtained as well.
• Emission trajectories and sectorial measurements, referring to the emission production detail for each process and technology, individually or aggregated by sector.
• Adjusted demand for energy services, when demand elasticity has been implemented. This give information of changes on the end-use energy demand.
TIMES
Technology database
Demand parameters
Economic parameters
Environmental parameters
Model specific parameters
Technology investment and operation
Adjusted energy service demand*
Import and export flows
Emission trajectories
Total system costs